


Services on Demand
Article
 English (pdf)
 Article in xml format
 Article references
Indicators

Related links
-
 Cited by Google
 -
 Similars in Google
Share

 Permalink
South African Journal of Science
On-line version ISSN 1996-7489
Print version ISSN 0038-2353
S. Afr. j. sci. vol.110 n.5-6 Pretoria Mar. 2014
COMMENTARY
Anything but simple: Inappropriate use of euclidean distance in Govinder et al. (2013)
Victor M.H. Borden
Department of Educational Leadership and Policy Studies, Indiana University, Bloomington, Indiana, USA
Keywords: Equity Index; higher education; South Africa; benchmarking
The 'Equity Index' (EI) introduced by Govinder et al.1 has stimulated critiques addressing a variety of flaws in the use of this allegedly 'simple and objective' measure of racial and gender equity among South African higher education institutions. Dunne2 noted that the use of a mathematical formula and the resultant numerical result provides a false sense of validity and precision. He further described in great technical detail why measures of distance are not as simple as they may seem when portrayed, for explanatory purposes, as the distance between points in a two-dimensional space. Dunne also addresses several issues of substantive validity including the stochastic nature of social measures for which dynamic probabilistic models are required as compared to the mathematical models that serve physical phenomena like measuring distance between objects in space. Moultrie and Dorrington3 extend this critique, examining other mathematical (double counting) and conceptual (suitability of benchmark) problems.
As a long-time institutional research practitioner within the US context, I was intrigued by the publication of the index and the ensuing critiques as they touch upon the long-standing institutional research practices of peer institution benchmarking.4-6 Because of the diversity of the US higher education landscape, with over 7000 post-secondary institutions ranging from for-profit, single programme vocational institutions and 2-year community colleges to 4-year regional and comprehensive universities and both public and private research universities, it is not common for us to think of a single measure that can be applied equally to all institutions, or even to those that are internationally competitive for students and staff. Because of this complexity, we are well versed in comparing institutions across a variety of measures and dimensions, including the demographic and academic profile of students, the mix of academic programmes, the types of instructional and non-instructional staff, and revenue sources and expenditure targets. One thing we have learned from this vast experience is that there is no such thing as either a simple or objective measure of institutions in relation to a target (whether that be another institution or a regional or national benchmark).
In the remainder of this critique, I will illustrate the lack of reliability (and therefore questionable validity) of employing a Euclidean distance measure on the concatenated distribution of two sets of proportions (race and gender). Rather than explore the mathematical and technical dimensions of these problems, I will illustrate how the comparison of the 23 South African higher education institutions changes depending on what type of distance measure is used and whether it is used on race and gender separately or combined.
When comparing the 'position' of an institution relative to other institutions or to criterion benchmarks like the national representation among racial and gender groups, one must take into account the scale characteristics of the measurement variables (nominal, ordinal, interval, ratio), as well as the statistical relationship (association) among the variables. If one is simply considering race and gender as distinct variables, then it may be suitable to describe these as independent measures (the likelihood of being male or female is not contingent, at least conceptually, on the racial group). However, when the values of a proportional representation variable are portrayed as the values upon which comparisons are based, then, as Moultrie and Dorrington pointed out, there is redundancy. That is, the percentage of males is linearly dependent on the percentage of females (percentage males = 100 - percentage females). Thus, the values of the variable gender have only one degree of freedom. Moreover, as race entails four categories and gender two, if we assume equal probability of each category, the race factor has three times the weight in the characterisation of the position (because race is four groups, there are three degrees of freedom, compared to one for gender). However, race is not uniformly distributed (that is, the general probability for each category is not one divided by the number of categories), so one must take into account the non-linear qualities of proportions across the range values. More prosaically, a 5% point difference has different substantive meaning when an event is rare (e.g. 5%), or more common (e.g. 60%).
There is a wide variety of ways to calculate similarity or difference for use in a positioning (nearest neighbour) analysis. Even if one would like to use a Euclidean-based measure, there are several to choose from. Govinder et al. use the 'RSSD' version, that is, the root of the sum of squared differences. If the variables are on notably different scales in terms of variation, it is advisable to first transform the measures to their standardised form (value minus mean, divided by standard deviation). When using percentages, the Chord form of Euclidean distance is recommended, where the values are first subject to a square root transformation. There are several derivatives of the Euclidean form, such as a City Block metric and Minkowski metric that vary the root to which the difference between coordinate points is raised. In addition to Euclidean-based measures, there are correlation-based distance measures (Pearson and Spearman) and the Mahalanobis measure, which takes into account both Euclidean distance and covariance among the variables.
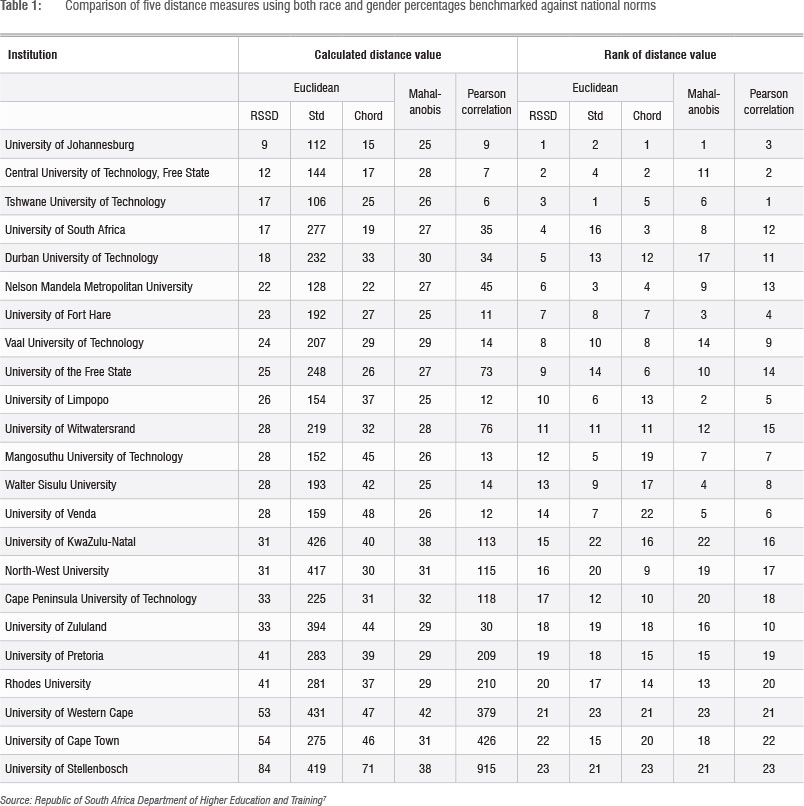
Tables 1 and 2 demonstrate how the calculated distance value and the rank of the 23 South African higher education institutions change depending on which proximity measure is used to calculate the distance from the national benchmark. For these tables, the benchmarks were taken from the Govinder et al. article and the proportions of enrolled students from the Department of Higher Education and Training document, Statistics on Post-School Education and Training in South Africa: 20117. The first three proximity measures included in Table 1 are three forms of the Euclidean distance: the RSSD version used by Govinder et al., one based on standardised values for each proportion, and the 'Chord' version, which is based on a square root transformation of the original values. In addition, the table shows the results using the Mahalanobis metric, which incorporates the covariance between the variables, and a measure based on the Pearson correlation, which has been reversed (Pearson values range from 1 for the most similar to 0 for the least similar, so the calculated value is subtracted from 1) and multiplied by 1000 to represent the value in integer digits. The rightmost columns of the tables show the rankings among the 23 institutions of the corresponding calculated values.
Table 1 exhibits these various distance measures for the combined race and gender proportions as employed by Govinder et al.1 The reader is reminded that there are several technical reasons why it is not appropriate to combine these proportions into a single estimation of distance, as noted in the critiques of Dunne2 and Moultrie and Dorrington3. Some of the ramifications for the inappropriateness of doing so are manifest in the variation of calculated distance values and rank in these tables. For example, the Central University of Technology, ranked 2nd using the RSSD calculation, is ranked 11th using the Mahalanobis measure. Durban University of Technology varies considerably by the four measures, as high as 5th using the RSSD and as low as 17th using the Mahalanobis metric.
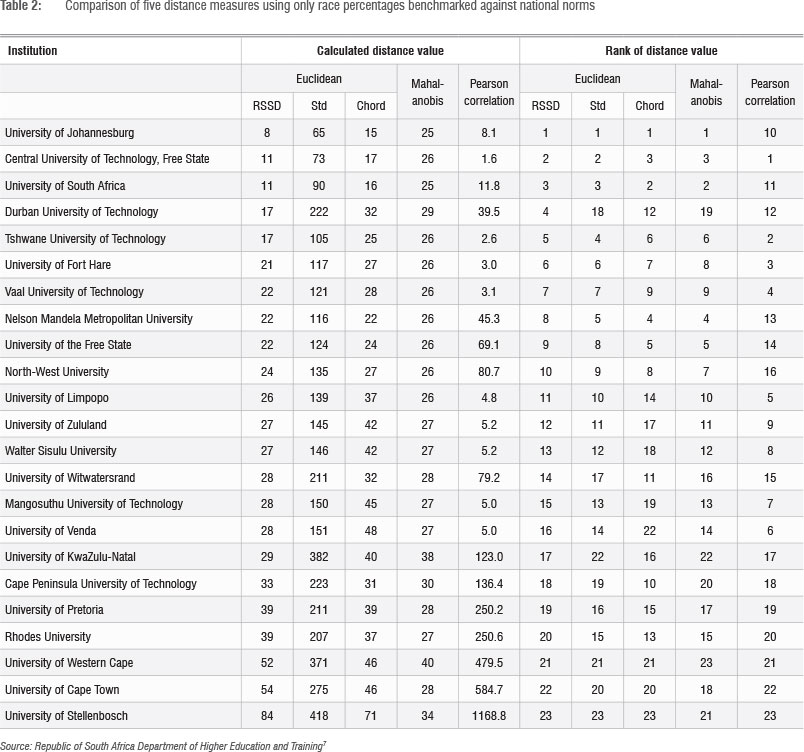
Table 2 uses the same five measures on the four categories of race. While not suggesting that examining race alone establishes evidence of equity, the benchmarking of distance from the national norms is a cleaner measurement concept than when incorporating race and gender into a single measure. Although the rankings for race alone are not as varied as they are for race and gender combined, they still vary considerably. For example, University of Johannesburg, which is ranked 1st by four measures, is ranked 10th using the Pearson correlation measure. It is also interesting to note that the Chord version of the Euclidean measure, which is generally recommended over RSSD for percentage measures, varies considerably from the RSSD measure.
Establishing equity
Although it is not without controversy, it is instructive to consider how equity is established in other, long-standing methodologies. For example, the US Department of Labor's Office of Federal Contract Compliance, has required since the early 1970s that organisations and businesses that obtain federal contracts establish the equity in both hiring and compensation of their workforce. The compliance requirements revolve around 'labour-market availability' within job groups that are defined according to the wages, job duties and responsibilities, and training requirements. Specifically, the requirements (http://www.dol.gov/ofccp/ scaap.htm) note8:
...federal contractors must conduct availability analyses to determine the percentage of women and minorities who have the skills required to perform the jobs within each job group... Availability involves calculation of minorities and women who are 'available' to work in the job from both external sources (i.e., hired from outside the company) and internal sources (e.g., transfer or promotion of existing employee in the company)...For calculating 'external' availability, you want to consider who is qualified for the job within 'the reasonable recruitment area' for that job. The 'reasonable recruitment area' represents the area from which a contractor usually seeks or reasonably could seek workers for a particular job group.
Assessing equity in academic programmes can be considered as analogous. To be admitted to an academic programme, students must meet certain basic requirements, such as having completed a secondary education credential and having basic skills suited to a specific programme of study (for example, higher order math skills for engineering and higher order writing skills for communications). Students must also live within commuting distance (except perhaps for UNISA). Comparing proportions of women and racial groups enrolled at a particular university to a generic national benchmark masks all of the availability issues, which are at the root of establishing equity. Throughout my 30 years of experience in using evidence and analysis to address educational access issues, I have found that it is far more constructive to confront directly and as complexly as possible the root causes of inequity, such as those revealed through the many aspects of 'availability'. Conversely, reducing to a single measure such complex phenomena tends to shift attention away from the root causes and can be used by various groups and individuals to absolve the responsibility that we all share in addressing such issues. Establishing equity is anything but simple.
References
1. Govinder KS, Makgoba MW. An Equity Index for South Africa. S Afr J Sci. 2013;109(5/6), Art. #a0020, 2 pages. http://dx.doi.org/10.1590/sajs.2013/a0020 [ Links ]
2. Dunne T. Mathematical errors, smoke and mirrors in pursuit of an illusion: Comments on Govinder et al. (2013). S Afr J Sci. 2014;110(1/2), Art. #a0047, 6 pages. http://dx.doi.org/10.1590/sajs.2014/a0047 [ Links ]
3. Moultrie TA, Dorrington RE. Flaws in the approach and application of the Equity Index: Comments on Govinder et al. (2013). S Afr J Sci. 2014;110(1/2), Art. #a0049, 5 pages. http://dx.doi.org/10.1590/sajs.2014/a0049 [ Links ]
4. James GW. Developing institutional comparisons. In: Howard RD, McLaughlin GW, Knight WE, editors. The handbook of instituitonal research. San Francisco, CA: Jossey-Bass; 2012. p. 644-655. [ Links ]
5. Terinzini PT, Hartmark L, L'Orange Jr. WG, Shirley RC. A conceptual and methodological approach to the identification of peer institutions. Res High Educ. 1980;12(4):347-364. [ Links ]
6. McCormick AC, Zhao CM. Rethinking and reframing the Carnegie classification. Change. 2005;37(5):51-57. [ Links ]
7. Department of Higher Education and Training, Republic of South Africa. Statistics on post-school education and training in South Africa. Pretoria: Department of Higher Education and Training; 2011. [ Links ]
8. US Department of Labor. Office of Federal Contract Compliance Programs [homepage on the Internet]. No date [cited 2014 May 09]. Available from: http://www.dol.gov/ofccp/scaap.htm [ Links ]
 Correspondence:
Victor Borden
Department of Educational Leadership and Policy Studies
Indiana University, 201 N. Rose Avenue, Bloomington
IN 47405-1006, USA
vborden@iu.edu

