


Services on Demand
Article
 English (pdf)
 Article in xml format
 Article references
Indicators

Related links
-
 Cited by Google
 -
 Similars in Google
Share

 Permalink
South African Journal of Science
On-line version ISSN 1996-7489
Print version ISSN 0038-2353
S. Afr. j. sci. vol.110 n.3-4 Pretoria Feb. 2014
RESEARCH ARTICLE
Flood variation and soil nutrient content in floodplain vegetation communities in the Okavango Delta
Gaolathe Tsheboeng; Mphaphi Bonyongo; Mike Murray-Hudson
Okavango Research Institute, Maun, Botswana
ABSTRACT
We investigated the influence of hydroperiod variation on soil nutrient content in the Okavango Delta seasonal floodplains. Soil samples were collected from eight zones of homogenous vegetation cover after low and high floods and analysed for pH, Na, Mg, Ca, K and P content. A Student's t-test was used to test for differences in pH, Na, Mg, Ca, K and P between soils after low and high floods. The Kruskal-Wallis test was used to compare means of flooding duration and depth between low and high floods. Na, K, Mg, P and pH levels in soils were significantly different (p<0.05) after low floods compared with after high floods. Na content was lower (p<0.05) in Zones 2 and 8 and higher (p<0.05) in Zones 4, 5 and 6 during high flood than during low flood. Ca content was lower (p<0.05) in Zones 1, 2, 3, 4 and 5 and higher in Zone 7 (p<0.05) under high flood than during low flood. Mg content was lower (p<0.05) in Zones 1 and 5 and higher (p<0.05) in Zones 6, 7 and 8 during high flood than during low flood. K content was lower in Zones 1 and 3 and lower in Zones 6, 7 and 8 (p<0.05) during high flood than during low flood. pH was significantly lower and higher after a high flood in Zones 1 and 6, respectively, than during low flood. P content was significantly (p<0.05) higher in all zones after high flood than after low flood. Flooding depth and duration increased (p<0.05) in all vegetation zones during high flood. Our results have direct implications for molapo (flood recession) farming. We recommend that farmers plough immediately after the onset of flood recession when the soil is still moist and rich in nutrients.
Keywords: flood; communities; soil; vegetation; zones
Introduction
Soil nutrient dynamics in seasonal floodplain ecosystems are highly complex1 as a result of flood pulses and changing redoximorphic state.2,3 Flood pulse refers to the alternating dry and wet conditions in floodplain ecosystems.4 It facilitates soil nutrient exchange between rivers and their associated seasonal floodplains.5 During floods, soil nutrients dissolve in floodwaters and are transported from seasonal floodplain surfaces into adjacent rivers.4 Soil nutrients may also be transported from the river into seasonal floodplains through lateral flow.4 Flooding can lead to both increases and decreases in soil nutrient content. During flooding the soil becomes highly reduced, resulting in a decrease in pH which leads to an increase in the mobility of soil nutrients such as P N, Mg, Ca, Na and K.2 These nutrients include those that were deposited by the previous flood and those released from organic matter decomposition accumulated during dry periods.6 Soil flooding can cause hypoxia leading to a reduction in the soil nutrient content available to plants.7 As a result of hypoxia, the organic matter decomposition rate is reduced3, leading to low soil nutrient content release8.
Although the relationship between hydroperiod (flooding duration and depth) and soil nutrients has been extensively studied elsewhere,1,9-12 the Okavango Delta has received little attention in this regard. Two studies have shown13,14 that soil nutrient status in the Okavango Delta seasonal floodplains is influenced by hydroperiod. As a result of the soil moisture content gradient, seasonal floodplains experience unequal distribution of soil nutrients. Generally, soil nutrient content is higher in primary floodplains, followed by secondary floodplains, with tertiary floodplains having low soil nutrient content.13,14 However, these studies13,14 were conducted during a low flood (1996/1997 flooding season) in which flooding duration and depth were, respectively, short and shallow.
Since 2005, floods in the Okavango Delta have increased annually, with the highest floods to date recorded in 2010.15 The 1996/1997 low flood (389.33 m3/s) season measured at Mohembo was preceded by five consecutive years of low flood while the 2010 high flood (1043.33 m3/s) was preceded by five consecutive years of high floods.15 During high flood, flooding duration is prolonged and flooding depth increases. The surface area inundated (flood extent) also increases and as a result some tertiary floodplains which are usually not flooded during low floods become inundated. It is still not known how soil nutrient content in the Okavango Delta seasonal floodplains is influenced by a high flood. The Okavango Delta seasonal floodplains are important for the local people as they use them for crop production (molapo farming or flood recession farming). Because flooding is an important factor in nutrient cycling in the Delta, there is a need to establish how variation in hydroperiod affects its soil nutrient dynamics. Soil nutrient availability is significant as it supports primary production in seasonal floodplain vegetation communities.13 We therefore compared soil nutrient content after low (1996/1997) and high (2010) flood conditions. It was hypothesised that soil nutrient content would be lower during high flood than during low flood conditions.
Materials and methods
Study area
The study was conducted in the Nxaraga seasonal floodplains in the Okavango Delta (Figure 1). Nxaraga seasonal floodplains receive floods between May and October with approximately 500 mm of rainfall per year.16 The mean maximum summer temperature is 30.5 °C with a mean minimum of 14.8 °C.17 During winter, mean maximum temperature ranges between 25.3 °C and 28.7 °C while mean minimum temperature ranges between 7.0 °C and 10.0 °C.17
Soil sampling
The comparison of soil nutrient content between years 2010 and 1997 was done through re-sampling soil from zones sampled during low flood13 selected on the basis of homogenous vegetation cover along an elevation gradient between a river channel (low) and dry land (high). During low flood the vegetation zones were dominated by Alternanthera sessilis and Ludwigia stolonifera (Zone 1), Cyperus articulatus and Schoenoplectus corymbosus (Zone 2), Miscanthus junceus and Digitaria scalarum (Zone 3), Paspalidium obtusifolium and Panicum repens (Zone 4), Setaria sphacelata and Eragrostis inamoena (Zone 5), Imperata cylindrica and Setaria sphacelata (Zone 6), Vetiveria nigritana and Setaria sphacelata (Zone 7) and Sporobolus spicatus and Cynodon dactylon (Zone 8).18 During high flood, co-dominant species changed into Oxycaryum cubense and Vossia cuspidata (Zone 1), Cyperus articulatus and Schoenoplectus corymbosus (Zone 2), Miscanthus junceus and Pycreus flavescens (Zone 3), Eleocharis dulcis and Leersia hexandra (Zone 4), Eragrostis inamoena and Panicum repens (Zone 5), Imperata cylindrica (Zone 6), Vetiveria nigritana and Setaria sphacelata (Zone 7), and Sporobolus spicatus and Sporobolus acinifolius (Zone 8).19 Zones 1 and 2 were located in the primary floodplains which are closer to the river channel while Zones 3, 4, 5, 6 and 7 were located in secondary floodplains on relatively intermediately elevated areas. Zone 8 was found in the tertiary floodplains, which are relatively highly elevated areas.13
A total of 40 plots from an earlier study13 were re-sampled in September 2010. Soil samples were collected from five 5 m x 5 m plots in each of the eight pre-defined zones. From each plot, one soil sample was collected at a depth of between 0 and 300 mm using a soil auger. The soil samples were oven dried at 80 °C for 24 h, ground using a pestle and mortar and sieved through a 2-mm mesh. The samples were analysed for pH, extractable Na, P, Ca, Mg and K. pH was determined from a 1:1 soil: water suspension using a pH electrode (model 330i, Wissenschaftlich-Technische Werkstatten GmbH, Weilheim, Germany). K and Na content was determined using a flame photometer (model 410, Sherwood Scientific, Cambridge, UK) while Mg and Ca content was determined using a Varian atomic absorption spectrophotometer (Model AA 220, Varian, Sydney, Australia). Total P analysis was performed using a Bran+Luebbe Auto Analyser 3 (Norderstedt, Germany).
Hydroperiod sampling
Flooding depth was determined using a calibrated 2-m polyvinyl chloride pipe in all the plots where the soil samples were collected. Flooding duration was estimated as the number of weeks in which the plots were flooded.
Statistical data analysis
A Student's t-test was performed to compare soil nutrient content between low and high flood conditions in different floodplain vegetation zones. The Kruskal-Wallis test was used to compare the average flooding duration and depth between a low and high flood. Correlations between flooding depth, duration of flooding and soil nutrient status were performed using a Spearman's rank correlation with SPPS version 19, 2010.
Results
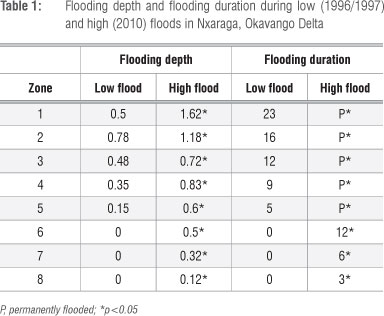
Flooding depth and duration were significantly (p<0.05) higher in all vegetation zones during high flood than during low flood (Table 1).
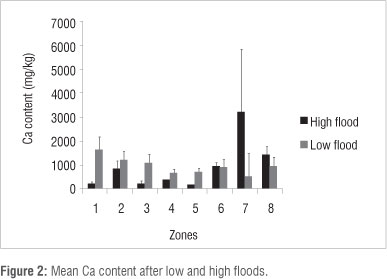
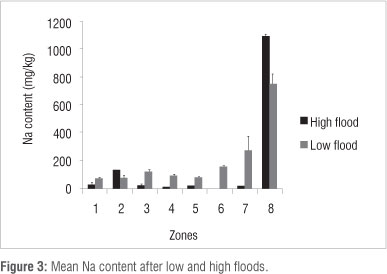
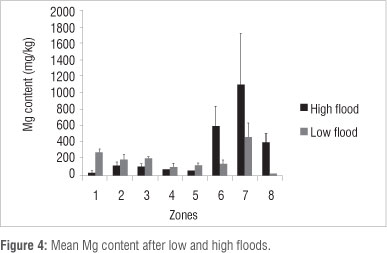
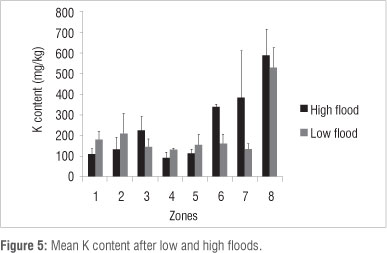
Ca content was lower (p<0.05) in Zones 1, 2, 3, 4 and 5 and higher in Zone 7 (p<0.05) under high flood conditions in 2010 than under low flood conditions in 1997 (Figure 2). Other differences (Zone 6) were not found to be significant at the p<0.05 level. Na content was lower (p<0.05) in vegetation Zones 2 and 8 and higher (p<0.05) in Zones 4, 5 and 6 during high flood than during low flood (Figure 3). Mg content was lower (p<0.05) in vegetation Zones 1 and 5 and higher (p<0.05) in Zones 6, 7, 8 during high flood than during low flood (Figure 4). K content was lower in vegetation Zones 1 and 3 and higher in Zones 6, 7 and 8 (p<0.05) during high flood than during low flood (Figure 5).
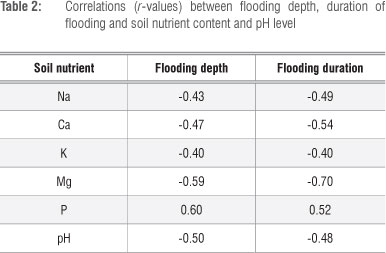
Correlation between hydroperiod and soil nutrient content
In 2010, Na, Ca, K and Mg content and pH level were negatively correlated with flooding depth and duration. P content was positively correlated with flooding depth and duration (Table 2).
Discussion
Soil nutrient content varied after low and high flood. With the exception of P, soil nutrient content generally increased with decreasing flooding depth and duration. K, Ca, Mg and Na contents were lower in Zones 1, 2 and 3 and higher in Zones 6, 7 and 8 in response to a high flood. These results are consistent with findings from previous studies.1,11,12,20,21 High K content in zones experiencing low flooding depth and short flooding duration was also observed in the seasonal floodplains of the Orinoco River1 and the Rhine and Narow Rivers12. In a study conducted in the Careiro Islands in the central Amazon, Na content was higher in dry zones than in flooded zones.20 The findings of this study also agree with the results from a study21 conducted in a Mongolian lake in which Ca content decreased with an increase in moisture content. It was also observed that Ca content increased with decreasing moisture content in a study conducted on the Lower Mkuze seasonal floodplain in South Africa.12
Low Ca, Mg, K and Na contents in vegetation Zones 1, 2, 3, 4 and 5 after a high flood could be a result of leaching and dilution22-24 because flooding increases the solubility of mineral nutrients2. It could be expected that during a high flood more soil nutrients dissolve in water and are lost through leaching as water infiltrates the soil. It could also be expected that because clay is negatively charged18 cations would bond to the soil particles, thus reducing leaching. However, leaching of cations has been found to be accelerated by dissociation of NO3- from HNO3 (from nitrification).18 Zones 1, 2, 3, 4 and 5 experienced high flooding depth and long flooding duration, which would suggest that more of their soil nutrients dissolved in the water and were lost through leaching.
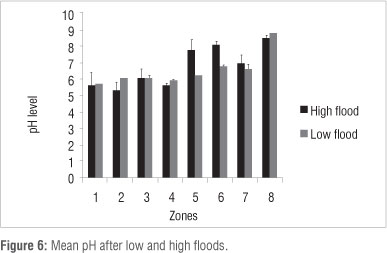
Another factor that could lead to reduced soil nutrients during high flood is the rate of decomposition of organic matter. Organic matter is a reservoir of nutrients which are released when it decomposes.25 During flooding, water displaces oxygen from the soil,26,27 leading to anaerobic conditions.28-30 Under anaerobic conditions, the rate of decomposition of organic matter declines, resulting in low soil nutrient content.3 It is likely that Zones 1, 2, 3, 4 and 5 experienced anaerobic conditions because of their relatively high flooding depth and long flooding duration, resulting in a low organic matter decomposition rate, and hence low soil nutrient content. In contrast K, Mg, Na and pH increased in vegetation Zones 6, 7 and 8 under high flood conditions.
High K, Mg, Na and pH after high floods in Zones 6, 7 and 8 could be attributed to increased organic matter decomposition rates, evapotranspiration and lateral flow deposition. Sediment deposition in floodplains leads to an increase in soil nutrients.29 Water and sediments from the main river channel are a source of dissolved nutrients to the floodplains.4,31 During high flood, vegetation Zones 1, 2, 3 and 4 were almost converted into permanent swamps and as a result soil nutrients could have been transported away from them into the peripheral Zones 6, 7 and 8 through lateral flow.31 Increased soil nutrients in Zones 6, 7 and 8 could also be attributed to organic matter accumulation and decomposition. During low floods, these zones were not inundated14 and as a result organic matter may have accumulated.31 When they received water during high floods, organic matter decomposition may have been triggered and nutrients released.6 Furthermore, when organic matter dries, it mineralises into soil nutrients such as Ca, thus increasing the soil content of these cations.32
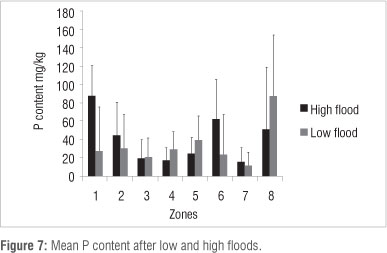
P content was higher after a high flood than after a low flood in all vegetation zones. P has a strong affinity to fine clay particles and it could be expected that during high floods more sediment is deposited, consequently leading to high P content.2,3,33 The high affinity of P (which exists as PO4-3 in solution) to clay is a result of lanthanum (has either + 2 or +3 charge) that is embedded in the clay structure.34 P binding to clay is also influenced by pH. It was found that P binding to clay decreased with an increase in pH from 7 to 9, which was attributed to formation of hydroxyl species of the lanthanum ions decreasing the number of P binding sites on the clay sites.34 A high flood is expected to lead to anoxic conditions because of increased water depth and prolonged waterlogging, which leads to mobilisation of P and results in its increase.2,3 Under aerobic conditions, P binds to iron oxides. Because of prolonged anaerobic conditions imposed by flooding, Fe bound to P is reduced from Fe (III) to Fe (II), releasing P from iron-phosphate complexes.2,3,35 It is expected that during low flooding conditions, P reacts with Ca, Al and Fe oxyhydroxides as a result of aerobic conditions, consequently reducing its available content in the soil.
Conclusion
Soil nutrient content increased in some vegetation zones while it decreased in others after high flooding. Ca and Mg content increased in Zone 7. Mg content also increased in Zones 6 and 8. K content increased in Zones 6, 7 and 8 while P content increased in all the zones. Na content increased in all zones except Zones 1 and 8. These results therefore show that flooding variation influences soil nutrient content in the Okavango Delta seasonal floodplains. These results have direct implications for molapo (flood recession) farming. We recommend that farmers plough immediately after the onset of flood recession when the soil is still moist and rich in nutrients.
Authors' contributions
G.T. was the project leader and was responsible for the data collection, analysis and write up. M.B. was responsible for the data collection and for providing technical writing advice. M.M-H. assisted in the statistical data analysis and provided technical writing advice.
References
1. Dezzeo N, Herrera R, Escalanta G, Chacon. Deposition of sediments during a flooding event on seasonally flooded area of the lower Orinoco River and two of its black water tributaries, Venezuela. Biogeochemistry. 2000;49:241-257. http://dx.doi.org/10.1023/A:1006375101368 [ Links ]
2. Mitsch WJ, Gosselink JG. Wetlands. New York: John Wiley and Sons; 2000. [ Links ]
3. Gallardo A. Spatial variability of soil properties in a floodplain forest in Northwest Spain. Ecosystems. 2003;6:564-576. http://dx.doi.org/10.1007/s10021-003-0198-9 [ Links ]
4. Junk WJ, Bayley PB, Sparks RE. The flood pulse concept in river-floodplain systems. In: Dodge DP, editor. Proceedings of the International Large River Symposium. Canadian special publication of fisheries and aquatic sciences. Ottawa: Department of Fisheries and Oceans; 1989. p. 110-127. [ Links ]
5. Valett HM, Baker MA, Morrice JA, Crawford CS, Molles Jr MC, Dahm CN, et al. Biogeochemical and metabolic responses to the flood pulse in a semiarid floodplain. Ecology. 2005;86(1):220-234. http://dx.doi.org/10.1890/03-4091 [ Links ]
6. Powell WG. Identifying land use/land cover (LULC) using data as a hydrologic model input for local floodplain management [research report]. San Marcos,TX: Texas State University; 2009. [ Links ]
7. Chen H, Qualls RG, Blank RR. Effect of soil flooding on photosynthesis, carbohydrate partitioning and nutrient uptake in the invasive exotic Lepidium latifolium. Aquat Bot. 2005;82:250-268. http://dx.doi.org/10.1016/j.aquabot.2005.02.013
8. Teyler G, Olsson T. Concentration of 60 elements in the soil solution as related to the soil acidity. Euro J S Sci. 2001;52:151-165. http://dx.doi.org/10.1046/j.1365-2389.2001.t01-1-00360.x
9. Terrill TH, Allen VG, Cranford JP Foster JG. Influence of moisture on chemical composition of annual ryegrass and digestibility by meadow voles. Virg J Sci. 1991;42(1):101-111.
10. Yavitt JB, Wieder RK, Wright JS. Soil nutrient dynamics in response to irrigation of a Panamanian tropical moist forest. Biogeochemistry. 1993;19(1):1-25. http://dx.doi.org/10.1007/BF00000572
11. Antheunise AM, Verhoeven JT. Short-term responses of soil nutrient dynamics and herbaceous riverine plant communities to summer inundation. Wetlands. 2008;28(1):232-244. http://dx.doi.org/10.1672/06-33.1
12. Humphries M. Sedimentation and chemical processes on the Lower Mkuze floodplain: Implications for wetland structure and function [PhD thesis]. Durban: University of KwaZulu-Natal; 2008.
13. Bonyongo MC. Vegetation ecology of the seasonal floodplains in the Okavango Delta, Botswana [MSc thesis]. Pretoria: University of Pretoria; 1999.
14. Bonyongo MC, Mubyana T. Soil nutrient status in vegetation communities of the Okavango Delta floodplains. S Afr J Sci. 2004;100:337-340.
15. Okavango Research Institute. Okavango Delta monitoring and forecasting [homepage on the Internet]. c2011 [cited 2011 Mar 23]. Available from: http://okavangodata.ub.bw/ori/monitoring/water [ Links ]
16. Wilson BH, Dincer T. An introduction to the hydrology and hydrography of the Okavango Delta. Proceedings of the Symposium on the Okavango Delta and its Future Utilization; Gaborone: National Museum; 1976.
17. Ellery K, Ellery WN, Rogers KH, Walker BH. Water depth and biotic insulation: Major determinants of back-swamp plant community composition. Wetlands Ecol Manage. 1991;1:149-162. http://dx.doi.org/10.1007/BF00177289
18. Barber SA. Soil nutrient bioavailability: A mechanistic approach. New York: Library of Congress; 1995.
19. Tsheboeng G, Bonyongo MC, Murray-Hudson M. Influence of flood variation on seasonal floodplain vegetation communities in the Okavango Delta. J Aqua Sci. In press 2014. [ Links ]
20. Alfaia SS, Falcao NP. Study of nutrient dynamics in the floodplain soils of Careiro Island-Central Amazonia. Amazon. 1993;12(3-4):485-493.
21. Strauss A, Schickoff U. Influence of soil-ecological conditions on vegetation zonation in a western Mongolian Lake shore-semi-desert ecotone. Erdkunde. 2007;61(1):72-92. http://dx.doi.org/10.3112/erdkunde.2007.01.05
22. Conklin AR. Introduction to soil chemistry: Analysis and instrumentation. New Jersey: John Wiley and Sons; 2005. http://dx.doi.org/10.1002/0471728225 [ Links ]
23. Day FP. Litter decomposition rates in the seasonally flooded great dismal swamp. Ecology. 1982;63:670-678. http://dx.doi.org/10.2307/1936787
24. De Datta SK. Principles and practices of rice production. New York: John Wiley and Sons; 1981. [ Links ]
25. Gosz JR. Organic matter and nutrient dynamics of the forest floor in the Hubbard Brook forest. Oecologia. 1976;22:305-320. http://dx.doi.org/10.1007/BF00345310
26. Lobo PC Jolly CA. Tolerance of hypoxia and anoxia in neotropical tree species. In: Scarano FR, Franco AC, editors. Ecophysiological strategies of xerophytic and amphibious plants in the neotropics. Oecol Bras. 1998;5:137-156.
27. Hefting M, Clement JC, Dowrick D, Losanday A-C, Bernal S, Cimpian C, et al. Water table elevation controls on soil nitrogen cycling in riparian wetlands along European climatic gradient. Biogeochemistry. 2004;67:113-134. http://dx.doi.org/10.1023/B:BIOG.0000015320.69868.33
28. Kozlowski TT. Plant responses to flooding of soil. Bioscience. 1984;34:162-167. http://dx.doi.org/10.2307/1309751
29. Moorhead KK, McAuthur J. Spatial and temporal patterns of nutrient concentrations in foliage of riparian species. Am Mid Nat. 1996;136:29-41. http://dx.doi.org/10.2307/2426629
30. Kozlowski TT. Responses of woody plants to flooding and salinity. Tree Physiol Monogr [serial on the Internet]. 1997[cited 2011 Feb 10];1. Available from: http://www.pucrs.br/fabio/fisiovegetal/Encharcamento.pdf [ Links ]
31. Junk WJ. General aspects of floodplain ecology with special reference to Amazonian floodplains: In: Junk WJ, editor. The central Amazon floodplain: Ecology of a pulsing system. New York: Springer-Verlag; 1997. p. 3-20. http://dx.doi.org/10.1007/978-3-662-03416-3_1 [ Links ]
32. Kalisz B, tachacz A. Content of nutrients, heavy metals and exchangeable cations in riverine organic soils. Pol J S Sci. 2009;42:43-52.
33. Harry OV Verman E, Mario P Frank W, Lee VD, Guda EM, et al. Importance of sediment deposition and denitrification for nutrient retention in floodplain wetlands. Appl Veg Sci. 2006;9:163-174. http://dx.doi.org/10.1111/j.1654-109X.2006.tb00665.x
34. Ross G, Haghseresht F, Cloete TE. The effect of pH and anoxic on the performance of Phoslock, a phosphorous binding clay. Harmful Algae. 2008;7:545-550. http://dx.doi.org/10.1016/j.hal.2007.12.007
35. Brady NC, Weil RR. The nature and properties of soils. Columbus, OH: Pearson; 2008. [ Links ]
 Correspondence:
Gaolathe Tsheboeng
Okavango Research Institute
Private Bag 285, Maun 00000, Botswana
Email: gtsheboeng@tati.ub.bw
Received: 31 May 2013
Revised: 25 Oct. 2013
Accepted: 30 Oct. 2013

