


Services on Demand
Article
 English (pdf)
 Article in xml format
 Article references
Indicators

Related links
-
 Cited by Google
 -
 Similars in Google
Share

 Permalink
South African Journal of Science
On-line version ISSN 1996-7489
Print version ISSN 0038-2353
S. Afr. j. sci. vol.110 n.3-4 Pretoria Feb. 2014
COMMENTARY
Taking the transformation discourse forward: A response to Cloete, Dunne and Moultrie and Dorrington
Kesh S. GovinderI; Nombuso P ZondoI; Malegapuru W. MakgobaII
ISchool of Mathematics, Statistics and Computer Science, University of KwaZulu-Natal, Durban, South Africa
IIOffice of the Vice-Chancellor, University of KwaZulu-Natal, Durban, South Africa
Keywords: transformation; universities; demographics; equity index; ranking
We respond to the recent commentaries1-3 on our articles4,5. We indicate how statements have been misread, misinterpreted or viewed in the narrowest manner possible. Any suggestion of bias or 'smoke and mirrors' in our article5 is rejected. On the contrary, we emphasise that our approach was transparent and provided a snapshot of the sector in an objective manner.
Introduction
We noted the very passionate commentaries1-3 on our articles4,5 that have recently appeared in the South African Journal of Science. It is clear that all these authors take the issue of transformation in South Africa and quality high-level knowledge production of higher education institutions very seriously and we laud their commitment to this important cause. It is a great pity though, that this passion has led to an incomplete reading of our work and/or the most narrow interpretation possible of our results and conclusions. In particular, several statements are taken out of context, while others are simply misinterpreted; still others indicate a lack of understanding of the South African context of the study (for example, Dunne's2 criticism of the term 'equity' is puzzling). In addition, we believe that statements like the applicability of the formula is 'morally dubious'2 or 'questionable mission of the paper'3 (and many others that appear throughout the commentaries of Dunne2 and Moultrie and Dorrington3) are, at best, sound bites not befitting a scholarly critique of a peer-reviewed paper. What we find especially surprising is that none of these emotive statements are followed up with clear, substantiated evidence to support the sentiments espoused.
We must emphasise an important point that has continually been misinterpreted and misrepresented - our Equity Index (EI) provides the first quantitative measure of transformation. This should not be interpreted to mean that our Equity Index is the final word on transformation. It should also not be taken to mean (rather mischievously, in our opinion) that transformation is only about numbers. As stated in our paper5:
In the South African context, transformation refers more specifically to change that addresses the imbalances of the past (apartheid) era. It has many facets, including demographic and systemic change. However, regardless of the different components and qualitative measures for transformation, the ultimate (and most important) indicator is that of demographics (racial and gender statistics).
In measuring the distance between an organisation's demographics and the national demographics, one can conclude how effective that organisation's transformation activities are. We do not pass judgement on what those transformation activities are or indeed what they should be. The EI merely indicates how effective an organisation has been (via its own transformation processes and policies) in ensuring that it reflects the relevant demographics and the constitutional imperative of transformation.
Context and data
Any scientific study must be read within its own context (i.e. within the parameters indicated at the outset). For our study, we were clear about the parameters: the study was undertaken using publicly available data and based on the Constitution, White Paper 3 of 1997 and the equity laws on transformation of higher education. It must be stated that it is unconstitutional for any organisation not to transform. The first set of data was obtained from the most recent census and sourced from official documentation released by StatsSA6. Such data may indeed be open to criticism and revision from time to time. Notwithstanding such possible future revisions, we undertook our study using the current official demographic statistics available. We have already justified5 our use of national versus regional demographics. Notwithstanding this justification, we note that the results will change significantly only for a few institutions when regional as opposed to national demographics are used, but our findings and conclusions for the sector will remain unchanged.
The second set of data was the HEMIS data provided by the Department of Higher Education and Training (DHET)7. Again, this set of data is official data that was compiled by the institutions themselves in terms of race and gender. As such, this data may indeed contain errors of numbers and of definitions and be open to debate. As an example, consider the definition of Instructional/Research Staff which lends itself to many differing interpretations. The universal gold standard of Instructional/Research Staff is the holding of a PhD. If this universal benchmark was to be applied (especially with the distortions of our colonial-apartheid legacy) one can foresee the obvious problem - many academic staff in Medicine, Law, Commerce/Accountancy, Engineering and Computer Science would be removed from consideration as those professions tend not to require PhDs. It is therefore clear that defining such benchmarks is not without controversy. Notwithstanding this challenge, the data, as they stand, are still the official data maintained by the Department and we used this data at face value.
Finally, the research output of each institution is determined by DHET8 based upon audited submissions by the different institutions. This output influences (volume as opposed to efficiency) the calculation of the research component of the block grant provided by the Department and so is crucial for each institution in the country. It is unfortunately true that this data equates all publications in ISI journals, regardless of the quality of the journal (although, even here, there is no universally accepted indicator of journal quality - even impact factors are debatable). Again, this is the official national data available and we used this, as generated, for our study.
However, we did analyse the national research output in two ways: Total Research Output (Volume) vs Equity Index and Per Capita Research Output (Efficiency) vs Equity Index. Both volume of research output and research efficiency are important factors to consider.
It would seem to be self-evident, but we feel that we have to emphasise that any study and its conclusions must be read in its proper context and with an understanding of its parameters. We believe that such an approach is in line with proper scientific discourse.9
The study by Dorrington et al.9 is illustrative of this approach. They studied projections of mortality (AIDS deaths) in South Africa, and compared four models: ASSA600, the US Bureau of the Census, the United Nations and the Metropolitan-Doyle. The projections for deaths due to AIDS differed significantly between the US Bureau of the Census and the Metropolitan-Doyle Model (by approximately 86% in fact). When they recast the balance of equations to ASSA600 (their model) base population and migration, the variation reduced to 82% and stood at 36% between ASSA600 and the US Bureau of the Census. Rather interestingly, the report describes the results of the other models using phrases like 'appear low' or 'appear high'. None of those results were said to be 'wrong' or 'flawed'. Presumably it was understood that these different models used different assumptions to arrive at these significantly different results within the same population during the same period of study. Importantly, one common finding of all the models was that AIDS deaths increased significantly. This conclusion was not disputed regardless of the fact that each model incorporated different assumptions. We would expect the same standard to be applied to our work, or indeed any other scientific study.
We do acknowledge that the issue of inclusion or exclusion of foreigners has not been settled. Initially, our study included foreigners in the different categories. However, as a result of concerns raised by a reviewer, foreign students were removed from the data. However, as the original data aggregated all the foreigners together for staff, the EIs as presented in our staff analysis5 does indeed include them. This is important as it ensures that both the divisors and numerators in the equity-weighted total research output and per capita research output are consistent. Without including foreigners into the calculations, these indices would be meaningless. Notwithstanding this, we acknowledge that there is no agreement on if and how non-South Africans should be included in this study (or indeed in any discussion incorporating demographics in South Africa). Indeed, as indicated in our paper, the inclusion of these individuals into the student data did improve EIs.
As those debates on the inclusion or exclusion of foreigners continue and are eventually settled, the benchmarks can be easily modified.
It must be pointed out that the set of data points we used was six dimensional (although there is a relationship between the coordinates as the sum of the first four components cannot exceed 100% and the sum of the final two components cannot exceed 100% either) while Moultrie and Dorrington3 prefer an eight-dimensional set (with the sum of the eight components not exceeding 100%). These are two independent sets and results obtained in one set cannot be extrapolated to the other. The advantage of our approach is that one can actually determine a race EI (using data points with only four (race) components), EIr, a gender EI (using data points with only two (gender) components), EIg, and an overall EI which is a combination of these two previous EIs via  . It was this aggregate combination possibility that led us to use n=6. Importantly, the EIr and EIg both form subspaces of the EI space using this approach. For n=8, we do not have this mathematical structure - one cannot find EIr and EIg directly in that space.
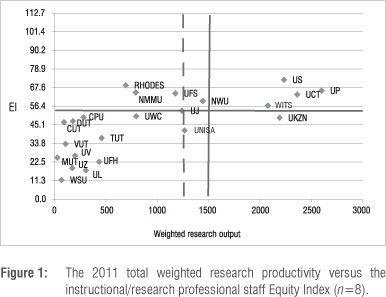
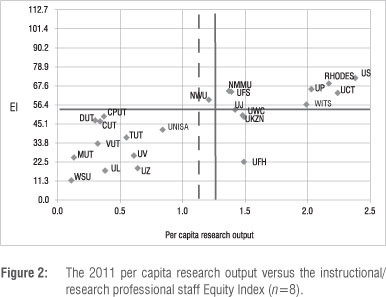
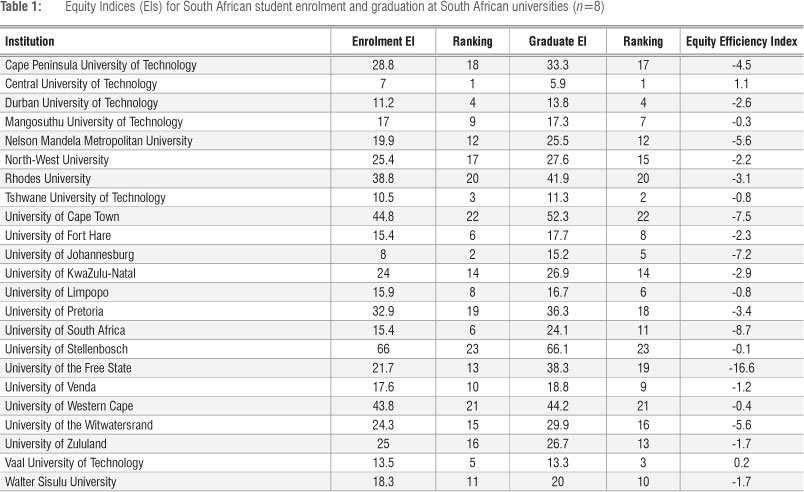
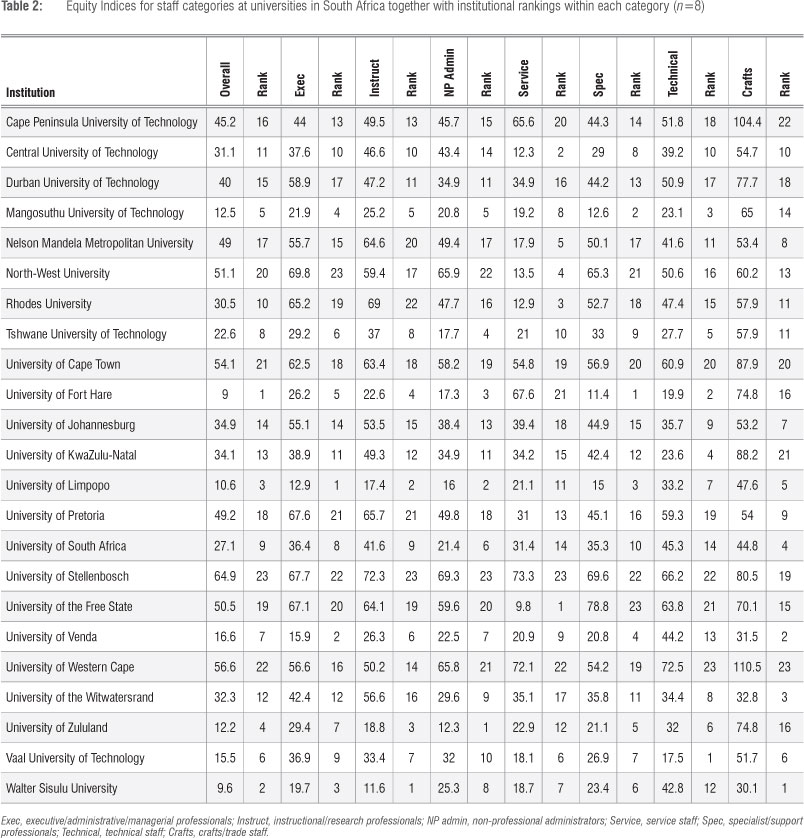
However, this does not mean that we ignored the n=8 case. In fact, all EIs were calculated using n=8 as well. Given the above characteristics of the n=6 data, we preferred to publish those results as opposed to the n=8 data. We present those results in Table 1 and Table 2 as well as Figure 1 and Figure 2. It may appear that this leads to lower EIs overall but, as indicated earlier, one cannot compare the n=6 results to the n =8 results as the reference points are different (and lie in different subspaces - six dimensional in the first case as opposed to eight in the latter case). While the ranks of some institutions may have changed marginally (but not significantly), the overall conclusions are similar to those presented in our paper5 (see later for a specific comparison with the results of Moultrie and Dorrington3). In summary, using n=6 is useful as a combination of the race and gender EIs while using n=8 is more useful for exclusively overall EIs. Neither can be said to be wrong, but each must be considered in its own context and they cannot be compared.
Distance formula
The racial and gender demographics in South Africa are reported in terms of percentages. As the percentages are reported in different categories, it is not easy to determine whether one is moving towards a particular benchmark or not. Take for example, the national racial percentages of (79.2, 8.9, 2.5, 8.9). If an organisation moves closer to these percentages in the first and second categories, but further away from the percentages in the third and fourth categories, it is not obvious whether progress has been made towards reflecting those percentages. Because we are concerned with moving closer or further away from a particular point, it would seem that the distance formula is a natural way of determining this.
In general, we are concerned with a set consisting of points with components consisting of demographic percentages. The distance between any two points in a particular set is given by a metric. In the case of Euclidean (flat) space, the metric reduces to the generalisation of the Theorem of Pythagoras in n dimensions. Then, the distance formula we use is given by

where the xi 's and the yi's are components of the two points (x1, x2..., xn) and (y1, y2..., yn). This translated naturally into the Equity Index45 given as
where orgi refers to components of the organisation's demographic data point and demdati refers to the components of the benchmark demographic data point. In our opinion, this is the simplest form of the formula. Other, more complicated forms exist, but they do not change the result of the calculation. We note that Moultrie and Dorrington3 preferred the form
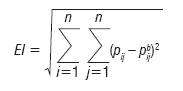
However, the problem with the above formula is that it can only be used to calculate the EI if each data point has components that are disaggregated in terms of gender and race (for a total of eight components - in fact, their definition of p¡j necessitates n=4 and m=2). In the form that we use, one can utilise eight components as used by Moultrie and Dorrington3 or six components as used by us5.
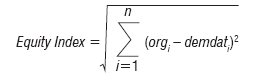
Unlike the usual distance between two points in which the components of each point are independent, we use demographic data points in which the components add up to 100% (in the case of eight demographic categories) or 200% (in the case of six demographic categories - which was the case for our study). As a result, when trying to optimise the path for an organisation's demographics to reflect the benchmark, one has to be a little careful; one has to undertake a constrained optimisation (technically, optimisation on a lower dimensional hypersurface - a paraboloid of lower dimension than the original hypersurface). Thus, there is at least one degree of freedom less than is ordinarily the case. We have used this non-independence of coordinates to good effect by determining a maximum EI. Usually, one would not think of a maximum distance from a reference point for which the components are completely unconnected. However, because of the nature of the components of the points we are utilising, we can talk of a maximum. We do this by taking a 'worst case scenario' of only Indian males comprising the demographics (this is done as Indians comprise the lowest racial percentage and males the lowest gender percentage). Calculating the distance of this point ((0,0,100,0,0,100) for n=6 or (0,0,0,0,0,100,0,0) for n=8) from the relevant benchmark gives the maximum EI. Subsequently, this maximum was divided into five equal parts called quintiles. (This terminology is perhaps unfortunate as we are not referring to partitioning into quantiles as a statistician may assume, but simply the division of a particular interval into five equal parts.) This afforded an organisation the benefit of monitoring its demographic progress towards the benchmark in terms of progression to new quintiles. Perhaps paradoxically, we spoke of a sixth quintile, the zeroth quintile, to indicate a region of tolerance. We admit that this use is rather quaint, but thought that it did speak directly to what we were illustrating.
We have applied the distance formula as it was originally described in a straightforward, transparent manner. There are few formulae that are indeed so simple to use. We cannot understand how and why this constitutes 'fumbling mathematical conjuring'2.
Direct responses
In what follows, we refer to the Commentary of Cloete1 as NC, that of Dunne2 as TD and that of Moultrie and Dorrington3 as MD. Quotes from these commentaries are indented while quotes from our paper are included as part of the narrative within quotation marks.
Unlike, and in complete contradiction to the Commentaries of Dunne and Moultrie and Dorrington, Cloete's Commentary sees value in the Equity Index study. He starts off by reflecting on a draft of our paper that he had seen:
NC: I noted when I read the draft of Govinder et al.'s paper on equity indices that it equated equity with transformation, and delinked equity from development and performance. This draft version of the paper fell into the trap of a prevailing South African condition: using transformation as a code word for race. Furthermore, the formula used in the paper produced a result in which several of the most equitable institutions were those being run by a government-appointed administrator. By this, the authors implied their promotion of high equity, yet also regarded the existence of dysfunctional institutions as a given in their proposed model for the South African university system.
Thereafter, he goes on to indicate how our published paper addressed these two crucial issues:
NC: The paper on equity indices, published in the South African Journal of Science, certainly responds to both these criticisms. Firstly, equity is used mostly in reference to the formula as described in the paper, although the focus of equity is racial, being mainly African. Secondly, a serious attempt is made to reconcile the well-known Harold Wolpe tension between equity and development, as described by Cloete et al. While I will argue that the attempt is not entirely successful, the approach of developing empirical indicators to reflect the equity-development duality of transformation is to be lauded as it is a step towards developing South African indicator-based performance clustering systems. My time spent at the Shanghai Jiao Tong University's Centre for World Class Universities during early November 2013 has made it even clearer to me that, while for the foreseeable future the Jiao Tong type of methodology will continue to make a considerable contribution to debate and controversy, it will not assist much in strengthening universities in Africa.
Govinder et al. are correct when they assert that equity-weighted research output goes beyond the Centre for Higher Education Transformation (CHET) clusters, which were based mainly on performance and efficiency in knowledge production. The more recent CHET clustering 3 in 2010 has been expanded to include factors such as staff qualifications, undergraduate-to-masters graduation rates and high-level knowledge production (doctorates and research publications). This latest CHET clustering has shown that, in addition to those usually in the top group of higher education institutions (such as UCT, Stellenbosch University and Wits University), some 'on-the-move' institutions, such as UKZN, North-West University and the University of the Western Cape, have moved into the top group.
Govinder et al. are also correct in pointing out that some of their results do not square up with the CHET differentiated clusters. For example, their high rating for Unisa - in terms of both the graduation Equity Index and the weighted research output - is completely contradictory to the performance of Unisa in the South African system as shown by CHET. Similarly, their low ranking for Rhodes University is contradictory to the CHET finding that Rhodes is one of the three most efficient knowledge producers in terms of weighted publication per staff member. It appears that by not using staff: research ratios, the Equity Index formula has skewed results in favour of larger institutions.
We have quoted Cloete1 in full so as not to distort, misrepresent or take out of context any statements in his Commentary. Firstly, Cloete is generally correct in his interpretation of our work in this part of his Commentary. Cloete then devoted most of his Commentary on his experiences in the National Commission on Higher Education, the nature of debates therein and the many uncomfortable issues they confronted but never resolved nor settled. They are important and give an interesting context to our study.
He then makes the following three major criticisms of our article: That our study
NC: implied their promotion of high equity, yet also regarded the existence of dysfunctional institutions as a given in their proposed model for the South African university system.
In fact, to the contrary, as stated in our article5: "The South African dilemma is that some of the institutions with good equity are poor knowledge producers, and vice versa. In this study, a group of 8-11 universities (Figure 3) with very good EIs but with very low total weighted research productivity outputs is discernible (a similar number have good EIs but low per capita research output). Even with their good EIs, there is no improvement in their equity-related ranking in high-level knowledge production. This finding suggests that the quality of equity transformation is essential in knowledge-producing organisations such as universities. This group constitutes an example of how equity transformation without quality leads to unintended negative consequences. As the status quo, this group adds no value to national development, which the Council on Higher Education aptly put as follows:
High quality higher education is crucial for social equity, economic and social development and a vibrant democracy and civil society. If higher education does not produce knowledgeable, competent and skilled graduates, generating research and knowledge, and undertaking responsive community service, then equity, development and democracy will all be constrained."
and
"The study has shown the general applicability of the formula and emphasised the essential role of high-level knowledge production in the quality of equity during the transformation process."
Further,
NC: In terms of the nature of higher education, there appears to be a fundamental flaw in the Equity Index assumption that the university should be a mirror of national demographics. The university is a specific institution in society that is supposed to lead rather than reflect society. A forthcoming book by Castells and Himanen, in discussing Amartya Sen's Development as Freedom (1999) and John Rawls' A Theory of Justice (1971), highlights the argument that, while all citizens are equal before the law and are all entitled to dignity, this is not the case in terms of capability, particularly if capability is understood as performance rather than potential.
A gifted child in a family performs better than his/her siblings but is nevertheless a mirror and reflective of that family. Indeed universities reflect a different type of people in a society. However, universities exist within particular societies, with laws, values and cultures leading and serving those societies. This close interlinkage was recognised early -in 1155 Emperor Frederick Barbarossa said the twin role of a university was to produce rational knowledge that would 'illuminate the world and maintain social order',10 i.e. to serve the intellect and society. The production of rational knowledge often arises out of problems within society. Universities could not do this without being mirrors and without mirroring society. There are no universities existing out of societies or for themselves in society. Take the UK, the Indian or the Chinese university systems. Each one of these societies is reflected in their university systems in terms of students and staff profile capabilities. The overwhelming majority of staff and students in the UK, Indian and Chinese university systems are UK, Indian and Chinese nationals. Furthermore, the following examples illustrate the point of capable citizens and their societies even better11:
1. Louis Pasteur's - a French citizen - fascination with microorganisms, for example, led him down the applied path towards understanding the pathology of disease, the creation of alcohol and commercially viable high-quality vinegar. Pasteur developed his science by accepting problems presented by a Lille industrialist, the Ministry of Agriculture and Napoleon III.
2. Lord Kelvin's - a British citizen - physics was inspired by a deeply industrial view and the needs of the British Empire.
3. Keynes' - a British citizen - magna opera A Treatise on Money and The General Theory of Employment, Interest and Money were inspired and written in the context of massive unemployment and the grinding misery of economic depression during the 1930s.
So, the notion that because universities play a particular role in society (leading society) and are inhabited by scholars and students of particular capabilities is not incompatible with reality and the understanding that these institutions and their special inhabitants are representative, reflective and reflected of these societies. This capability representativity occurs even today despite the idea of internationalisation. Internationalisation occurs within the constraints of nations, their constitutions, their laws and values. International students are often required to return home to serve their nations or societies. For example our own Constitution, equity laws and White Paper 3 of 1997 (which anchors our Equity Index study) enjoin our universities to play a leading role in transformation but also to function in particular ways to create a representative, equitable and high-quality 'single coordinated national higher education system' that is transforming and reflective of the diversity of the South African nation. The South African taxpayer funds and invests in the system to build South Africa and not a nation 'in Esperanto', without an identity. The National Commission on Higher Education was there to develop and lay the foundations of a first rate transformed South African higher education system of quality within the constraints of the nation's Constitution.
Finally,
NC: Another assumption underpinning the arguments of the authors is that the slow progress is as a result of a lack of institutional compliance. Not once is the question raised as to the role of the national Department of Higher Education and Training and its contribution to the problem.
While we did not use the term 'national Department of Higher Education and Training' we did use the word 'government' instead. Specifically: "Given the vast (government) investment in higher education since 1994 (over R236 billion up to and including 2013), the equity returns need to be interrogated. This study shows that it is difficult to transform 'privilege' voluntarily and suggests that extraordinary measures are needed. ...The question remains as to the reasons behind this slow progress: Is it passive resistance or a denial of failure by the sector? Is it the abuse of autonomy or an abhorrence of accountability by the sector? Has government failed to provide clear unambiguous steering or monitoring mechanisms or has it been cowed by the voice of the 'privileged' at the expense of the voice of the disadvantaged majority, shying away from doing that which is commonsense in a democracy?"
and
"It may become necessary for government to set knowledge production targets or set this group on a different mission/trajectory to contribute to national development". The word 'government' appears seven times in our study!
Cloete1 then concludes as follows:
NC: The task is thus to build a new post-secondary differentiated higher education system with built-in quality checks. This system should include a mix of research-led universities, universities that are mainly undergraduate teaching institutions, a further education and training college sector that is mainly post-matric and vocationally orientated, and a private sector that is market driven.
Our comment was "Regardless of whether one focuses on the CHET clusters or our groupings, it is clear that, for transformation to advance and succeed, government has to address differentiation urgently: firstly, in the staff and student composition of institutions and, secondly, in their performance with respect to research productivity".
and
"In terms of differentiation, not all universities have to be high-level knowledge producers, but if they are to contribute to development they at least have to provide a quality undergraduate education and improve their very poor throughput rates. It does not help that they take in the 'disadvantaged' and then do not add value to their skills and certification. It may become necessary for government to set knowledge production targets or set this group on a different mission/trajectory to contribute to national development. On the other hand, the high-level knowledge producers with poor EIs need to be set equity targets, which could be rather complex but customised".
We now focus on some specific comments of the other two commentaries. We do not address every single comment as that would mean repeating almost our entire article verbatim.
MD: Despite the authors' assertion that either method of calculating the index 'is relevant', their approach double counts and is not mathematically correct. Correcting for this error has the effect of reducing all the EIs by approximately 30%. If the primary concern is simply the ranking of the universities (as opposed to drawing any other conclusions) the correction does not change those rankings, but it does impact, inter alia, the maximum determined values of the EI; the relationship between research output per capita and EI; and the demarcation of the quadrants, and hence the conclusions drawn from partitioning the plot area into quadrants.
We were completely transparent about the fact that we used n=6 in our study and have already indicated above the usefulness of each calculation. Interestingly, by using n=8 and modifying the data as they believe is necessary for a 'correct' analysis, Moultrie and Dorrington3 obtain results completely in accordance with our results. If we look at their Figure 23 and interchange axes, we obtain our Figure 45. The actual values are different, but the relative positions of all the data points are unchanged. Indeed, as stated in our work, the positions of UKZN and UWC on the figures are tenuous (as evidenced by the statements "UKZN has a good EI and high productivity (although it should still address its EI)" and "UWC and UKZN (both of which just enter this quadrant)") -they are subject to change with slight perturbations of the data. This was borne out by the changes to the data incorporated by Moultrie and Dorrington3.
MD: They treat the EIs as additive (they are not) and thus produce what they term an 'equity efficiency index' to measure change by differencing the indices of enrolled students and graduates; or, even more absurdly, they sum the EIs for the various categories of employees (presented in Figure 2 of their paper) to compare universities.
Firstly, as the EIs are calculated using the distance formula, mathematically they can indeed be added together or subtracted from each other (as can distances in general). It is the interpretation of this addition that is important. In subtracting the EIs of enrolled students and graduates, we have a sense of whether an institution's equity profile has moved away from or towards the national demographics. (We acknowledge that this gives a snapshot of the situation for 2011. More data points will allow a proper comparison of the results for a particular cohort.) Further, it must be noted that Figure 2 is a graphical representation of the data in Table 5. A simple additive test will indicate that the different EIs in Table 5 are not added together. In Figure 2, the EIs are presented together for illustrative comparison purposes of each category and nothing else (although we acknowledge that the greyscale figure makes this less illustrative than we would like).
MD: The absurdity is compounded by the small numbers of staff in several categories - a problem of which they are aware, but appear to ignore in this instance. For example, they calculate an EI for the 'crafts and trades' group across the 23 HEIs, despite there being fewer than 20 such staff at 13 of the 23 institutions.
We have already mentioned in the paper: "(We note that the actual number of staff in the category 'crafts/trade' is quite small. We have previously cautioned against using an EI for small numbers as the EI can change dramatically with a small change in individual staff employed.)" The main reason for including this data (and ranking) is for completeness and transparency. We wanted to include all HEMIS categories as provided by DHET In addition, this category is the one in which UKZN performs the worst. In order to show that the report is unbiased we felt the need to include this information. Unfortunately, this aim was not achieved as there are various suggestions that we presented the report in order to show UKZN in the best possible light and thus the mission of the paper was 'questionable' and 'morally dubious'.
This latter implied bias on our part is also apparent in:
TD: Indeed, one of the hypotheses offered by the authors is that several universities (other than their own university - the University of KwaZulu-Natal, UKZN) are currently impervious to equity objectives.
Contrast this with "every institution analysed has a challenge with respect to some EI." Further, the n=8 results presented in Table 1 and Table 2 as well as in Figure 1 and Figure 2 show either unchanged or improved results for UKZN.
MD: Apart from the fact that they do not standardise for the size of the institution...
On the contrary: "In order to address the issue of institutional 'size', one could also look at research in terms of per capita output. We present this perspective in Figure 4. The quadrant boundaries have been determined in the same manner as for Figure 3. Here we note, very pleasingly, that no university falls firmly into the top left quadrant (which indicates poor EIs and low per capita research output) as all of these universities have moved across into the top right quadrant (with still poor EIs, but now with high per capita research output) and join the universities occupying this quadrant from Figure 3."
TD: What appears to be unstated is that the entire set of 10 analyses reported are based upon four race categories alone, although there is bracketed comment: (ignoring gender imbalances). The consequence of this offhand remark is that the entire analysis appears to take n = 4 rather than the claimed constitutional imperatives of race and gender, with n = 8.
This is an illuminating example of statements being taken out of context. The full statements regarding neglecting gender imbalances read as follows "Interestingly, if a university employs only black African female staff, for example, the EI is calculated to be a very poor 73.4. In the case of only black African staff (ignoring gender imbalances) this figure improves to 26.4, which is still far outside the acceptable tolerance levels."
Three paragraphs later we indicate: "In this study, we used national demographic data as indicated in Table 2. Thus the EI was calculated with respect to six categories (incorporating the four race groups and both genders." It is a pity that, when Dunne contacted us about our unpublished work (as he indicates in his Commentary), he did not see fit to clarify this matter. It would have saved him considerable unnecessary calculations. Fortunately Moultrie and Dorrington3 were able to discern that we used n=6 in our study.
Concluding comments
In spite of the language used in some of the commentaries, the formula itself was not shown to be flawed. On the contrary, we were heartened to see that Moultrie and Dorrington3 were able to use the formula effectively for their data.
We agree with all the commentators that the matter of transformation is a serious one that requires due consideration. In doing so, we urge readers to engage critically and objectively with our study. The basic parameters utilised must be understood and taken together with the conclusions reached, as with any scientific study.
Having made a case for a proper, detailed, reading of our original work, we must emphasise that we understand that our study (and the data it uses) can be nuanced. In particular, Moultrie and Dorrington3 make some interesting points about how the data could be structured in order to reach more meaningful conclusions (although we commented earlier on some of the challenges with their suggestions). Indeed, in the presentations that we gave to various stakeholders and in some of the reviewers' comments, many of the issues they raise were also raised. It is clear that these issues are not settled and need further engagement until the full parameters under which the Equity Index can be employed are clear. Once those parameters are settled, the Equity Index can be utilised (together with other qualitative indicators) to provide a good picture of the success of transformation in South Africa.
We must comment, however, that the snapshot of the (lack of) success of transformation as evidenced by the EI was so stark that further nuances could not change the results significantly.
Given the snapshot of transformation that we have provided (or the modified version given by Moultrie and Dorrington3), it is clear that our government and universities' current transformation efforts are not going far enough or simply not being effective enough. Notwithstanding the many apparent criticisms levelled at our work, no one has been able to refute its fundamental (and rather obvious) conclusion: transformation is still a major challenge for the higher education sector in South Africa - it is 'painfully slow' and every institution has a challenge in this regard. This was clear from Soudien et al.'s12 qualitative study in 2008. The EI results complement that work through the first quantitative indicator to aid transformation (and are in accordance with Soudien et al.'s12 results). As we stated in our study '"Just as is the case with the CHET clusters, the system should engage with and decide upon important constituents (indicators) of the different indices". Indeed, this is in line with the recommendation3 that "the focus of any metric of this sort should be on the progress of each institution within its circumstances". Our Equity Index can then be used, together with agreed benchmarks, to provide one quantitative means of monitoring the success of transformation.
Our purpose5 was to show that the Equity Index previously introduced4 could be used to quantitatively measure the success of transformation activities in an environment where no quantitative measure previously existed. We believe that we were successful in indicating that the Equity Index could be used in that way. In order to move this important matter forward, we do believe it would be best for the benchmarks and data to be further interrogated (by all concerned parties) so that the Equity Index could be used for the purpose it was intended - to help transformation in South Africa. We hope that the next publication on this subject is a peer-reviewed article using the Equity Index with agreed upon benchmarks and data which can guide the sector better.
Acknowledgement
We thank Prof. L. Nongxa (University of Witwatersrand) for his many useful comments that helped improve this Commentary.
References
1. Cloete N. A new look at demographic transformation: Comments on Govinder et al. (2013). S Afr J Sci. 2014;110(1/2), Art. #a0048, 4 pages. http://dx.doi.org/10.1590/sajs.2014/a0048 [ Links ]
2. Dunne T. Mathematical errors, smoke and mirrors in pursuit of an illusion: Comments on Govinder et al. (2013). S Afr J Sci. 2014;110(1/2), Art. #a0047, 6 pages. http://dx.doi.org/10.1590/sajs.2014/a0047 [ Links ]
3. Moultrie TA, Dorrington RE. Flaws in the approach and application of the Equity Index: Comments on Govinder et al. (2013). S Afr J Sci. 2014;110(1/2), Art. #a0049, 5 pages. http://dx.doi.org/10.1590/sajs.2014/a0049 [ Links ]
4. Govinder KS, Makgoba MW. An Equity Index for South Africa. S Afr J Sci. 2013;109(5/6), Art. #a0020, 2 pages. http://dx.doi.org/10.1590/sajs.2013/a0020 [ Links ]
5. Govinder KS, Zondo NP, Makgoba MW. A new look at demographic transformation for universities in South Africa. S Afr J Sci. 2013;109(11/12), Art. #2013-0163, 11 pages. http://dx.doi.org/10.1590/sajs.2013/20130163 [ Links ]
6. Statistics South Africa. The 2011 census data [document on the Internet]. c2012 [cited 2013 May 28]. Available from: https://www.statssa.gov.za/Publications/P03014/P030142011.pdf [ Links ]
7. Department of Higher Education and Training. HEMIS database [accessed 2013 May 28]. [ Links ]
8. Department of Higher Education and Training. 2011 Weighted research output. Pretoria: Department of Higher Education and Training; 2012. [ Links ]
9. Dorrington R, Bourne D, Bradshaw D, Laubscher R, Timaeus IM. The impact of HIV/AIDS on adult mortality in South Africa. A technical report. Cape Town: Medical Research Council; 2001. Available from: www.mrc.ac.za/bod [ Links ]
10. Ruegg W. The traditions of the university in the face of the demands of the twenty-first century. Minerva. 1992;30(2):189-205. [ Links ]
11. Stokes DE. Stating the problem. In: Pasteur's Quadrant: Basic Science and Technological Innovation. Washington DC: Publisher Brookings Institution Press; 1997. p. 1-25. [ Links ]
12. Soudien C, Michaels W, Mthembi-Mahanyele S, Nkomo M, Nyanda G, Nyoka N, et al. Report of the Ministerial Committee on Transformation and Social Cohesion and the Elimination of Discrimination in Public Higher Education Institutions. Pretoria: Department of Education; 2008. [ Links ]
 Correspondence:
Kesh Govinder
School of Mathematics, Statistics and Computer Science, University of KwaZulu-Natal
Private Bag X54001, Durban 4000, South Africa
Email: Govinder@ukzn.ac.za

