


Services on Demand
Article
 English (pdf)
 Article in xml format
 Article references
Indicators

Related links
-
 Cited by Google
 -
 Similars in Google
Share

 Permalink
South African Journal of Science
On-line version ISSN 1996-7489
Print version ISSN 0038-2353
S. Afr. j. sci. vol.110 n.1-2 Pretoria Jan. 2014
RESEARCH ARTICLE
Dynamics of arable land requirements for food in South Africa: From 1961 to 2007
Yibo LuanI; Xuefeng CuiI; Marion FerratI; Reshmita NathII
IState Key Laboratory of Earth Surface Processes and Resource Ecology, College of Global Change and Earth System Science, Beijing Normal University, Beijing, China
IICenter for Monsoon System Research, Institute of Atmospheric Physics, Chinese Academy of Science, Beijing, China
ABSTRACT
Food consumption puts pressure on natural resources and arable land. In the present study, we examined the dynamics of land requirements for food in South Africa from 1961 to 2007 and investigated the relationships between dietary patterns, yield, cropping intensity, population and the area of required land using the thought experiment method. Strong population growth and the development of agricultural technology (indicated by yield) accounted for more than a 2.5-fold increase in the total land requirements for food from 1961 to 2007. Before the 1990s, the increase in crop yields enabled constant land requirements, whereas, after the 1990s, the combined effect of agricultural technology and population growth, together with a small contribution from dietary changes, led to an increase in the land requirements for food. Our findings confirm that the variation in land requirements for food is a complex, non-linear function of agricultural production techniques, population growth and dietary patterns and show that the complex relationship between dietary pattern changes, and economic development challenges future predictions of land requirements for food in South Africa.
Keywords: dietary pattern; historical analysis; land requirements for food; South Africa; apartheid
Introduction
Despite being the wealthiest country on the African continent, as evidenced by its striking growth in gross domestic production (GDP) from 1961 to 2007 (Figure 1), the Republic of South Africa ranks as one of the most socially unbalanced developing countries, with a Gini coefficient1 of 63.1 in 2009 (Figure 1a). Food self-sufficiency (defined as total production divided by total consumption) in South Africa decreased significantly from above 2 in 1961 to approximately 1 in 2007, indicating that the future of food security in South Africa in terms of self-sufficiency is not optimistic.2 The evaluation of the food security situation in South Africa has been the subject of considerable attention in the scientific community, with a particular focus on exogenous factors affecting food systems. For example, studies have shown how climate change (mainly in terms of precipitation and temperature variations) affects agriculture,3,4 particularly crop yields, which are an indicator of productivity.5,6 Other investigations have been conducted from the perspective of government policy and society7,8; possible solutions to mitigate food insecurity in some regions have been suggested but few studies have focused on consumption issues.9,10
The extent of suitable land for agriculture is limited by several internal and external factors, including physical conditions and competition with other types of land use. Climate variability also plays a major role in the decrease in agriculturally suitable land area.11 Given the restrictions on land resources, determining the amount of land required for food production is essential. Productivity is determined by techniques focusing on factors such as yield and cropping intensity. Population size and consumption per capita also indirectly influence land requirements via the total food consumption of a country. It is therefore necessary to investigate the relationship between land requirements and all of these factors to determine the area of land required for food. Apart from the effects of environmental changes and natural hazards on crop yield and land resources, it is crucial to explore the possible pressure exerted on land resources by food consumption and population growth to provide a comprehensive evaluation of future trends in food security in South Africa.
Studies on the land requirements for food (LRF) have been conducted in other regions (e.g. the Netherlands),10,12-14 and have revealed that wherever economic growth occurs, people turn to more nutrient-rich food, which requires more arable land.12,13 However, the development pattern of LRF varies from region to region, and its drivers play different roles. A study focused on South Africa is necessary to help understand the food security situation and frame future government policy in this nation.
We aimed to analyse LRF in South Africa by investigating the individual effects of population, technology and dietary pattern on the development of LRF. We back-calculated the arable land requirements of each food item consumed per capita, conversion factors, yield and cropping intensity. In this process, we focused only on arable land requirements to meet the physical health demand without considering other uses such as export, seed, feed and fuel use.14 We hope that this work will inspire other studies on the projection of future agricultural land use in South Africa by analysing the historical development of LRF in South Africa.
Methods
Study area
The Republic of South Africa is located at the southern tip of Africa. It is the 25th largest country in the world by area and the 24th most populous country with a population of approximately 50 million. South Africa is ranked as an upper-middle income economy and is the largest economy in Africa. However, approximately one-quarter of the population is unemployed and lives on less than USD1.25 a day, making South Africa one of the top 10 countries in the world with income inequality.15 The Gini index is a measure of the inequality of a distribution.1,16 South Africa's Gini index has been over 40 (the internationally recognised warning line) throughout most of the past 50 years (Figure 1a), which indicates the instability of South Africa's economy at the household level, as confirmed by other surveys.17,18
Population growth has been very rapid in South Africa, with a 2.7-fold increase from 1961 to 2007 (Table 1), including the influx of approximately 5 million illegal immigrants (pooled estimated number).19-21 The agricultural industry has contributed approximately 10% to formal employment over the past 10 years22 and contributes approximately 2% currently to the GDP of the nation23. The shares of trade in the GDP have increased markedly since the opening of the economy in 1994.24
Only 13.5% of the land in South Africa can be used for crop production, and only 3% is considered high-potential land because of the restriction on limited natural resources.25 Over the past 50 years, cultivated land has increased by only one-third, resulting in a reduction of half of the arable land per capita in 2007 compared with that in 1961.26 Although productivity is improving (as demonstrated by the yield of cereals), South Africa's self-sufficiency in cereals has dropped from approximately 2.5 to below 1 (Figure 1b).
Data sources and methods
The data used in this work are from the FAOSTAT data set and include information regarding food supply, food consumption, yield, import and production from 1961 to 2007.26 A detailed description of the data source and the calculation methodology is presented below.
Linking food consumption to LRF
Our approach was based on the methodology described by Kastner and Nonhebel 27 who calculated the historical arable land requirements for food of the Philippines from 1910 to 2003. We used food supply data as an indication of food consumption and obtained land requirements for that consumption. The calculation of LRF is separated into two parts: the vegetal part (LRFvegetal) and the animal-based part (LRFanimal).
Calculating the vegetal part
The vegetal LRF was computed as follows:

where i stands for a crop item, conversionFactorj is the index for each food item converted to its primary crop equivalent, and yieldi is the crop yield for each crop. Croppinglntensity was obtained from the ratio of the total harvested area to the total area of arable land and permanent cropland. Consumption j is defined as the total consumption of each food item by the entire population in 1 year.
The details of each data set and the steps of the calculation are as follows:
(1) Consumption to primary crop equivalents
Food consumption, reflecting average dietary patterns, is translated to primary crop equivalents by the respective conversion factors for each food item. The food consumption data supplied by the food balance sheets of FAOSTAT26 'are constructed for primary crops, livestock, and fish commodities up to the first stage of processing in the case of crops and to the second (and sometimes the third) stage of processing in the case of livestock and fish products'28. Because this study was limited to arable land, we calculated food consumption only for 18 categories covering 80 types of food items, excluding aquatic food items. Referring to the study conducted by Kastner and Nonhebel27, the original 18 categories were aggregated into six broad groups: (1) cereals, (2) fruits and vegetables, (3) sugar and sugar crops, (4) vegetable oil and oil crops, (5) other vegetal food items and (6) animal products.
Generally, there are two methods used to calculate crop equivalents. One method is based on caloric equivalents and the other on the extraction rate. The conversion factors we used in this paper were based on caloric equivalents and were derived from the data supplied by Kastner and Nonhebel27. The value for food items used in this paper refers to supply at the household level.28 The processing of food products creates losses and rest streams. For instance, using the extraction rate of cane sugar in South Africa (11%29), 9.1 tons of sugarcane are needed to obtain 1 ton of cane sugar. However, the losses and rest stream created in this process usually have other functions, such as animal feed. Thus, in calculating this figure, duplicate calculation occurs and the calculated primary crop equivalents are not reasonable. A conversion factor based on caloric equivalents was therefore used in the present study. For example, to produce 100 g of sugar containing 373 kcal, 1243.3 g of sugarcane per 100 g containing 30 kcal is needed. This method avoids duplicate calculations and excludes waste.
(2) Primary crop equivalents to total LRF and LRF per capita
The total harvested area is the sum of the harvested areas of each food item. The area that can maintain one person's average food demand was thus calculated by dividing the harvested area by the cropping intensity and population.
The following formula for calculating cropping intensity was derived from Siebert et al.30:

where CI is the cropping intensity, AH is the area harvested and CE is the extent of cropland that is left temporarily fallow.
Calculating animal-based foods
The situation is more complex in calculating livestock products. In this work, we simplify the computation of LRFanimal as follows:

where Consumptionanimal(kcal) is the total animal-based food items consumed in a year, Consumptionvegetal(kcal) is the total vegetal food items consumed in a year, and LRFvegetal is the total land requirement for vegetal food items as calculated above.
Based on a number of studies associated with LRF for animal products,10,14,30,31 we assumed that one calorie of food of animal origin requires three times the amount of arable land needed for an average calorie of food of plant origin. This assumption is relatively low for beef, which represents the main production livestock system in South Africa. However, crude assumption is sufficient for our purpose, which focuses on the trend of total LRF and the individual effects of different factors rather than exact numbers. Given this aim, the method of calculating land requirements for animal products is therefore less important. Unifying the methods used to calculate the land requirements for vegetal products and animal products will be helpful in performing further analyses.
Assumptions and conditions
The methodology outlined above is suitable for the purpose of our study but requires that several assumptions be made and conditions satisfied:
1. Food consumption excludes aquatic food that is not directly related to land resources.
2. With a large proportion of pasture and meadows, the livestock industry, as the backbone of South African agriculture,31 is not intensively managed.
3. Although the systems of crop plantation and animal husbandry are different, we unify crop products and animal products into the same land-use types.
Individual effects of LRF factors
To study the individual effects of population, average dietary pattern, yield and cropping intensity on total LRF, we used the thought experiment method.27,32,33 In this experiment, total LRF is a function of population, diet and technology. To visualise the impacts of these three drivers on LRF, we initially assumed constant population, diet and cropping intensity at the 1961 levels to qualify the impact of changes in yield only. The effect of cropping intensity was subsequently added. Then, the LRF induced by actual population development was taken into account, still assuming a constant 1961 diet. Finally, the impact of changes in the average diet was incorporated into the calculation to arrive at the total national LRF in South Africa throughout the entire period analysed. Through this method, the individual contribution of each driver can be assessed.
Results
Change in dietary pattern from 1961 to 2007
The food consumption per capita in South Africa from 1961 to 2007 for the listed categories is shown in Figure 2. Cereals, being the main dietary source, accounted for 58% or more of the total food consumption throughout the study period. Among all six categories, the most noticeable changes occurred in sugar and sugar crops and vegetable oils and oil crops. Whereas the proportion of sugar and sugar crops gradually decreased from over 14% in 1961 to below 10% in 2007, that of vegetable oils increased over the same period from 5.7% in 1961 to 12.3% in 2007. However, from 1961 to 2002, the share of animal products decreased from approximately 15% to 11.7% and then increased to 13.5% in 2007.
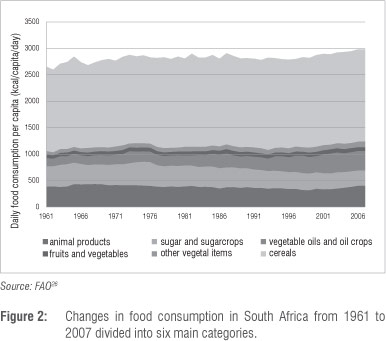
The total daily food consumption showed a slightly increasing trend from approximately 2670 kcal per capita per day to approximately 3000 kcal/cap per day. The increased consumption of vegetable oils and oil crops contributed most to this development with approximately 216 kcal/cap per day from this source. Cereals, as the second largest contributor with 148 kcal/cap per day, remained almost constant throughout. The only negative variation observed was the decrease in the share of sugar and sugar crops of approximately 92 kcal/cap per day over the 46-year period.
Overall, the dietary pattern in South Africa did not exhibit a significant change over the study period. The total consumption increased by only 12.3%, but that of food categories representing more nutrient-rich food items decreased. When standards of living are low, an increase in income favours the consumption of foods of animal origin and reduces the consumption of cereals and roots.34 In terms of the absolute consumption per capita, the living standards in South Africa are not lagging far behind the world average.26 However, the dietary pattern has not converted to the consumption of more nutrient-rich food items, as indicated by the decreasing trends observed for animal products and sugar and sugar crops.13,35,36 We interpret the underlying driving factors to be income inequality37 and unstable social development in South Africa (Figure 1b). The fourth migration wave, that is, the rural-urban migration (from the mid-1970s to the late 1980s) of Black populations, provided people with opportunities to live a more affluent lifestyle. The changes in population composition, as a result of more illegal immigrants and fewer White individuals, and the net emigration rate influenced dietary patterns at the country level.24 The rapid growth in the GDP per capita and the higher levels of per capita food consumption overshadow the fact that large fractions of the population in South Africa are still living below the poverty line.17,37 Poverty, lack of education, social instability and the long commuting distances of employed city dwellers have led many in South Africa to acquire an unhealthy dietary pattern.38 Thus, the change in diet is the result of a synergy of changes in South Africa's low and high standards of living.39,40 Moreover, although the dietary pattern did not change significantly over time, yield and population growth have significantly impacted the total LRF in South Africa.
Total LRF in South Africa from 1961 to 2007
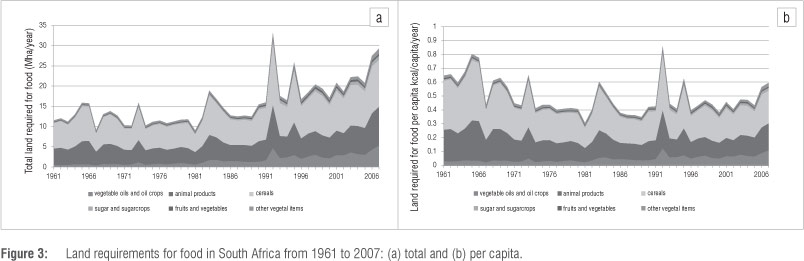
The evolution of the total LRF in South Africa from 1961 to 2007 is shown in Figure 3a. The total LRF increased from 11.5 million ha to 29.2 million ha; cereals comprised the largest share, followed by animal products. Cereals, particularly maize, accounted for approximately half of the total LRF in 1961, a proportion that gradually decreased to below 40% in 2007 as a result of the increase in yields. For animal products, although the LRF increased significantly after 1990, the proportion remained almost constant over the 46-year period. However, LRF for vegetable oils and oil crops grew the most, almost 10-fold, accounting for 4.6% in 1961 and growing to 18.3% in 2007.
Another notable feature is that the change in LRF in South Africa appears to be highly unstable, with extreme peak values (Figure 3a). South Africa is unusually vulnerable to climate variability, and thus to a reduction in surface waters.6 Maize, as the country's most important crop, accounts for 36% of South Africa's total field crop production. A serious decline in the productivity of maize and some other crops occurred because of a regional drought, resulting in a significant increase in the required land area, shown as peaks in Figure 3a. For example, as a consequence of the drought in 1992, maize yield declined from 2257.3 kg/ha to 785.3 kg/ha, causing this single crop's LRF to increase 5.4-fold (without considering changes in cropping intensity).
The changes in LRF per capita (Figure 3b) seem to follow a trend different from that of the total LRF itself. At the outset, LRF per capita first decreased from 0.65 ha/person per year in 1961 to 0.34 ha/person per year in 1989 because of increasing crop yields. The subsequent increase in LRF, which reached 0.59 ha/person per year in 2007, was the result of a reduction in cropping intensity and changes in dietary structure.
Looking at the contribution of different food items, the yield increase benefitting from the Green Revolution41 contributed to a distinct decrease in LRF per capita for cereals from nearly 0.35 ha/person per year to approximately 0.2 ha/person per year, whereas for vegetable oils and oil crops, the LRF per capita increased from 0.03 ha/person per year to 1.11 ha/person per year over the study period - an increase which can- be attributed to the combined impact of increasing consumption and increasing yield. For sugar and sugar crops, decreasing yield combined with declining cropping intensity led to an increase in land requirements.
LRF cannot reflect the actual amount of land required; nonetheless, the upward trend of LRF indicates a probable future increase in the amount of land needed to feed people, especially considering the growth in the population (Table 1).
Individual effects of population, diet and yield on LRF
The combined effects of population development, dietary change, cropping intensity and productivity on LRF were discussed above. The available data are sufficient to assess the individual effects of these drivers.
Based on the thought experiment method,33 it is possible to quantify the effect of individual drivers on total LRF by keeping certain input factors constant (Figure 4). With solo-crop yield improvements, LRF decreased from over 11 million ha in 1961 to 6.6 million ha in 1980. However, LRF became relatively stable after 1980, mainly because of the decline in cropping intensity. The extremely high values of LRF coincided with extremely low yields, indicating the influence of the latter. Considering population growth, LRF showed a decreasing trend from 1961 to 1980 but at a much flatter rate than before. This behaviour clearly indicates that the increase induced by constant population growth was counteracted by the increase in yield. After 1980, LRF greatly increased from 10.9 million ha/year to 23.9 million ha/year, implying a greater impact of population growth over this period.

The effect of dietary pattern on LRF clearly changed after 1990. However, the underlying reason is much more complex than this trend suggests. During the apartheid era (e.g. 1961 to 1990), the populations categorised as 'non-Whites' in South Africa were severely restricted within major cities and metropolises in accordance with the 'dense settlement' patterns. Internal migration led to situations in which non-Whites and Whites worked under the same conditions, improving, to some extent, the standard of living of non-Whites; the peak of this phenomenon was reached in 1986.42 After 1990, as discrimination was gradually abolished, a notable increase in the contribution of dietary pattern to LRF was observed.
Our thought experiment method revealed that different drivers are responsible for the calculated trajectory in LRF at different periods of time. Technology and population, being the crucial factors in the calculation of LRF, developed in two different directions. Agriculture intensification led to the decline of LRF at the outset; however, over the last three decades of the study period, the LRF stabilised. As a consequence of the demographic factor, LRF rapidly increased after 1980. Although dietary pattern seems to have played a minor role in determining the total LRF, the increasing trend over the last two decades of the study period characterises the importance of dietary pattern in future changes in LRF. The development of each driving factor is a result of complex systems that complicate further analyses. The uncertainties in technological development, the demographic transition caused by unforeseen policies and the influence of AIDS and the global economic and trade network make forecasting future LRF more difficult.
Differences between crops
The overall pattern of LRF is the sum of the LRF of various food items produced from different primary crops. However, the development of LRF for different crops varies. The available data for individual crop area, crop yield and cropping intensity allowed us to conduct a second thought experiment. In this section, we choose maize and sugarcane as case studies. Maize is the country's most important crop: it is a dietary staple, a source of livestock feed and an export crop. It accounts for 36% of the gross value of South Africa's field crops but has experienced the negative effects of climate variability. Although overall maize productivity increased, the harvested area declined over the 46-year period (from 4.1 million ha to 2.6 million ha). South Africa is the world's 10th largest producer of sugarcane, an important commercial crop. However, the yield of sugarcane continuously decreased over the 46-year study period. Assuming that production is a function of both yield and harvested area, we calculated the individual effects of these two drivers on maize and sugarcane. Based on Figure 5a and 5b, the increase in maize yield was counteracted by the decrease in maize harvest area. Changes in yield had a dramatic influence on the total production of maize, reflecting the instability of South Africa's maize production. The combination of the decrease in yield of sugarcane and the expansion of the harvested area led to relatively stable production of sugarcane, especially from 1985 onwards.
To examine the individual effects of population growth, yield and dietary pattern on the LRF for each crop, the thought experiment method was used once again.
The consumption of both maize and sugarcane decreased because of changes in dietary pattern (Figure 5c and 5d) - a finding which appears to be inconsistent with the development of total LRF for all food items. A reduction in maize consumption can be observed throughout the entire study period, whereas sugarcane consumption declined from 1990 onwards. Thus, the drivers of the changes in LRF have affected the LRF for individual crops and for the whole country in different ways.
Share of imports in total LRF
The procedure for calculating the LRF considers production from inside (produced locally) or outside (by importing) a nation's territory; thus, it is possible for us to assess the share of LRF from imports. We have already excluded production destined for export. In the calculation, net import production is also assigned to South African yield values because the underlying goal of our work is to determine how much domestic land is needed to meet domestic consumption.
The share of imports in LRF exhibited a significantly increasing trend (Figure 6). In the first three decades, imports contributed negatively to the LRF of the country, indicating that South Africa was mainly an export-based country. During this period, the combination of the development of technology and population growth led to only a slight increase in total LRF. However, from 1990 onwards, the share of imports increased from approximately 0 in 1990 to over 0.33 in 2007, indicating the nation's increasing dependence on imports. In other words, the increases in total LRF in recent decades required more land outside of South Africa's territory. Relevant studies indicate that South Africa's regional economic growth (Figure 1a) is clearly related to the shares of imports.43 The nation's World Trade Organization membership and the opening of its economy in 199424 might have played a crucial role in this development.
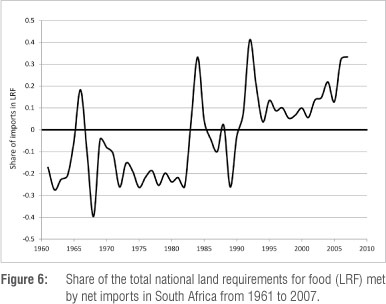
The variation in import shares is significantly associated with the fluctuation in total LRF. Imports accounted for a significantly higher proportion at peak points in some years more than in others. These peak years possibly correspond with the years of low production during droughts or social unrest, for example.44 For instance, because of a regional drought in the early 1990s, maize production dropped to just over 3 million tons in 1992. Therefore, approximately 5 million tons of maize was imported during that year.
The trend of import share is negatively correlated with South Africa's self-sufficiency (-0.72), indicating that the nation increasingly depended on imports to meet LRF and that increases in total LRF in recent decades were mainly met by land outside South Africa's territory. Moreover, during years of drought, imports dramatically increased and accounted for a high share of total LRF. These two findings imply that South Africa has become more vulnerable to world economic and trade market fluctuations and that it has a weak climate disaster response capability. Under the scenarios of projected population growth in the future or the poor's living standards improving, the issue of South Africa's food self-sufficiency will become more serious. Based on- previous research, the situation can be improved in two possible ways: importation and agricultural intensification. The former depends on internal and outer economic circumstances, and the latter would cause a series of environmental problems. Considering the negative impact of climate variability45-47, land degradation48-51, imbalanced domestic economic development and the wide disparity between the rich and the poor in this country, the consequences of both these solutions require further investigation.
Conclusions
In this study, we first analysed the dietary structure in South Africa from 1961 to 2007, based on FAO data, and found that the dietary pattern did not change towards more nutrient-rich food items as expected from the increase in GDP per capita. This phenomenon may be a result of the significant income gap in South Africa and the continuation of demographic transition. We then analysed the historical trend of South Africa's LRF, the contribution of different crops and the impact of individual factors on LRF. The results indicate that the total LRF in South Africa from 1961 to 2007 increased, whereas LRF per capita decreased before 1990 and increased thereafter. These trends indicate that in the near future the country may need more land to achieve self-sufficiency. The contribution of LRF differs for different crops. The arable land requirements for animal products as well as vegetable oil and oil crop consumption are the two main factors that contributed to the increase in total LRF.
Our historical assessment of LRF in South Africa reveals that LRF is driven by different factors at different times. Before 1980, increases in yield led to a slight decrease in LRF, reflecting the impacts of population growth. After 1980, the striking increase in population, combined with the decrease in cropping intensity, led to a continuing increase in LRF. In more recent decades, dietary pattern changes again led to an increase in LRF. These factors acted together to induce non-linear changes in LRF over the past 50 years. Thus, forecasting the relationship between the drivers of change and LRF will not be easy because it is not a simple linear relation. Finally, imports accounted for the increasing proportion of total LRF, especially since 1990. This result implies that the nation has increasingly depended on imports to meet LRF and that increases in total LRF in recent decades have been met mainly by land outside South Africa's territory, notably during disaster years. Such dependence makes South Africa vulnerable to the variation in global food price.
In this work, the calculated LRF is lower than the actual arable land needed in South Africa because it does not account for losses during food processing or seed need and assumes that the land will produce three calories of vegetal food to produce one calorie of animal food. Moreover, we employed a single cropping intensity for all crops. Given these limitations, caution is required in considering the calculated LRF to be reflective of the actual arable land area needed.
Acknowledgements
We are grateful for the comments of the editor and anonymous reviewers which greatly improved the quality of the manuscript. This work was supported by the National Basic Research Development Program of China (Grant Nos. 2011CB952001 and 2010CB428502), National Science Foundation of China (Grant No. 41271542), the Program for New Century Excellent Talents in University (Grant No. NCET-09-0227), the Fundamental Research Funds for the Central Universities and the Scientific Research Foundation for the Returned Overseas Chinese Scholars, State Education Ministry.
Authors' contributions
All authors contributed to the writing of the manuscript; Y.L. performed the calculations and wrote the body of the manuscript; M.F. and R.N. modified the manuscript's structure and English expression; and X.C. was responsible for the project.
References
1. Yitzhaki S. Relative deprivation and the Gini coefficient. Q J Econ. 1979;93(2):321-324. http://dx.doi.org/10.2307/1883197 [ Links ]
2. Labadarios D, McHiza ZJR, Steyn NP Gericke G, Maunder EMW, Davids YD, et al. Food security in South Africa: A review of national surveys. Bull World Health Organ. 2011;89(12):891-899. http://dx.doi.org/10.2471/BLT.11.089243 [ Links ]
3. Benhin JKA. South African crop farming and climate change: An economic assessment of impacts. Global Environ Chang. 2008;18(4):666-678. http://dx.doi.org/10.1016/j.gloenvcha.2008.06.003 [ Links ]
4. Gbetibouo GA, Hassan RM. Measuring the economic impact of climate change on major South African field crops: A Ricardian approach. Global Planet Change. 2005;47(2-4):143-152. http://dx.doi.org/10.1016/j.gloplacha.2004.10.009 [ Links ]
5. Walker NJ, Schulze RE. Climate change impacts on agro-ecosystem sustainability across three climate regions in the maize belt of South Africa. Agr Ecosyst Environ. 2008;124(1-2):114-124. http://dx.doi.org/10.1016/j.agee.2007.09.001 [ Links ]
6. Blignaut J, Ueckermann L, Aronson J. Agriculture production's sensitivity to changes in climate in South Africa. S Afr J Sci. 2009;105(1-2):61-68. [ Links ]
7. Bryan E, Deressa TT, Gbetibouo GA, Ringler C. Adaptation to climate change in Ethiopia and South Africa: Options and constraints. Environ Sci Policy. 2009;12(4):413-426. http://dx.doi.org/10.1016/j.envsci.2008.11.002 [ Links ]
8. Baiphethi MN, Jacobs PT. The contribution of subsistence farming to food security in South Africa. Agrekon. 2009;48(4):459-482. http://dx.doi.org/10.1080/03031853.2009.9523836 [ Links ]
9. Wirsenius S, Azar C, Berndes G. How much land is needed for global food production under scenarios of dietary changes and livestock productivity increases in 2030? Agr Syst. 2010;103(9):621-638. http://dx.doi.org/10.1016/j.agsy.2010.07.005 [ Links ]
10. Gerbens-Leenes W, Nonhebel S. Food and land use. The influence of consumption patterns on the use of agricultural resources. Appetite. 2005;45(1):24-31. [ Links ]
11. Zhang X, Cai X. Climate change impacts on global agricultural land availability. Environ Res Lett. 2011;6(1), Art. 014014, 8 pages. [ Links ]
12. Gerbens-Leenes PW, Nonhebel S, Krol MS. Food consumption patterns and economic growth. Increasing affluence and the use of natural resources. Appetite. 2010;55(3):597-608. http://dx.doi.org/10.1016/j.appet.2005.01.011 [ Links ]
13. Godfray HCJ, Crute IR, Haddad L, Lawrence D, Muir JF, Nisbett N, et al. The future of the global food system. Philos T Roy Soc B. 2010;365(1554):2769-2777. http://dx.doi.org/10.1098/rstb.2010.0180 [ Links ]
14. Kastner T, Rivas MJI, Koch W, Nonhebel S. Global changes in diets and the consequences for land requirements for food. Proc Natl Acad Sci USA. 2012;109(18):6868-6872. http://dx.doi.org/10.1073/pnas.1117054109 [ Links ]
15. Distribution of family income - Gini index [document on the Internet]. No date [updated 2008 Jan 24; cited 2012 Nov 29]. Available from: http://data.worldbank.org/indicator/SI.POV.GINI [ Links ]
16. Sadras V Bongiovanni R. Use of Lorenz curves and Gini coefficients to assess yield inequality within paddocks. Field Crops Research. 2004;90(2-3):303-310. http://dx.doi.org/10.1016/j.fcr.2004.04.003 [ Links ]
17. Rose D, Charlton KE. Prevalence of household food poverty in South Africa: Results from a large, nationally representative survey. Public Health Nutr. 2002;5(3):383-389. http://dx.doi.org/10.1079/PHN2001320 [ Links ]
18. Higgs NT. Measuring and understanding the well-being of South Africans: Everyday quality of life in South Africa. Soc Indic Res. 2007;81(2):331-356. http://dx.doi.org/10.1007/s11205-006-9012-3 [ Links ]
19. Posel D. Have migration patterns in post-apartheid South Africa changed? J Interdisc Econom. 2004;15(3/4):277-292. [ Links ]
20. Solomon H. Contemplating the impact of illegal immigration on the Republic of South Africa. J Contemp Hist. 2001;26(1):1-29. [ Links ]
21. Fin24. More illegals set to flood SA [homepage on the Internet]. c2006 [cited 2012 Apr 13]. Available from: http://www.fin24.com/Economy/More-illegals-set-to-flood-SA-20061123. [ Links ]
22. Banerjee A, Galiani S, Levinsohn J, McLaren Z, Woolard I. Why has unemployment risen in the New South Africa? Economics of Transition. 2008;16(4):715-740. http://dx.doi.org/10.1111/j.1468-0351.2008.00340.x [ Links ]
23. South Africa Yearbook 2012/2013. 20th ed. Pretoria: Government Communication and Information System; 2013. [ Links ]
24. Arora V. Economic growth in post-apartheid South Africa: A growth-accounting analysis. In: Nowak M, Ricci LA, editors. Post-apartheid South Africa: The first ten years [Internet]. Washington DC: International Monetary Fund; 2005. p. 13-22. [ Links ]
25. Mohamed N, Cousins B, editors. Greening land and agrarian reform: A case for sustainable agriculture. Proceedings: At the crossroads: Land and agrarian reform in South Africa into the 21st century; 1999 July 26-28; Broederstroom, South Africa. Cape Town: Institute for Poverty, Land and Agrarian Studies (PLAAS); 2000. [ Links ]
26. Food and Agriculture Organization. FAOSTAT statistical database [database on the Internet]. c2010 [cited 2012 Nov 29]. Available from: http://faostat. fao.org/. [ Links ]
27. Kastner T, Nonhebel S. Changes in land requirements for food in the Philippines: A historical analysis. Land Use Pol. 2010;27(3):853-863. http://dx.doLorg/10.1016/j.landusepoL2009.11.004 [ Links ]
28. Food and Agriculture Organization (FAO). Food balance sheet - A handBook. Rome: FAO Electronic Publishing Policy and Support Branch; 2001. p. 99. [ Links ]
29. Food and Agriculture Organization (FAO). Technical conversion factors for agricultural commodities. Rome: FAO; 2003. [ Links ]
30. Siebert S, Portmann FT, Doll P. Global patterns of cropland use intensity. Remote Sensing. 2010;2:19. [ Links ]
31. Palmer T, Ainslie A. Country pasture/forage resource profiles - South Africa [homepage on the Internet]. c2006 [cited 2012 Apr 13]. Available from: http://www.fao.org/ag/AGP/AGPC/doc/Counprof/southafrica/southafrica.htm#4. [ Links ]
32. Ehrlich PR, Holdren JP. Impact of population growth. Science. 1971;171(3977):1212-1217. http://dx.doi.org/10.1126/science.171.3977.1212 [ Links ]
33. Brown JR, Fehige Y. Thought experiments. Stanford Encyclopedia of Philosophy [serial on the Internet]. c1996 [updated 2011 Jul 29; cited 2012 Nov 29]. Available from: http://plato.stanford.edu/archives/fall2011/entries/thought-experiment/. [ Links ]
34. Grigg D. Income, industrialization and food-consumption. Tijdschr Econ Soc Ge. 1994;85(1):3-14. http://dx.doi.org/10.1111/j.1467-9663.1994.tb00669.x [ Links ]
35. Bruinsma J. World agriculture: Towards 2015/2030: An FAO perspective. London: Earthscan/James & James; 2003. [ Links ]
36. Popkin BM. The dynamics of the dietary transition in the developing world. In: Caballero BP, Popkin BM, editors. The nutrition transition: Diet and disease in the developing world. Amsterdam: Academic Press; 2002. p. 111-128. http://dx.doi.org/10.1016/B978-012153654-1/50008-8 [ Links ]
37. Lind JT, Moene K. Miserly developments. J Dev Stud. 2011;47(9):1332-1352. http://dx.doi.org/10.1080/00220388.2010.514332 [ Links ]
38. Bourne LT, Lambert EV, Steyn K. Where does the black population of South Africa stand on the nutrition transition? Public Health Nutr. 2002;5(1a):157-162. http://dx.doi.org/10.1079/PHN2001288 [ Links ]
39. Temple NJ, Steyn NP The cost of a healthy diet: A South African perspective. Nutrition. 2011;27(5):505-508. http://dx.doi.org/10.1016/j.nut.2010.09.005 [ Links ]
40. Temple NJ, Steyn NP Fourie J, De Villiers A. Price and availability of healthy food: A study in rural South Africa. Nutrition. 2011;27(1):55-58. http://dx.doi.org/10.1016/j.nut.2009.12.004 [ Links ]
41. Sanchez PA, Denning GL, Nziguheba G. The African Green Revolution moves forward. Food Secur. 2009;1(1):37-44. http://dx.doi.org/10.1007/s12571-009-0011-5 [ Links ]
42. Oosthuizen K. Demographic changes and sustainable land use in South Africa. Genus. 2000;56(3):81-107. [ Links ]
43. Narayan S, Narayan PK. Estimating import and export demand elasticities for Mauritius and South Africa. Aust Econ Pap. 2010;49(3):241-252. http://dx.doi.org/10.1111/j.1467-8454.2010.00399.x [ Links ]
44. Misselhorn AA. What drives food insecurity in southern Africa? A meta-analysis of household economy studies. Global Environ Chang. 2005;15(1):33-43. http://dx.doi.org/10.1016/j.gloenvcha.2004.11.003 [ Links ]
45. Schlenker W, Lobell DB. Robust negative impacts of climate change on African agriculture. Environ Res Lett. 2010;5(1), Art. 014010, 8 pages. [ Links ]
46. Muller C, Cramer W, Hare WL, Lotze-Campen H. Climate change risks for African agriculture. Proc Natl Acad Sci USA. 2011;108(11):4313-4315. http://dx.doi.org/10.1073/pnas.1015078108 [ Links ]
47. Lobell DB, Burke MB, Tebaldi C, Mastrandrea MD, Falcon WP Naylor RL. Prioritizing climate change adaptation needs for food security in 2030. Science. 2008;319(5863):607-610. http://dx.doi.org/10.1126/science.1152339 [ Links ]
48. Smith P Gregory PJ, Van Vuuren D, Obersteiner M, Havlik P Rounsevell M, et al. Competition for land. Philos T Roy Soc B. 2010;365(1554):2941-2957. http://dx.doi.org/10.1098/rstb.2010.0127 [ Links ]
49. Ramankutty N, Foley JA, Norman J, McSweeney K. The global distribution of cultivable lands: Current patterns and sensitivity to possible climate change. Global Ecol Biogeogr. 2002;11(5):377-392. http://dx.doi.org/10.1046/j.1466-822x.2002.00294.x [ Links ]
50. Du Preez CC, Van Huyssteen CW, Mnkeni PNS. Land use and soil organic matter in South Africa 1: A review on spatial variability and the influence of rangeland stock production. S Afr J Sci. 2011;107(5-6):27-34. [ Links ]
51. Du Preez CC, Van Huyssteen CW, Mnkeni PNS. Land use and soil organic matter in South Africa 2: A review on the influence of arable crop production. S Afr J Sci. 2011;107(5-6):35-42. [ Links ]
 Correspondence:
Xuefeng Cui
No.19 Xinjiekouwai Street, Haidian District, Beijing 100875, China
Email: xuefeng.cui@bnu.edu.cn
Received: 29 Nov. 2012
Revised: 06 Jun. 2013
Accepted: 12 Oct. 2013
© 2014. The Authors. Published under a Creative Commons Attribution Licence.

