


Services on Demand
Article
 English (pdf)
 Article in xml format
 Article references
Indicators

Related links
-
 Cited by Google
 -
 Similars in Google
Share

 Permalink
South African Journal of Science
On-line version ISSN 1996-7489
Print version ISSN 0038-2353
S. Afr. j. sci. vol.110 n.1-2 Pretoria Jan. 2014
RESEARCH ARTICLE
Shedding light on spectrophotometry: The SpecUP educational spectrophotometer
Patricia B.C. Forbes; Johan A. Nöthling
Department of Chemistry, University of Pretoria, Pretoria, South Africa
ABSTRACT
Students often regard laboratory instruments as 'black boxes' which generate results, without understanding their principles of operation. This lack of understanding is a concern because the correct interpretation of analytical results and the limitations thereof is invariably based on an understanding of the mechanism of measurement. Moreover, a number of tertiary institutions in Africa have very limited resources and access to laboratory equipment, including that related to the field of photonics, which prevents students from acquiring hands-on practical experience. We address both of these challenges by describing how students can assemble a novel, low-cost spectrophotometer, called the SpecUP, which can then be used in a range of experiments. The same kind of information can be generated as that obtained with costly commercial spectrophotometers (albeit of a lower quality). With the SpecUP, students also have the opportunity to vary instrumental parameters and to observe the effects these changes have on their experimental results, allowing for enquiry-based learning of spectroscopic principles. The results obtained for some chemistry-related spectrophotometric experiments are described for each of the two operational modes of the SpecUP although the instrument can be applied in fields ranging from physics to biochemistry.
Keywords: spectrophotometry; educational; spectrophotometer; photonics; SpecUP
Introduction
Spectroscopy forms an integral part of many undergraduate courses, in fields ranging from chemistry to physics to biochemistry. Spectrophotometers are therefore widely used in the practical portion of these courses. Problems in this regard arise with an increase in student numbers at tertiary institutions, especially if this increase is combined with a limited budget for capital equipment, which leads to students typically having to work in large groups during practical sessions or, at worst, to students merely observing a demonstrated experiment. Technology has progressed such that the variation of instrumental components within modern equipment has become largely electronically controlled, which has prevented students from obtaining hands-on knowledge relating to the operating principles of modern equipment.
Therefore, we designed and developed a spectrophotometer which would afford students the opportunity to discover and understand the concepts of spectrophotometry. The most important requirements for the final design included: that the instrument could be provided to universities as a kit containing components to be assembled by the students; that the settings of the components of the instrument could be manually varied by the student; that the instrument be sufficiently rugged to withstand repeated use; that the instrument generate experimental data of sufficiently good quality to be used in spectroscopy-related applied experiments; that building the electronic component of the instrument should not be the focus of the experiment; and, finally, that the cost of the instrument be significantly lower than that of commercially available instruments.
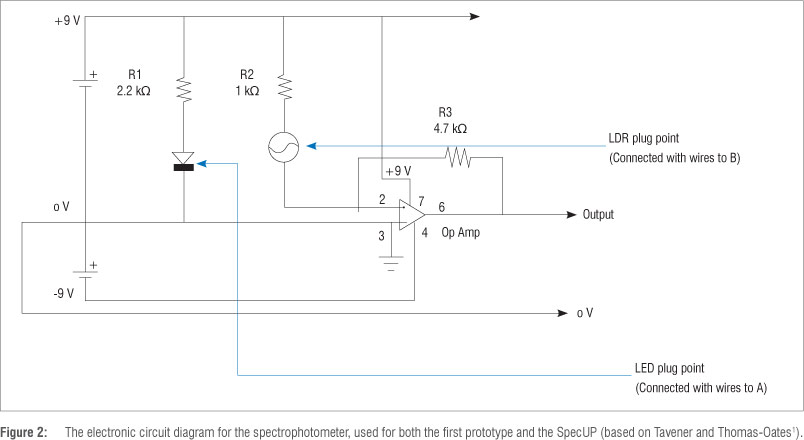
The concept of a 'build your own' spectrophotometer was based on a publication by Tavener and Thomas-Oates1, which involved the use of a light emitting diode (LED) with a prism in front of a slit as a light source, and a light-dependent resistor (LDR) as a detector. The construction and accompanying electronics of their design are simple enough to allow for cost-effective assembly of the instrument, which made it a suitable starting point for the development of our design. However, their spectrophotometer does not allow for the movement of individual components, therefore we decided to modify the design to meet this requirement as well as to remove the focus from the construction of the electronic component of the instrument. Other spectrophotometer designs reported in the literature were far more complicated, especially with regard to the electronics, and were therefore not considered further.2
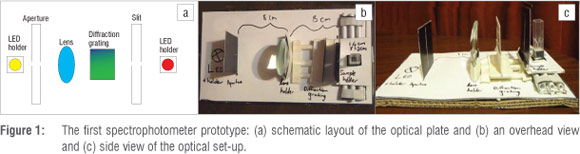
A first prototype was made in order to assess whether useful experimental results could be obtained from a spectrophotometer of very simple and cheap design, and to establish the components required, the spacing thereof and the size of the resulting instrument. The prototype was constructed largely out of black cardboard with plastic components (such as the lens, sample cell and slider mechanisms) (Figure 1). A LDR was placed behind the cuvette as a detector and the LED light source was built into an electric circuit based on that of Tavener and Thomas-Oates1, as shown in Figure 2. The circuit contained a plug for the LEDs in order to allow for interchange of different coloured components. Encouragingly, useable results for a number of experiments were obtained with this model, including the generation of absorption spectra. The configuration of a more robust final prototype was then decided on, which led to the construction of the novel SpecUP
Design of the SpecUP
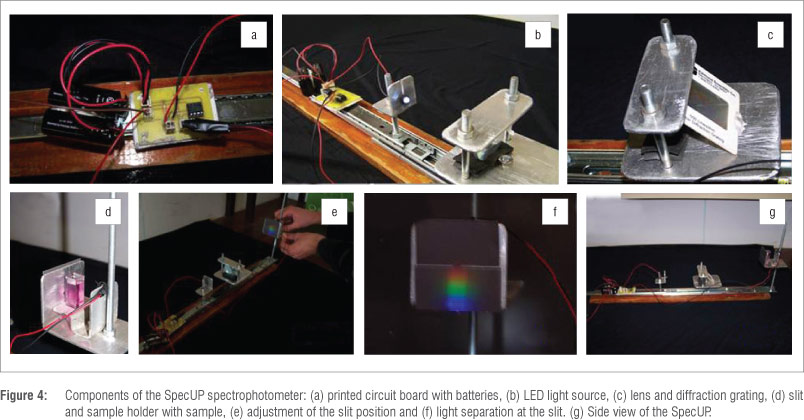
The SpecUP consists of either a white or coloured LED as the light source, a lens to focus the light, a diffraction grating with a slit which serves as a monochromator when a coloured LED is not used, and a LDR as detector (Figures 3 and 4). These components are mounted on a retractable bar consisting of three parts that can move independently: the LED on the first part, the lens and grating on the second, and the slit, cuvette holder and LDR on the third. The printed electronic circuit (Figure 2) equipped with 9 V batteries is used to supply the LED with power and to convert the resistance of the LDR to a voltage in the 1 V range. To measure the voltage, a low-cost commercial multimeter is used.
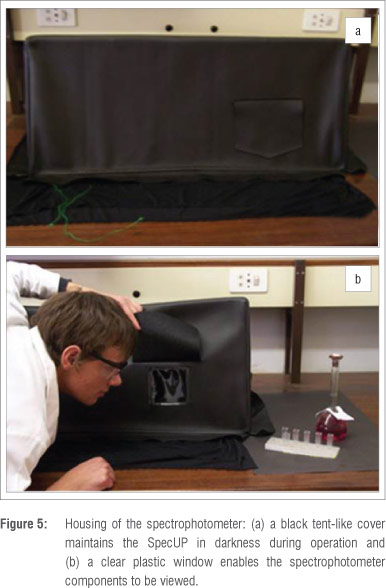
The SpecUP must be kept in the dark during operation because stray light can significantly influence the results. We therefore designed a tent-like cover of thick black cloth to fit over the SpecUP. The cover is light-tight and easily transportable and has a clear plastic window which allows for the viewing of experiments and can be covered with a flap (Figure 5).
The components of the SpecUP can be packed into a box of approximately 500 mm x 200 mm x 200 mm. Students could be responsible for assembling the SpecUP as part of their experimental report.
The estimated cost of the components is less than R500, which is significantly lower than the cost of commercial instruments, which are in the order of R30 000. The cost of many of the individual components of the SpecUP would in fact be reduced if purchased in bulk to prepare more spectrophotometer kits.
Operation of the SpecUP
The SpecUP can be operated in two modes, which differ in the light source employed and the consequent requirement of incorporating a diffraction grating or not. Both modes are briefly described here and examples of experimental results achieved in each mode are provided.
Mode 1
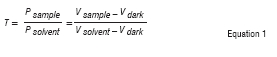
In the first mode, no diffraction grating is needed. The colour of the sample or standard solution is judged by eye and a LED of complementary colour is used. The sample holder is lowered (or the long threaded rod is replaced with a shorter one) until the slit is directly in the path of the LED beam. The two parts of the retractable bar are shifted relative to each other until the light is focused at the slit. The cuvette is rinsed thoroughly and is then filled with distilled water (or another solvent if appropriate) and is placed in the cuvette holder. The SpecUP cover is placed carefully over the SpecUP and the bottom flaps are folded flat to prevent light ingress. The voltage (Vsojveil) is measured, followed by the voltages obtained when the cuvette is sequentially filled with a range of suitable standard solutions of the coloured compound of interest in known concentrations. The voltage of a sample of the same compound of an unknown concentration is then recorded. In each case, correction is made for Vdrk, which is the voltage reading obtained when the LED is off. The results obtained from the standard solutions are used to construct a calibration curve, and the concentration of the unknown sample is determined from the equation of the regression line for the linear region of the curve obtained for more dilute solutions.
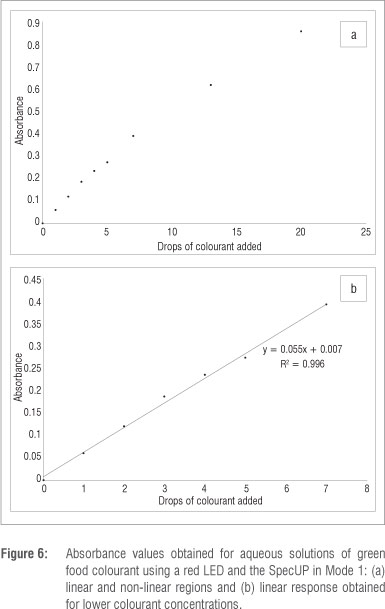
An example of a simple experiment based on using the SpecUP in Mode 1 is the determination of the linear range of absorbance versus concentration for aqueous solutions of food colourants, which may serve as a practical introduction to spectroscopy and to the Beer-Lambert Law. A LED of a complementary colour to the food colourant is used (e.g. a red LED is used for green food colourant solutions). Voltage readings are used to calculate the transmittance of the solutions by Equation 1 (where Psample and Psolvent, are the power of the light after it has passed through the sample and solvent, respectively); transmittance is then converted to absorbance using Equation 2.

Examples of the absorbance values obtained for sequentially diluted solutions are shown in Figure 6. It is evident that excellent linearity was achieved at lower colourant concentrations (between 0 and 7 drops of colourant per 100 mL water).
The SpecUP operated in Mode 1 with a blue LED was also successfully employed in the determination of the reaction kinetics of the iodine clock reaction (not reported on here).
Mode 2
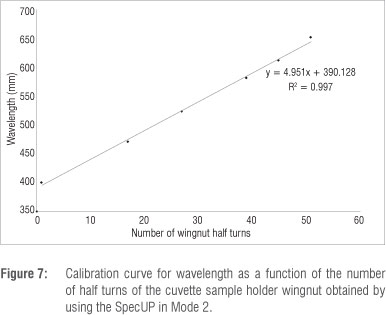
In the second mode, the diffraction grating is used together with a white LED. The height of the sample holder is changed until the first light on either one of the edges of the diffraction spectrum barely shines through the slit (refer to Figure 4f). Vsolvent followed by Vsample are recorded and are corrected for Vdark. The nut on top of the sample holder (visible in Figure 4d) is loosened and the wingnut underneath the sample holder is turned through 360° so that a particular colour of light shines through the slit. The voltage of both the solvent and sample is measured for the new slit position, in order to determine the absorbance. This process is repeated until light on the far side of the spectrum barely shines through the slit. In order to calibrate the slit, the number of wingnut turns to reach various colours is noted and a calibration curve of wavelength (being the mean wavelength of the particular colour) versus number of turns is constructed (Figure 6). This calibration curve is then used to convert the number of wingnut turns (the independent variable) to wavelength. It is acknowledged that there is not a linear relationship between these variables; however, this simple, rough approximation provides useable results over the narrow range of angles employed, as is evident from Figure 7.
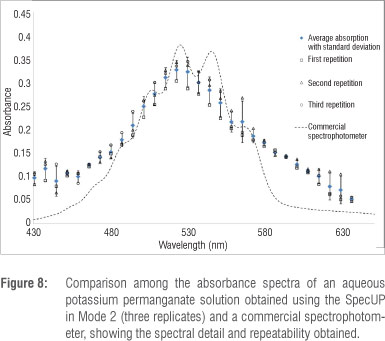
The SpecUP was operated in Mode 2 in order to obtain the absorbance spectrum of a solution of potassium permanganate. The absorbance of the solution for each wingnut position was obtained in the same manner as that described for Mode 1, but a white LED was used in conjunction with the diffraction grating. The spectrum of absorbance versus wavelength (Figure 8) was plotted after the number of wingnut turns had been converted to wavelength by means of a calibration graph such as- that shown in Figure 7. The experiment was repeated three times in order to assess the repeatability of the method and its precision. From Figure 8 it is clear that the results achieved with the SpecUP were comparable to that obtained by a commercial instrument, although some of the fine spectral structure was lacking. The maximum absorbance wavelength can be determined from the SpecUP experiment, and used to determine the concentration of potassium permanganate in solutions of unknown concentrations by comparison of their absorbance values with those of standard solutions. The repeatability was also very good despite the rudimentary wingnut approximation employed.
Conclusion
The SpecUP is not intended to be an accurate analytical instrument but an educational spectrophotometer. However, the sensitivity of the SpecUP is good enough to determine concentrations to within a few per cent. An absorbance spectrum of a potassium permanganate solution could be obtained which resembled that acquired with a commercial instrument; however, the finer spectral details could not be resolved. Modifications could be made to the SpecUP to enhance the experimental data which it can produce, such as improving the quality of the optical components employed.
A limitation of the SpecUP is that the path length of incident light through the sample varies with changes in the cuvette height. As the height of the sample holder is increased, the path length of the light also increases, which, according to the Beer-Lambert Law, increases the absorbance. Students should be encouraged to discover this effect and could suggest means of compensating for it as part of their experiments.
It is recommended that experimental methods include sections relating to the effect of changing experimental parameters (such as lens and sample positions) on the experimental results obtained, in order to fully utilise this important functionality of the SpecUP The SpecUP enables students to probe topics such as accuracy, precision, resolution, sensitivity and selectivity. These variables, as well as possible sources of experimental error and the limitations of each experiment, should be addressed by students in their laboratory reports.
The illustrative experiments which were included do not require the use of expensive or toxic chemicals. Additional experiments which could be performed using the SpecUP include the determination of metal ions in water based on the formation of coloured metal complexes,3 the investigation of reaction rates (such as the iodine clock reaction) and the determination of the end points of colourimetric titrations.4
The SpecUP spectrophotometer which has been developed is novel, simple and cheap to construct. In addition, the configuration allows for the movement of many of the components, which enhances the opportunity for students to follow the enquiry-based learning principle in discovering the effects of changing parameters on their experimental results. The open design of the instrument and the tent-like cover with a transparent window, allow students to get a real hands-on experience of spectrophotometry and thereby to better understand the principles involved.
The cost of the SpecUP is approximately R500, whilst commercial spectrophotometers cost ~R30 000. It is therefore believed that by utilising the SpecUP in undergraduate laboratories, universities could afford to have more instruments than if commercial spectrophotometers were employed. Students would thus have much more of a hands-on practical experience, which would aid their understanding of spectro-photometry and hopefully encourage them to engage in photonics-related research in the future.
Acknowledgements
We thank the CSIR National Laser Centre and the African Laser Centre for financial support; Dr Paul Motalane, Prof. Andrew Forbes and Thomas du Plooy for their guidance; Prof. Thomas-Oates for her interest and comments on the project; and Leon Engelbrecht, Nico van Vuuren, David Masemula and Mrs and Prof. Nothling for assisting with the manufacture of components. Phakama Botha is acknowledged for her contributions in the early stages of the project.
Authors' contributions
J.A.N. undertook this project as a third-year undergraduate student and was involved in all phases from the development of the design of the SpecUP to its manufacture and operation (devising and performing suitable application experiments). PB.C.F. came up with the idea of the SpecUP, obtained funding for the project and supervised the project.
References
1. Tavener SJ, Thomas-Oates JE. Build your own spectrophotometer. Educ Chem. 2007;4:151-154. [ Links ]
2. Yeh T-S, Tseng S-S. A low cost LED based spectrometer. J Chin Chem Soc. 2006;53:1067-1072. [ Links ]
3. Hauser PC, Rupasinghe TWT. Simultaneous determination of metal ion concentrations in binary mixtures with a multi-LED photometer. Fresenius J Anal Chem. 1997;357:1056-1060. http://dx.doi.org/10.1007/s002160050304 [ Links ]
4. Nazarenko AY Optical sensors for manual and automatic titration in undergraduate laboratory. Spectrosc Lett. 2010;43:555-560. http://dx.doi.org/10.1080/00387010.2010.510705 [ Links ]
 Correspondence:
Patricia Forbes
Department of Chemistry
University of Pretoria
Private Bag X20, Hatfield 0028, South Africa
Email: patricia.forbes@up.ac.za
Received: 05 Apr. 2013
Revised: 03 Sep. 2013
Accepted: 30 Sep. 2013
© 2014. The Authors. Published under a Creative Commons Attribution Licence.

