


Services on Demand
Article
 English (pdf)
 Article in xml format
 Article references
Indicators

Related links
-
 Cited by Google
 -
 Similars in Google
Share

 Permalink
South African Journal of Science
On-line version ISSN 1996-7489
Print version ISSN 0038-2353
S. Afr. j. sci. vol.109 n.11-12 Pretoria Jan. 2013
RESEARCH ARTICLES
A new look at demographic transformation for universities in South Africa
Kesh S. GovinderI; Nombuso P ZondoI; Malegapuru W. MakgobaII
ISchool of Mathematics, Statistics and Computer Science, University of KwaZulu-Natal, Durban, South Africa
IIOffice of the Vice-Chancellor, University of KwaZulu-Natal, Durban, South Africa
ABSTRACT
We used our previously defined 'Equity Index' to determine the demographic profile of the 23 universities in South Africa's higher education sector. We undertook an analysis of the demographic profiles of both students and staff based on audited 2011 data from the Higher Education Management Information System. We also considered an equity-weighted research index. We show the general applicability of the Euclidean formula in calculating 230 equity indices within the university sector. All institutions in the country were ranked in these categories. These rankings are quite instructive as to the demographics of the sector, both nationally and for individual institutions. No university has reached the ideal Overall Equity Index of zero and none falls within a 5% tolerance of the national demographic data. Four groups of universities emerge: those with good equity indices and low research productivity; those with poor equity indices and low research productivity; those with poor equity indices and high research productivity; and, finally, those with good equity indices and high research productivity. This index is the first quantitative measure that can be incorporated into an analysis of transformation. The Equity Index adds an innovative 'new look' to the profile and differentiation of the South African higher education landscape, and should become an important policy tool in steering the system towards a notion of transformation that connects, rather than disconnects, equity, development and differentiation. The index may also become a useful universal measurement of equity in higher education (and other) systems globally.
Keywords: transformation; universities; demographics; equity index; ranking
Introduction
Almost 20 years after the dawning of democracy in South Africa, the pace of transformation (by most standards) is very slow. In 2008, Soudien et al.'s1 report about the state of transformation in higher education concluded that, in particular, racism and sexism was pervasive and that the pace of redress was painfully slow. Their report noted serious disjunction between policy and real-life experiences of both students and staff, particularly in learning, teaching, curriculum, languages, residence-life and governance. While this report was an important milestone in higher education in South Africa, a respected higher education expert (Centre for Higher Education Transformation 2011, personal communication, February 06) summed up Soudien et al.'s report as follows:
Soudien started this off very badly by following an anti performance, anti scientific method 'confessional route', setting up an office and asking people to tell personal stories - so at UCT about 20 people from 20 000 reported racism; if he had investigated excessive drinking he would probably have gotten more stories - this does not mean there are no racism stories, but we want to look at systemic racism as reflected in empirical performance, not a collection of personal stories, that was Tutu's committee.
The importance of transformation in the higher education sector was underscored early on in our democracy. Firstly, consensus in the government of national unity was that higher education was in need of transformation.2 The Education White Paper 3 indicated that 'the higher education system must be transformed to redress past inequalities, to serve a new social order, to meet pressing national needs and to respond to new realities and opportunities'3. In addition, of the 12 goals spelt out in the Education White Paper 33, 6 deal directly with the issue of equity (for both students and staff)4 in higher education transformation. Furthermore, the National Working Group Report5 proposed
a new institutional landscape, ... providing the foundation for establishing a higher education system that is consistent with the vision, values and principles of a non-racial, non-sexist and democratic society and which is responsive and contributes to the human resource and knowledge needs of South Africa.
All the above emphasised the complexity and national character of higher education transformation in the new South Africa.
Furthermore, the equity-related goals in the Education White Paper 33 were measured in percentages or participation rates as proxies for equity in the sector. Important as these measures were in following national trends and patterns of transformation within the sector, they lacked details and specificities of categories within an institution and between institutions; for example, if an institution was undergoing transformation it was not clear where within the institution this process was occurring or lagging behind. These general measures were not easily translated into indicators to measure relative performance within the sector. In addition, the usual, erroneous, practice of merely using percentage changes in particular categories does not give a good indication of overall change (especially with respect to equity).6
Clearly, there is a burning need for an objective measure to investigate transformation. At its most basic level, the term 'transformation' refers to 'a marked change in form, nature or appearance'7. In the South African context, transformation refers more specifically to change that addresses the imbalances of the past (apartheid) era. It has many facets, including demographic and systemic change. However, regardless of the different components and qualitative measures for transformation, the ultimate (and most important) indicator is that of demographics (racial and gender statistics). Until now, there has not been a way to combine these statistics into a single indicator of the equity profile of an organisation. Our Equity Index6 (EI) measures the distance all institutions and organisations have to travel to arrive at the constitutional imperative of a non-racial, non-sexist and democratic society. Each institution/ organisation will have a particular (usually different) path to traverse depending on its EI. Its ability to negotiate this path will be a measure of its success at transformation.
Whenever equity has been raised in the transformation of higher education and policy debates, the tension with quality (development) has also been raised. This issue was particularly apparent during the National Commission on Higher Education. Some8-12 argued quite passionately that a transforming higher education sector driven through equity would compromise quality and standards. It followed, the argument went, that it was therefore not worth pursuing the equity route in transformation but to maintain the status quo.
Badat et al.13 reasoned that higher education would be confronted with sets of contradictions, and that the most problematic would be the tension between equity and development. For example, it was argued that a transformed, expanded and democratised higher education system could become more equitable in terms of access for large numbers of Black students registered in cheap courses, such as the then popular biblical studies and language majors. However, it was also foreseen that two problems could possibly emerge from such a system. The first was a growth in enrolment figures and a massive increase in student-to-staff ratios with the likelihood of a drastic reduction in quality. The second problem was that the choice of cheap courses would not necessarily provide skills in critically needed areas. As a result, the transformed system of higher education might be more equitable, but would contribute little to socio-economic development.
To resolve this equity-development tension, the National Commission on Higher Education proposed that South African higher education should be massified, and should be steered from the centre primarily through goal-directed funding.5 At the time, there was no method of measuring equity and knowing how such a numerical measure would elucidate such a complex matter.
In this paper, we use our previously defined6 EI to make objective measurements with regard to equity. This index provides an objective transparent numerical value of equity that makes it possible to rank or compare institutions or categories within an institution for planning or monitoring purposes. We apply the EI to the 23 universities in South Africa (Table 1) with respect to student enrolments and graduation as well as staff employed. This exercise generated 230 EIs in total for both students and staff that were compared within and between universities.

In order to investigate the equity-quality (development) tension, we used the EIs and study these relative to the total weighted research outputs as well as per capita research output as proxies for the diversity of staff in new knowledge production for each of the 23 universities. As UKZN has previously reported through various indicators to be a 'university that has undergone major transformational changes since 2004 with access and equity having improved at both student and staff levels, and.... high-level knowledge inputs and outputs'14,15, it was important to assess the extent and generality of this experience within the university sector using the EI.
Methodology
Our previously introduced6 Equity Index (EI) is given by
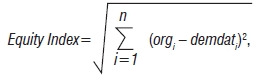
where orgi refers to an organisation's demographic percentage for the ith category (e.g. Black African females) and demdatj refers to the national or regional (as appropriate) demographic percentage for the same category. Using this formula, we are able to calculate a racial EI (using only racial demographics), a gender EI (using only gender demographics) and an overall EI (using racial and gender demographics). Here we use the overall EI and simply call it the EI.
The advantage of this formula is that it is a simple and objective means of determining the equity profile of an organisation. More importantly, it punishes over-representation and under-representation, thus forcing organisations to properly plan their equity targets. This ensures that transformation is balanced, taking place within the parameters of the national benchmarks. Interestingly, if a university employs only Black African female staff, for example, the EI is calculated to be a very poor 73.4. In the case of only Black African staff (ignoring gender imbalances) this figure improves to 26.4, which is still far outside the acceptable tolerance levels. Another benefit of this index is that, over time, organisations can reflect on their changing demographics by simply monitoring the overall EI - a decreasing index obviously points to an improving demographic profile.
The formula does not measure the quality of the equity profile; rather it indicates how far away an organisation is from a given target. Importantly, two organisations with the same EI do not have the same demographic make-up; rather, they are the same distance away from the targeted percentages, i.e. they have the same distance to travel but along different paths.
This index is simply the Euclidean distance between two sets of points. As a result, while we present it to determine equity profiles, it can be used for different scenarios in which targets have been set. For example, an organisation can set up various target indicators to gauge its overall progress. At different points in time, determining the distance between the actual indicator values and the targets can give a good sense of temporal progression.
Data sets
In any analysis using the EI, it is of paramount importance to choose the appropriate target data set. In this study, we used national demographic data as indicated in Table 2. Thus the EI was calculated with respect to six categories (incorporating the four race groups and both genders). Naturally, one can calculate a different EI depending on the categories being used. In particular, one could stratify the data in terms of gender for each race group. This stratification would result in eight categories. Each EI calculation is relevant, provided that no comparison is attempted between EIs calculated using different benchmarks.
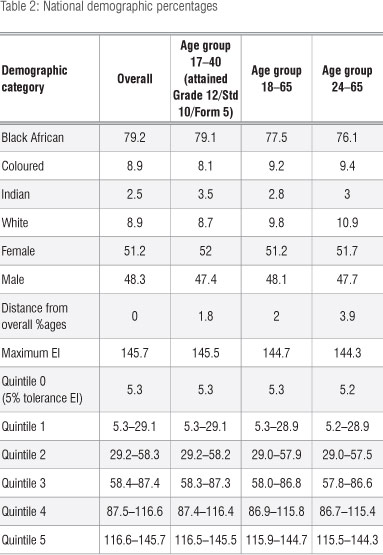
The national demographic reference (and its subsets) is the preferred benchmark in this analysis as all South African universities are classified as national assets; are expected to address national priorities; are governed nationally by a minister; fall under national and not provincial competency; and recruit their staff and students largely nationally and internationally. Examination of the South African Employment Equity Act (No. 55 of 1998) and the Employment Equity Regulations of 2009, show that the demographic structural analyses imposed upon South African employers (including universities) by the Department of Labour is consistent with the broad EI methodology applied in the current study. A casual visit to the campuses of UCT, UP, UKZN and Wits will attest to the notion that most universities are a microcosm of the nation rather than the region. In addition, the provinces in South Africa are not only a legacy of apartheid, but also the colonial past. Focusing on provincial demographics will only entrench this history and will not address true transformation on a national scale. Finally, we reiterate that comparisons of EIs can only make sense when the same benchmarks are used. Using different, province-specific, benchmarks for each institution undermines any comparison among the institutions.
The national demographic data was obtained from the 2011 census.16 Statistics South Africa (StatsSA) further provided three age-adjusted national demographic reference tables for students, for general university staff and for academic staff. (Note that the sum of the racial percentages does not total 100% because the percentage of foreigners in South Africa was removed from our data.) While we have calculated the EIs using these three age-adjusted reference sets, we note that there is no statistical difference between each age-adjusted data set and the national data.
We applied the EI formula to the audited 2011 Higher Education Management Information System (HEMIS) data provided by the Department of Higher Education and Training17. This set of data is part of the national system used by all the 23 universities for reporting and accounting to the department in several categories of staff and students. These categories represent a translation of government-derived national policy goals articulated in the Education White Paper 33, some of which focus on equity. The HEMIS data also forms the basis of the 'block grant' allocations to universities. Currently block grant allocations are based on outcomes, specifically research productivity and student graduations. The department and universities use the HEMIS data to track, amongst others, the equity changes of staff and students over time since 1994. It is from this universally accepted set of data that the EIs were calculated.
For the research productivity analysis, we used the 2011 total weighted research productivity data and the per capita research output data from the Department of Higher Education and Training18, which is another commonly accepted measure of knowledge production within the sector. The total weighted research productivity combines weighted research publication with master's and doctoral graduates. It is a reliable indicator of knowledge production and quality. The per capita research output is a result of dividing the weighted research output by the number of academic/research staff at the institution and is a good indicator of the research efficiency of an institution.
Our main purpose was to rank institutions in the university sector nationally, based on their EIs. We used the age-stratified data as the target benchmark for students, overall staff and instructional/research professional staff as indicated in the final three columns of Table 2, respectively. However, as is indicated in Table 2, the difference between the age-stratified data and the overall national data is small. As a result, the EI calculations do not differ much, although the small difference could affect relative rankings of closely grouped institutions. (It is important to note that while one could compare the instructional/ research staff profile to the pool of MSc and/or PhD qualified people, we have taken the national age-stratified pool as our benchmark. This approach is taken as the universities are responsible for ensuring that this age group is suitably qualified.) We also determined whether the institution's demographic profile is acceptably close to the national benchmark. We took an overall tolerance of 5% of the target for each individual demographic category. This approach led to the threshold EIs indicated in Table 2. Thus institutions with an EI less than the relevant tolerance are considered to match the national demographic profile sufficiently. The maximum EIs are also indicated in Table 2. Institutions can use these figures to gauge how they are performing with respect to the maximum possible EI and the acceptable minimum EI. Finally, we divided the EI range into quintiles, with the tolerance being Quintile 0. Quintile 1 is the first 20% of the maximum (excluding the tolerance) with the subsequent quintiles each being successive 20% ranges. Note that we have rounded up for the lower bound and rounded down for the upper bound. This allows us to view bands of institutions as well as to give institutions an additional indicator with regard to EIs - that is, movement between quintile levels.
Student analyses
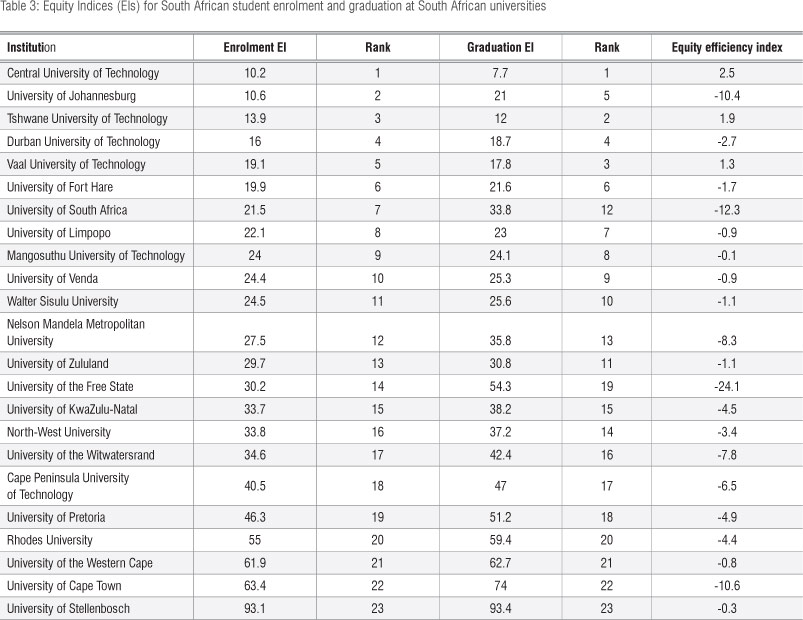
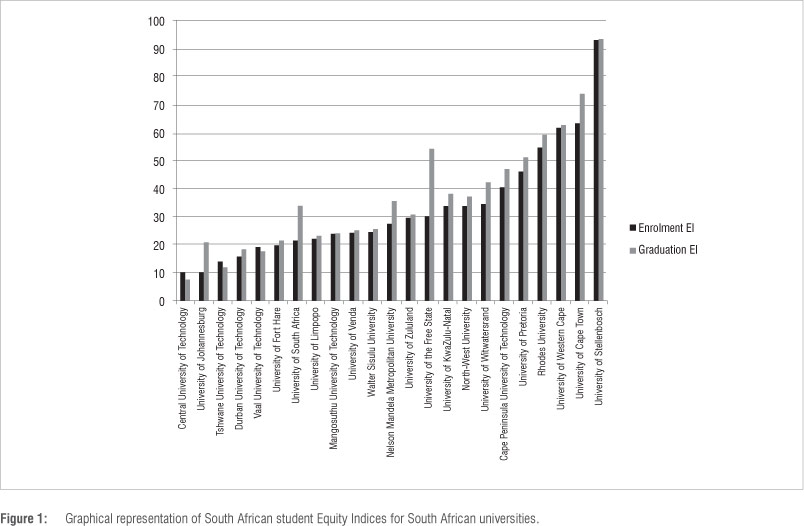
In Table 3 we present the EIs of the 23 universities with regard to South African student enrolment and graduation. A graphical representation of this sector with regard to students is given in Figure 1. We note no institution has a student enrolment EI within the tolerance of 5.3. This is also true of the graduation EI. It is rather disappointing to see that none of the 46 possible measures falls within the tolerance levels (Quintile 0). With regard to student enrolment EIs, 12 institutions fall into Quintile 1, 8 into Quintile 2, 2 into Quintile 3 and 1 into Quintile 4; whereas, with regard to student graduation EIs, only 10 fall into Quintile 1, 9 into Quintile 2, 3 into Quintile 3 and 1 into Quintile 4.
As an additional indicator, we calculated an 'equity efficiency index' for each institution. This index is the difference between the enrolment EI and the graduation EI. A positive efficiency index indicates that the university's student graduation demographic profile is a better match to the national demographic profile than its student enrolment demographic profile. In such situations, the institutions are clearly addressing their enrolment mismatch with the national demographics by improving their graduation EI. Unfortunately, only three universities (CUT, VUT and TUT) have a positive efficiency index. The efficiency indices for UJ, UFS, Unisa, NMMU and Wits yield a stark observation - there is a dramatic worsening of their respective EIs from student enrolment to student graduation. In fact, for all these institutions, the EI increases by over 20% (98.1%, 79.8%, 57.2%, 30.2% and 22.5%, respectively). As a result, the demographics of the graduating students are much worse than those of the enrolled students. This translates into a definite equity profile of students dropping out of universities nationally. The existence and extent of this phenomenon (both of students not finishing their studies and their equity profile) is rather worrying.
While the remaining 18 institutions fair much better, it is important to not focus on the efficiency index to the exclusion of the EI. In particular, UWC and US have excellent efficiency indices, but fall into Quintiles 3 and 4, respectively, with respect to both component measures.
Overall, for the sector, the student enrolment EI is 18.7 while the student graduation EI is 27.5 resulting in an efficiency index of -8.8 (this translates into a 47.1% worsening of the EI). In addition to being numerically worse, the graduation EI is almost in Quintile 2 as opposed to in the middle of Quintile 1 for the enrolment EI. In fact, overall, the enrolment EIs are (statistically) significantly lower than the graduation EIs (p=0.0039). These figures should cause sober reflection within the sector as well as for the individual institutions. Clearly the migration of students during this 20-year period of democracy requires a careful study to determine if there are institutions that are 'safe havens' for particular race groups. The student enrolment and graduation demographic profiles of the higher education sector need significant attention to properly reflect the South African national population demographics.
As a final comment, we note that the data used is specifically for South African students. Using data for all students (including foreign students), we note that in all but 4 of the 46 measures, the EIs improved (p=0.0008) compared with when only data for South African students were used. Clearly, foreign students tend to improve the equity profile of the sector. This important observation needs some consideration, especially as the 'block grants' awarded to universities do not distinguish between South African and foreign students.
Staff analyses
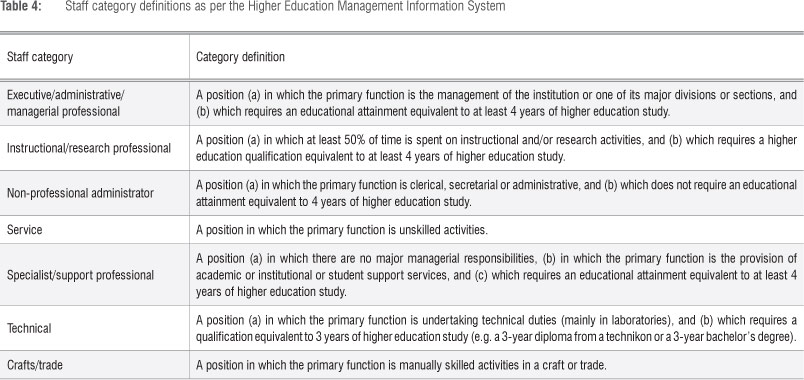
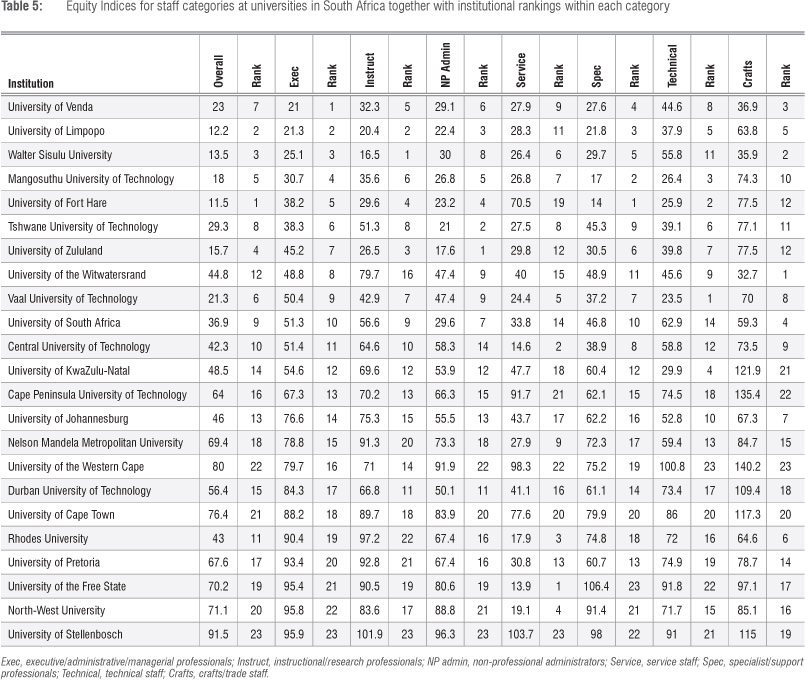
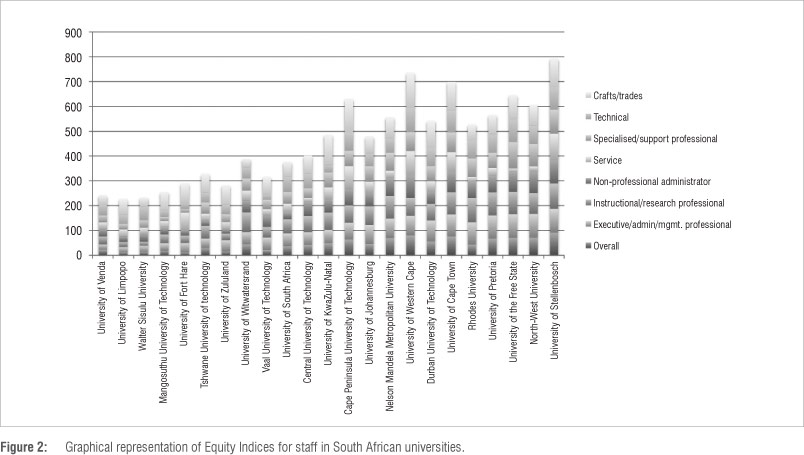
While the student data paints a poor picture of the sector, the staff data paints an even bleaker picture. We used the HEMIS classification shown in Table 4 to differentiate between the various categories of staff. In Table 5 we show the EI for the total staff complement as well as the EI for the different categories of staff for each university. (We note that the actual number of staff in the category 'crafts/trade' is quite small. We have previously cautioned6 against using an EI for small numbers as the EI can change dramatically with a small change in individual staff employed.) The rank of each institution in each category is given in the column to the right of each category. The data is also represented graphically in Figure 2.
From Table 5, it is clear that no institution matches the national demographic profile within the required tolerances. Thus out of a possible 184 measures none fall within the desired range (or in Quintile 0). In terms of the overall staff EIs, seven institutions fall into Quintile 1, eight into Quintile 2, seven into Quintile 3 and one into Quintile 4. If we look into the history of the institutions and their locale, these data are clearly footprints of the past that have yet to be swept away.
Analyses of individual institutions can be quite revealing. In the cases of UKZN and Wits, the EIs tend to fall mostly in Quintile 2 for most categories of staff. Ignoring the 'crafts/trade' category, the two categories of concern at UKZN are 'instructional/research' staff and 'specialist/support professional' staff - both of which lie in Quintile 3. On the other hand, UKZN has done fairly well with regard to the EI ranking of 'technical' staff, which falls just outside Quintile 1. For Wits, the only category of concern is the instructional/research staff as this EI falls at the upper end of Quintile 3.
The staff EI for the sector is 44.7 while that of instructional/research staff is 64.4. These EIs arise in Quintiles 2 and 3, respectively, reflecting that this sector has a long way to go before it can be considered truly (demographically) transformed, especially among its instructional/ research staff.
Equity versus quality
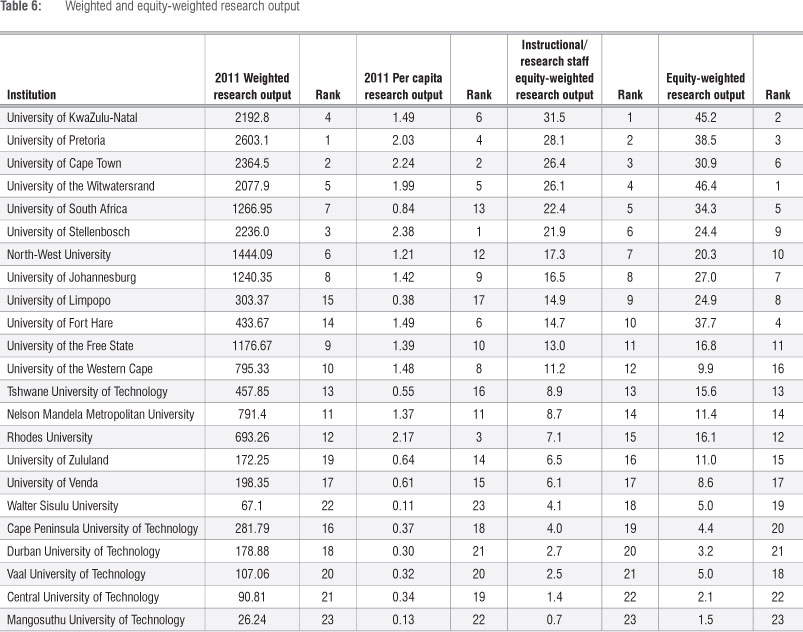
Total weighted research productivity has been used to measure high-level knowledge production and innovation within the South African university sector. It is an important indicator of quality within the system. The EIs measure diversity within each category of analysis. In order to address the equity-quality (development) tension, we introduce the concept of equity-weighted research output. This measure is obtained by dividing the weighted research output17 by the staff EI. This value reflects the diversity of the knowledge-producing staff. As the main direct contributors to research output are the instructional/research staff, we calculated the equity-weighted research output with respect to that particular EI (but also report the results using overall staff EIs). We present the results for each of the universities in Table 6.
If we focus on the generators of knowledge production (the instructional/ research staff), we see that the top five institutions in terms of weighted-research output cluster towards (but not at) the top of the table. The exception for this clustering is US as its poor EI means that it falls outside the top five. The good productivity of US cannot compensate for its poor EI. Of the top five universities in terms of weighted research output, only three (Wits, UKZN and UP) maintain a position at the top of the table when the overall EI is used. The other two - UCT and US -drop to positions six and nine, respectively. Clearly, the good overall EIs for UFH, Unisa, UJ and UL compensate for their relatively low output. However, it is important to focus on the instructional/research staff EIs as this category of staff is responsible for knowledge production. Unisa manages to maintain a rank of five regardless of which EI is used to weight the data.
To understand and elucidate the relationship better, we present a scatter plot of productivity against instructional/research staff EI in Figure 3. The vertical axis ranges from zero to 144.3, the maximum possible EI for this category of staff. As a result, we can divide the plot vertically along the midpoint of 72.2. The horizontal axis ranges from zero to 3000 (rounded to the nearest 500). For this axis, the midpoint is not obvious as there is no theoretical maximum for productivity. The vertical solid line divides the plot horizontally at 1500 but one could also divide the plot along 1301.53 (half the maximum achieved) as indicated by the dashed line. This analysis shows that there is no direct linear correlation between EI ranking and research productivity. Four groups of universities emerge from this analysis: universities with good EIs and low productivity (bottom left quadrant), those with poor EIs and low productivity (upper left quadrant), those with poor EIs and high productivity (upper right quadrant) and one with a good EI and high productivity (lower right quadrant).
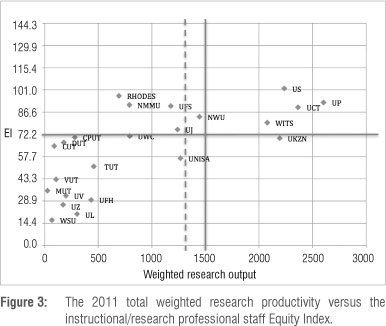
Three universities - Rhodes, NMMU and UFS - fall firmly into the worst quadrant (upper left), which indicates poor equity profiles together with low research productivity. These universities need to urgently address both aspects in order to contribute meaningfully to higher education in a transforming South Africa.
Interestingly, five universities (NWU, UJ, UKZN, Unisa and Wits) cluster around the centre of the plot. Unisa has a good EI (which can certainly improve) and needs to address its productivity. Both NWU and UJ have to address both their EIs and their productivity. Wits has a high productivity but must address its EI. UKZN has a good EI and high productivity (although it should still address its EI). While all five have issues to address, their position on the plot indicates that they have the greatest potential for exhibiting good equity and high productivity. They require a slight tweaking or further emphasis of their missions in order to fall firmly into the lower right quadrant, but their positions verify that improving equity certainly does not imply a negative impact on high-level knowledge productivity.
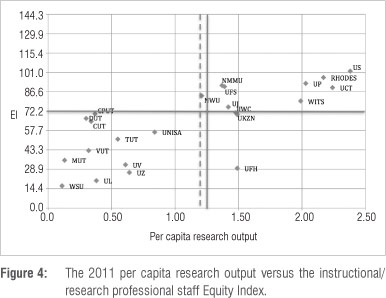
In order to address the issue of institutional 'size', one could also look at research in terms of per capita output. We present this perspective in Figure 4. The quadrant boundaries have been determined in the same manner as for Figure 3. Here we note, very pleasingly, that no university falls firmly into the top left quadrant (which indicates poor EIs and low per capita research output) as all of these universities have moved across into the top right quadrant (with still poor EIs, but now with high per capita research output) and join the universities occupying this quadrant from Figure 3. It is also pleasing to see that UFH falls very clearly into the bottom right quadrant (good EIs and good per capita research output) together with UWC and UKZN (both of which just enter this quadrant). With the exception of UFH and UWC, the institutions in the lower left quadrant in Figure 3 remain in that quadrant (with poor EIs and low per capita research output). We do note that Unisa has moved backwards (albeit relatively). In this analysis, the central cluster comprises seven universities - NMMU, NWU, UFS, UJ, UKZN, UWC and Wits - with the potential to entrench themselves into the (desirable) bottom right quadrant.
The finding that some universities have good equity while remaining high-level knowledge producers provides lessons and examples in the equity-quality (development) tension. However, it is clear that the traditional research universities remain dominant. This should shift the focus to a discussion on how the remaining institutions can improve their high-level knowledge production and/or EIs or can reorganise themselves or their missions to deal with the dual challenges of equity transformation and high-level knowledge production, or, alternatively, how the sector as a whole can reimagine new forms of partnerships or alliances in order to address the equity-quality challenge. This effort must incorporate the fact that the ability of any institution to produce quality research correlates directly with the percentage of PhD-qualified staff, the number of postgraduates and postdoctoral fellows as well as good overall infrastructure together with investment in research infrastructure, amongst other factors.19,20
Discussion and conclusions
We have shown previously6 that the Euclidean distance mathematical formula can be used to calculate EIs of particular categories within an organisation. Here we have used audited data and applied the formula to calculate and analyse student and staff EIs and relate these to research productivity within South Africa's 23 universities. The study has shown the general applicability of the formula and emphasised the essential role of high-level knowledge production in the quality of equity during the transformation process.
Until now, there has been no simple, unbiased, means of assessing individual institutions or holding institutions accountable for their demographic transformation. Our EI provides an objective, and measurable, instrument to achieve these ends. Importantly, policymakers can use this index as a vehicle to steer the sector. The simplicity of the measure means that even a layperson can follow the progress of equity in a transparent and objective way.
We emphasise that this is the first quantitative measure that can be incorporated into an analysis of transformation. It should complement and enhance the many qualitative measures in existence.
Any university-based performance measurement system should satisfy the following criteria (Bunting I 2013, personal communication, June 19):
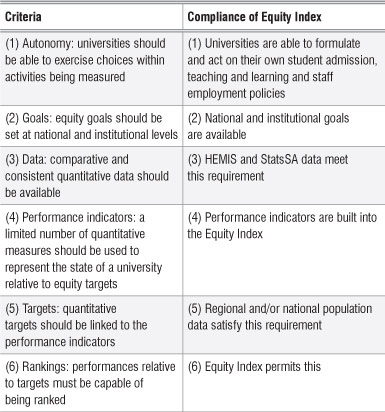
By satisfying all six criteria above, the EI is verified as a suitable performance measure for universities.
Furthermore, the EI addresses two crucial nationally derived policy documents in the development and transformation of South Africa: The Education White Paper 33 as well as the Employment Equity Act (55/1998)21. We commented earlier on the impact of our EI on the Education White Paper. Here we wish to emphasise its importance in achieving the goals of the Employment Equity Act. This act makes specific reference to national and regional demographic profiles and refers the reader to data from StatsSA. However, beyond simply reporting demographic percentages, no other means was available to obtain a picture of the overall equity profile of an organisation. Our EI provides the first systematic means of determining this crucial facet of reporting in terms of this act. It is remarkable that one simple index can positively impact two pivotal national policy documents.
From the results presented, some important conclusions can be drawn. Firstly, EIs can be objectively measured using the distance formula, within a variety of categories in the 23 institutions. This study has demonstrated the general applicability of the formula in measuring 230 indices. As a result, EIs can be used to set benchmarks, and compare and rank institutions within each category. In addition, each institution can now address its equity transformation challenges in an objective, focused but transparent way. EIs can be used by each institution to set targets, to review targets and to examine particular targets within categories that are lagging behind. Institutions can learn from each other's successes and failures. Using the idea of quintiles, organisations can now be clustered in terms of their EIs. This clustering can help address systemic transformation issues in a consolidated manner by dealing with a group of similar institutions. Equally, and importantly, other organisations in our society can apply this simple method to assess their state of equity transformation. Many other higher education systems globally struggle with measuring equity, i.e. gender equity universally, the equity of the caste system in India, the equity of immigrants within the EU and the equity of minorities within US higher education systems. The importance of quantifying, benchmarking and monitoring equity cannot be underestimated in all these systems. This simple method can now be applied in these situations too.
Secondly, every institution analysed has a challenge with respect to some EI. Particular universities have continued to show poor EI values of students and staff. The worst EIs are in the traditional, 'previously advantaged' universities. The merger process has ameliorated this effect in the case of UKZN and Unisa, and more so for UJ. Those institutions with poor EIs need to be set equity targets to steer and accelerate the improvement of their EIs. By themselves the necessary improvements may seem impossible or at best elusive within the timeframes of the National Development Plan.22
Thirdly, student EIs are much better (lower) than staff EIs across all but 6 of the 23 institutions. The student enrolment EI is 18.7 and the student graduation EI is 27.5 versus 44.7 for university staff and 64.4 for instructional/research staff. The fact that the student graduation EI does not reflect the national demographics supports the potential claim of institutions (and businesses) that their poor equity profile is as a result of the poor equity profile of the pool of available graduates. However, this reason cannot account for the gulf between the student graduation EIs and the staff EIs at universities. One would expect that, as universities are producing graduates with a particular EI, this production should translate into similar EIs for their staff. That this is not the case, leads one to surmise that universities are not employing their own graduates. Of particular concern is the 'efficiency' of the sector in producing graduates in line with the equity profile of the enrolled students. Many universities are clearly just revolving doors for some race groups. Using almost any of the equity measures considered here, there is a vast distance in equity left to travel for the sector.
Fourthly, high-level knowledge production and equity can be connected during transformation through quality. We have previously shown that equity and development can be connected during the process of transformation.13,14,18 There is a cluster of universities in this study (NMMU, NWU, UFS, UJ, UKZN, Unisa, UWC and Wits) that have the potential to attain good EIs and remain high-level knowledge producers (in terms of per capita output, UFH has already achieved this goal). This group indicates that excellence does not need to be sacrificed for transformation. One could even argue that this excellence needs transformation. 'Equity can be achieved with excellence and demonstrated empirically with hard evidence. Indeed UKZN has shown that diversity and equity are strengths not weaknesses in transformation'13,14. On reviewing UKZN data, Bunting (Bunting I 2012, personal communication, September 17) commented that:
The various UKZN indicators point to a university that has undergone major transformational changes since 2004. Access and equity have improved at both student and staff levels, and so have high-level knowledge inputs and outputs. The strongest lesson that emerges from your indicators is that the commitment to student and staff equity has in fact enhanced UKZN's contribution to national development in general, and to national high-level knowledge production in particular.
It is interesting to note that among the universities in this cluster, the majority underwent mergers. If we focus on the six universities with the highest EIs - US, Rhodes, UP NMMU, UFS and UCT - only one (NMMU) underwent a merger.
The South African dilemma is that some of the institutions with good equity are poor knowledge producers, and vice versa. In this study, a group of 8-11 universities (Figure 3) with very good EIs but with very low total weighted research productivity outputs is discernible (a similar number have good EIs but low per capita research output). Even with their good EIs, there is no improvement in their equity-related ranking in high-level knowledge production. This finding suggests that the quality of equity transformation is essential in knowledge-producing organisations such as universities. This group constitutes an example of how equity transformation without quality leads to unintended negative consequences. As the status quo, this group adds no value to national development, which the Council on Higher Education aptly put as follows:
High quality higher education is crucial for social equity, economic and social development and a vibrant democracy and civil society. If higher education does not produce knowledgeable, competent and skilled graduates, generating research and knowledge, and undertaking responsive community service, then equity, development and democracy will all be constrained.23
The Centre for Higher Education Transformation (CHET) work on differentiation24,25 focused on knowledge production (development) and showed that three clusters (high, medium and low) were clearly discernible. It must be noted that the CHET clusters are in contradiction to the ARWU (http://www.shanghairanking.com) and THE (http://www.timeshighereducation.co.uk/world-university-rankings/) reports of university world rankings, thus pointing to clear methodological differences and priorities. Importantly, the latter analyses focus on quality through impact of research and citations as opposed to simply efficiency via per capita output. CHET's main variables were postgraduate enrolments, doctoral enrolments and throughputs and research outputs. Our study has added a new dimension with regard to differentiation - that of equity (and equity through quality). This approach has led to four distinct groupings (with one additional central 'cluster'). This new look at quality-driven equity brings a different perspective to the CHET clusters. In particular, in our analysis, Unisa does relatively well but falls into CHET's Cluster 3, while Rhodes does relatively poorly but falls into CHET's Cluster 1. If we focus on per capita research output, the positions are reversed and in line with the CHET analysis. Regardless of whether one focuses on the CHET clusters or our groupings, it is clear that, for transformation to advance and succeed, government has to address differentiation urgently: firstly, in the staff and student composition of institutions and, secondly, in their performance with respect to research productivity.
In terms of differentiation, not all universities have to be high-level knowledge producers, but if they are to contribute to development they at least have to provide a quality undergraduate education and improve their very poor throughput rates. It does not help that they take in the 'disadvantaged' and then do not add value to their skills and certification. It may become necessary for government to set knowledge production targets or set this group on a different mission/trajectory to contribute to national development. On the other hand, the high-level knowledge producers with poor EIs need to be set equity targets, which could be rather complex but customised. For example UCT, US and UP with their poor equity scores produce a large proportion of African women doctorates. US, with the worst EIs, produces the most female (mainly White) doctorates in the country.26 However, judging by these poor EIs, the university sector still has a long way to go in resolving the twin challenges of equity and quality.
Almost 20 years post freedom, the EIs for students and staff in the higher education sector show that transformation is not only painfully slow1 but also embarrassingly so. Being left to self-regulate, the sector has been found to be wanting. It is an open question as to whether this self-regulation (in the guise of autonomy) should be allowed to continue or should be reviewed. Given the vast investment in higher education since 1994 (over R236 billion27 up to and including 2013), the equity returns need to be interrogated. This study shows that it is difficult to transform 'privilege' voluntarily and suggests that extraordinary measures are needed.
The question remains as to the reasons behind this slow progress: Is it passive resistance or a denial of failure by the sector? Is it the abuse of autonomy or an abhorrence of accountability by the sector? Has government failed to provide clear unambiguous steering or monitoring mechanisms or has it been cowed by the voice of the 'privileged' at the expense of the voice of the disadvantaged majority, shying away from doing that which is commonsense in a democracy? Or is it another intrinsic problem inherent or integral to higher education such as conservatism? Such questions should frame the debate around the future of transformation in higher education.
In their acclaimed book, Altbach and Salmi28 make the point that meaningful higher education changes can be effected in one of three ways: establishing new institutions, merging existing institutions and investing in new facilities and infrastructure. They further note that it is much harder to transform existing institutions. In South Africa, we have modest experience in mergers, no experience in creating new institutions and lessons still to learn from the experience of government's investment in infrastructure funding. We are slowly coming to the rude awakening that transforming our existing universities, as the findings of this study show, is indeed very difficult. In light of this, is there a need to consider facilitated partnerships or alliances between universities, possibly through a nationally driven framework, to accelerate the pace of equity and improved high-level knowledge production and ultimately transformation?
Our study has given a snapshot of the state of demographic transformation in the 23 universities in South Africa for 2011. Almost 20 years post democracy, it is clear that the situation is far from ideal. The much-lauded autonomy afforded to this sector has clearly not been used to effectively transform itself. Our EI can be used to drive transformation in the sector in a meaningful manner. It can be used in enrolment planning to ensure that the correct profile of students is selected from across the country. The EI of graduating students can also help universities focus their student academic support initiatives appropriately. On a national level, improvements in EIs can be included in the funding framework. This inclusion can be in two ways: firstly, by simply funding an improvement in student (enrolment and graduation) and staff EIs; and secondly, by funding equity-weighted productivity as opposed to simply total productivity. The latter driver can be a particularly effective incentive to encourage and reward transformation through quality.
We have also embarked upon a number of additional studies. These include looking at the trends in demographic transformation for this sector over time.29 In addition, we are focusing on EIs in senates, the highest academic decision-making bodies, and councils, the ultimate custodians of governance, strategy and transformation,30 and are examining the relationship between government investment and the return on equity transformation.
The EI adds, just like the CHET knowledge producing clusters,25 a new and improved dimension to the profile and differentiation of the South African higher education landscape, and may become an important policy tool in steering the system towards a notion of transformation that connects, rather than disconnects, equity and development. Just as is the case with the CHET clusters, the system should engage with and decide upon important constituents (indicators) of the different indices.
Finally, we note that the university sector is only one of many sectors in South African society undergoing or claiming to be 'transforming'. It would be instructive to use this simple formula to study and analyse EIs for the various sectors to determine which sectors are truly 'transforming', where they are in relation to the tolerance levels and to each other and what lessons can be learned from this comparative analysis for future policy review. This would be an important study for the country.
Acknowledgements
We thank the anonymous reviewers for helpful comments that led to improvements in the manuscript. We also thank Professor Ian Bunting and Dr Nico Cloete (CHET) as well as Professor Mark Bunting (Rhodes) for detailed comments on earlier versions. K.S.G. and N.P.Z. thank the National Research Foundation of South Africa and UKZN for ongoing support. This work could not have been completed and refined without the co-operation of Mr Chief Mabizela and his staff at the Department of Higher Education and Training as well as Mr Pali Lehohla and his staff at StatsSA.
Authors' contributions
K.S.G. conceived the index; K.S.G. and N.PZ. performed the calculations; M.W.M. collected the data; and K.S.G. and M.W.M. analysed and interpreted the data. K.S.G. and M.W.M. wrote the paper with comments from N.P.Z.
References
1. Soudien C, Michaels W, Mthembi-Mahanyele S, Nkomo M, Nyanda G, Nyoka N, et al. Report of the Ministerial Committee on Transformation and Social Cohesion and the Elimination of Discrimination in Public Higher Education Institutions. Pretoria: Department of Education; 2008. [ Links ]
2. Cloete N, Moja T. Transformation tension in higher education: Equity, efficiency and development. Soc Res. 2005;72(3):693-722. [ Links ]
3. Department of Education. The Education White Paper 3: Programme for the transformation of higher education [document on the Internet]. c1997 [cited 2013 May 28]. Available from: http://www.education.gov.za/LinkClick.aspx?fileticket=jc97Bom2utk%3d&tabid=191&mid=484 [ Links ]
4. Bunting I, Cloete N. Developing performance indicators for higher education. A South African case study [homepage on the Internet]. c2004 [cited 2013 May 28]. Available from: http://www.chet.org.za/performance.html [ Links ]
5. Department of Higher Education. The restructuring of the higher education system in South Africa. Report of the National Working Committee to the Minister of Education [document on the Internet]. c2002 [cited 2013 May 28]. Available from: http://www.info.gov.za/view/DownloadFileAction?id=70286 [ Links ]
6. Govinder K, Makgoba MW. An Equity Index for South Africa. S Afr J Sci. 2013;109(5/6), Art. #a0020, 2 pages. http://dx.doi.org/10.1590/sajs.2013/a0020 [ Links ]
7. Soanes C, Stevenson A, editors. New Oxford dictionary of English. 2nd ed. Oxford: Oxford University Press; 2003. [ Links ]
8. Charlton R. Emerging national perspectives. UDUSA National Conference; 1992 July 01-03; Durban, South Africa. [ Links ]
9. Moulder J. The predominantly white universities: Some ideas for a debate. In: Jansen J, editor. Knowledge and power in South Africa. Johannesburg: Skotaville; 1992. [ Links ]
10. Saunders SJ. Access to and quality in higher education: A comparative study. Cape Town: University of Cape Town; 1992. [ Links ]
11. Steele J. Post-secondary education - Bunting criticized. Academic Standard. 1992;1(7):8-9. [ Links ]
12. Van Onselen C. Tertiary education in a democratic South Africa. 1991 (Unpublished mimeo). [ Links ]
13. Badat S, Barends Z, Wolpe H. The post secondary education system: Towards policy formulation for equality and development. In: Kaplan B, editor. Changes by degrees: Equity issues in South African tertiary education. Cape Town: UCT Press; 1994. [ Links ]
14. Vithal R. Comments at launch of the UKZN Transformation Charter. Durban; 2012 October 02 (Unpublished). [ Links ]
15. UKZN Corporate Relations. There is nothing average about our transformation averages. Sunday Times. 2012 October 21;14. [ Links ]
16. Statistics South Africa. The 2011 census data [document on the Internet]. c2012 [cited 2013 May 28]. Available from: https://www.statssa.gov.za/Publications/P03014/P030142011.pdf [ Links ]
17. Department of Higher Education and Training. HEMIS database (accessed 2013 May). [ Links ]
18. Department of Higher Education and Training. 2011 Weighted research output. Pretoria: Department of Higher Education and Training; 2012. [ Links ]
19. UKZN senate report analysis of research productivity at UKZN for the period 2004-2008. UKZN; 2010 (Unpublished report). [ Links ]
20. Cheng Y Wu Y The statistical analysis of world-class universities. Proceedings of the Fourth International Conference on World-Class Universities; 2011 October 30-November 02; Shanghai, China [document on the Internet]. c2011 [cited 2013 May 28]. Available from: http://www.shanghairanking.com/wcu/wcu4/20.pdf [ Links ]
21. Department of Labour. Employment Equity Act (55/1998): General Administrative Regulations. Government Gazette. 2009;529(32393):4-37. [ Links ]
22. National Planning Commission. NDP 2030 - Our future - Make it work. Pretoria: Department of the Presidency; 2012. Available from: http://www.npconline.co.za [ Links ]
23. Council on Higher Education. South African higher education in the first decade of democracy [document on the Internet]. c2004 [cited 2013 May 28]. Available from: http://www.che.ac.za/documents/d000081/ [ Links ]
24. Financial and Fiscal Commission. 2013/14 Submission for the division of revenue [document on the Internet]. c2012 [cited 2013 May 28]. Available from http://www.ffc.co.za/index.php/submissions/commission-submissions/submission-chapters [ Links ]
25. Centre for Higher Education Transformation. Differentiation [document on internet]. c2012 [cited 2013 May 28]. Available from: http://www.chet.org.za/research-areas/differentiation [ Links ]
26. Habib A. Managing higher education institutions in contemporary South Africa: Advancing progressive agendas in a neo-liberal and technicist world. CODESRIA Bulletin. 2011;3/4: 5-9. [ Links ]
27. Department of Higher Education and Training. 2010 External report: Information on the state budget for universities [document on the Internet]. c2010 [cited 2013 May 28]. Available from: http://www.dhet.gov.za/LinkClick.aspx?fileticket=8hcz3EbLM6A%3d&tabid=411 [ Links ]
28. Altbach PG, Salmi J. The road to academic excellence: The making of world class research universities. Washington DC: World Bank; 2011. [ Links ]
29. Govinder KS, Zondo NP Makgoba WM. Transformation in South African higher education: 2007-2011. (Unpublished). [ Links ]
30. Zondo NP, Makgoba WM, Govinder KS. Equity indices for councils and senates of South African universities. (Unpublished). [ Links ]
 Correspondence:
Kesh Govinder
School of Mathematics, Statistics and Computer Science
University of KwaZulu-Natal
Private Bag X54001,
Durban 4000, South Africa
Email: Govinder@ukzn.ac.za
Received: 28 May 2013
Revised: 06 Sep. 2013
Accepted: 09 Sep. 2013

