


Services on Demand
Article
 English (pdf)
 Article in xml format
 Article references
Indicators

Related links
-
 Cited by Google
 -
 Similars in Google
Share

 Permalink
South African Journal of Science
On-line version ISSN 1996-7489
Print version ISSN 0038-2353
S. Afr. j. sci. vol.109 n.11-12 Pretoria Jan. 2013
RESEARCH ARTICLES
Improved decision-making on irrigation farming in arid zones using a system dynamics model
Martin de WitI, II; Douglas J. CrookesIII
IDe Wit Sustainable Options, Cape Town, South Africa
IISchool of Public Leadership, Faculty of Economic and Management Sciences, Stellenbosch University, Stellenbosch, South Africa
IIIIndependent researcher, Somerset West, South Africa
ABSTRACT
The Sandveld region in the Western Cape is a low rainfall area dominated by agricultural production using groundwater resources. The rise in agricultural production in the Sandveld has led to questions regarding the region's ecological sustainability. We developed a system dynamics model for the Sandveld system which captures land-use change, agricultural production, and groundwater abstraction and recharge. Using this model, we find little evidence that pressures on livelihoods result, either currently or in the immediate future, from ecological feedback effects. The model does indicate that the highest risks are associated with the financial viability of agriculture, in its present form, in the region. With lower margins, a drive towards economies of scale in agricultural production is more likely in the future. This process has had severe implications in some sectors already, with a 39% decrease in the number of potato producers in the Sandveld region between 2003 and 2009. These results highlight that an integrated approach to agricultural, economic and environmental management and planning is needed to capture the economic and ecological complexity and dynamics of the Sandveld system.
Keywords: system dynamics; agriculture; groundwater; economics; Sandveld
Introduction
Irrigation forms the foundation of farming and food security in arid zones and has been practised for many centuries. With the advance of irrigation science, the relationships among irrigation, climate, soils, plants and humans became better known and the desire to 'control ... the forces and materials of nature' arose.1 Over time, the biophysical and economical limits to irrigation became more evident,2 necessitating a focus on minimising the environmental impacts of irrigation.3 These impacts include waterlogging, salinisation and the over-abstraction of aquifers resulting in the degradation of groundwater resources and loss of associated ecosystem services.4-6 Harris7 argued that a balance needs to be maintained between yield requirements and ecological constraints within a particular region. In this article, we argue that financial limits pose another serious, often overlooked, dynamic to regional irrigated agro-ecological systems. This limit, under certain conditions, can threaten rural livelihoods long before ecological limits start affecting agricultural production.
The Sandveld is an area on the arid west coast of South Africa in which irrigation farming is practised intensively and which is highly sensitive to ecological constraints. The main ecological constraints are (1) the pressure on and availability of (ground-) water resources, (2) the pressure on natural habitats from land transformation and (3) the pressure of climatic changes.8,9 Further development of the Sandveld region is of great concern to the authorities and warranted a ministerial visit in March 2006. This visit culminated in a Sandveld Action Plan10, to be followed by an Environmental Management Framework for the region.
The local economy and ecology of the Sandveld region are closely connected. Most economic activity and livelihoods in the region are based on agriculture, most notably potatoes, but also rooibos, vineyards and citrus cultivation. Indications from international literature are that potato yields do not respond well to deficit irrigation methods,11,12 although there may be variance in results across different parts of the world. The perceived rising impact of agriculture on the region's ecological systems has led to concerns regarding the region's ecological sustainability. These concerns are driven by the belief that continued economic development through the expansion of agriculture, and the associated pressures on the ecosystem, may eventually lead to a collapse of the ecosystem and livelihoods in the region. Here we argue that agricultural livelihoods are not influenced only by the local ecology, but also by external market forces impacting on prices and input costs. Commercial farmers have a profit motive which drives the decision to expand or contract farming operations. Over and above ecological constraints, such financial constraints need to be brought into consideration when planning for sustainable livelihoods in the Sandveld region.
What is not known, however, is how and when financial and/or ecological constraints will start to have an impact on farming activities in the Sandveld region and how such constraints will affect future agricultural development paths, water use, land use and ecosystems. There is a need to identify trends and simulate alternative futures. This identification, in turn, can better support decision-making on farming livelihoods, land use and water resources in the region.
Information on likely futures for the Sandveld region was lacking and several key questions remained. For example: Is climate change a constraint on groundwater resources? Is abstraction by irrigated agriculture likely to lead to a collapse of groundwater resources? What is the effect of the economic recession on agricultural production and how has this affected land use? Which constraints are likely to become important first?
There are several techniques available to explore the future. Simulation modelling, the approach chosen for this study, is one of them. The objective of simulation models, and all other futuring methods, is 'not to predict the future, but to improve it'13. The idea is to 'anticipate possible or likely future conditions so that we can prepare for them'13.
The Sandveld study area
The Sandveld region is framed by the Atlantic Ocean on its west side and the foothills of the Olifants River Mountains on its east side. The Berg River and Lambert's Bay are its southern and northern boundaries, respectively. The region is an area of intensive potato and rooibos farming, reliant mostly on groundwater and sensitive to climatic changes, within an area of endangered and critically endangered biodiversity.14
The primary economic activities in the area are potato farming and rooibos cultivation. Agriculture is the dominant employer in the broader Greater Cedarberg Corridor, accounting for 71% of formal jobs in rural areas. It was previously estimated that in the Sandveld region alone, potato production represents an annual turnover of approximately R400 million and creates 3250 jobs for the local population.15 Updated estimates indicate that, in real terms and assuming a yield of 40 t/ha, the turnover of the potato industry in the Sandveld region was an annual R500-R700 million over the last 12 years.16
Methodology
System dynamics modelling
System dynamics modelling is a simulation modelling technique used for analysing complex problems. It was originally developed by Jay Forrester at the Massachusetts Institute of Technology for industrial problems, but is now widely used in social, technological, environmental and agricultural systems. A system is a combination of two or more elements interconnected for a particular purpose.17 An example of a system is the interrelationships between agriculture, water and land use. A complex system is one in which small parameter changes can potentially have large impacts on the dynamic behaviour of the system. System models are used to analyse complex systems and can either be qualitative models or quantitative models. The system dynamics modelling methodology is a quantitative modelling approach. System dynamics is defined by Coyle as 'a method for analysing problems in which time is an important factor, and which involve the study of how a system can be defended against, or made to benefit from, the shocks which fall upon it from the outside world'18. The approach is characterised by complex relationships between elements that result in non-linear feedbacks and the dynamic behaviour of the system. Complexity requires19:
• an understanding of the system as a whole and not just part of it,
• a modelling approach that is able to take into account non-linearities in the interactions between the parameters and feedback loops,
• models that take into account stock variables as well as flow variables.
The Sandveld system has a number of different agents or users (including rooibos, vineyard and potato farmers, as well as users of environmental services). A holistic approach that takes into account the complexity of the system provides at least two benefits. First, it enables better long-term decision-making in the best interest of all the users in the system. Second, it enables multiple interactions to be studied simultaneously. This benefit enables the potential to reveal behaviour in the system that would not have been identified if only one component of the system was studied in isolation from the others (see Sterman19 for further elaboration on the advantages of modelling that takes complexity into account). While other approaches can address problems such as linear programming and multi-market models, it can be argued that system dynamics modelling is the better approach to model the complex interactions between components in this instance.
System dynamics has been widely used for environmental modelling.20 Applications that included an irrigation component are those of Xu et al.21 in China; Elmahdi et al.22 in Australia, and Jogo and Hassan23 in South Africa. In some respects, our model is similar to Jogo and Hassan's23 model for the Limpopo River Basin. In both cases, irrigation abstraction affects groundwater levels, although in Jogo and Hassan's model, crop and livestock systems abstract water from the wetland system, while our model does not include a separate livestock sub-model but there is a greater degree of variation in crop varieties. (A dryland land use is included in our model but the water abstraction component does not affect groundwater levels.)
There are a number of platforms that may be used for system dynamics modelling. Examples include STELLA, DYNAMO, iTHINK and Powersim. The software we used in this study is Vensim, developed by Ventana Systems. This software is widely used for industrial, business and environmental applications.
Steps in the modelling process
The main steps of system dynamics modelling and how these were followed are:
1. Model conceptualisation - the model and subcomponents are described and discussed; time frame and units are also elaborated on.
2. Model quantification - the important empirical relationships underpinning the model are developed.
3. Model evaluation - model validation (sensitivity analysis) is conducted on key parameters in the model.
4. Model experiments and simulations - three simulations are run exploring the effects of climate change and other variables on the model.
5. Improving system performance (case analysis) - revisits some of the key assumptions of the model and makes recommendations on the way forward.
Data
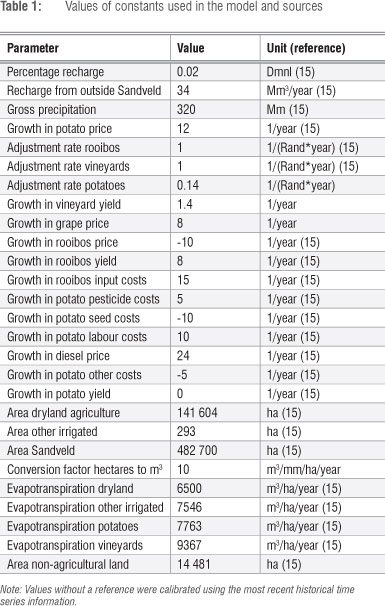
Economic data for potatoes and rooibos were derived from farming enterprise budgets24, and land-use characteristics and change were obtained from remote sensing data25. Additional agricultural data for potatoes were obtained from Potatoes SA, while additional agricultural data for vineyards were obtained from the South African Wine Information Service and the Department of Agriculture, Forestry and Fisheries.26 Evapotranspiration data for potatoes and grapes were obtained using the results of a surface energy balance (SEBAL) model.27 A summary of the values of constants used in the model is given in Table 1.
Model conceptualisation
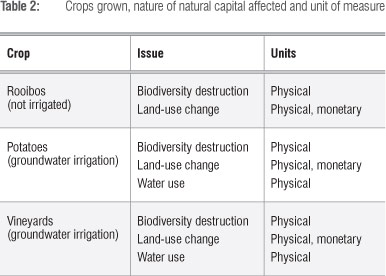
This study comprised three elements: (1) a natural capital separation (land, water), (2) a separation between physical and monetary aspects, and (3) a separation into various agricultural activities. The relationship between these elements is summarised in Table 2.
The time frame of the model is from 2006 until 2030, a period of 24 years. The reason for the relatively short time frame is to achieve a balance between replicating historical data as well as simulating future trends. A long time frame would introduce too much uncertainty into the model. Furthermore, the focus of this study was on the medium term, as the system is an example of an acute problem necessitating possible short- to medium-term interventions. The value of the model is not in its forecasting ability, but rather in indicating the factors that cause the dynamics of the model in the short- to medium-term. The time step of the model is 1 year, given that most agricultural data is only available on an annual basis. We chose 2006 as the base year to take advantage of recently available evapotranspiration data. The scale of the model is the Sandveld region as per the Department of Water Affairs (DWA) classification (G30A-H quaternary catchments), an area of 4827 km2.
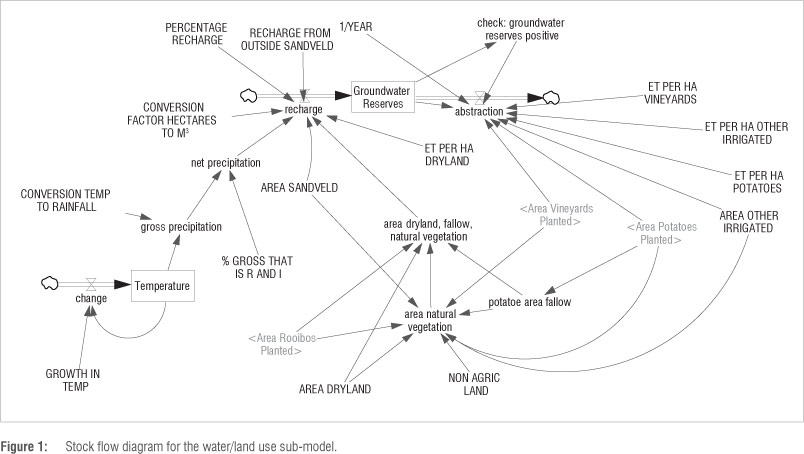
Five sub-models were developed: a water/land use sub-model, a potato sub-model (including a separate sub-model for input costs), a rooibos sub-model and a vineyard sub-model. The stock flow diagram for the water/land use sub-model, as one example, is given in Figure 1.
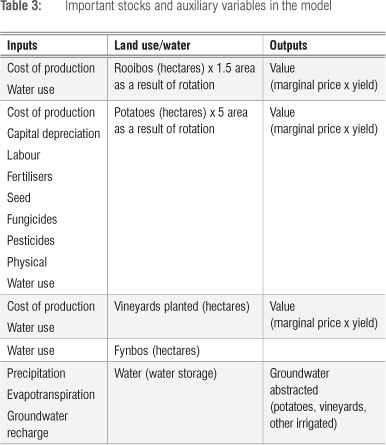
In system dynamics models, stocks are the reservoirs or stores of value, while flows measure rates of change over time. Auxiliary variables and constants are also features of these models. A summary of the most important stocks and auxiliary variables in the model are given in Table 3.
Components of the agricultural sub-model include production and costs and of the water sub-model are a land-use component driven by profits as well as the availability of water. Regression analyses were conducted on the key variables. Significant empirical relationships were found between temperature and precipitation and between profit and area planted. These empirical relationships are given later.
Model quantification
In the water and land use sub-model, we estimated the following relationship between temperature and precipitation:

where
Adj R2 = 0.41948 Model F = 867.3899 n = 1200 (period 1900 to 2000)
and T statistics are given in parentheses. All variables are significant at least at the 1% level.
This relationship indicates that an increase in temperature is associated with a decline in gross precipitation and conversely, a decrease in temperature is associated with an increase in precipitation. It should, however, be noted that this regression result is based on monthly data. When we aggregated the data to annual estimates we were unable to obtain a significant relationship between the variables. This difference suggests that most of the variations are of a short-term (cyclical) nature and not long-term (structural) nature. As economic data is only available on an annual basis, a solution is either to run the model with a shorter time step (e.g. monthly), or to divide the model into two time steps to distinguish between economic and biophysical data.28 But this is beyond the scope of the present study.
A second significant relationship is the rise in temperature over time:
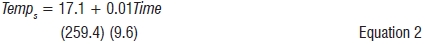
where
Adj R2 = 0.48 Model F = 9.30 n = 100 (period 1900 to 2000) and T statistics are given in parentheses. All variables are significant at least at the 1% level.
This relationship indicates that temperature rose, on average, by 0.06% {[(17.1+0.01)/17.1-1]*100} per annum over the 100-year period from 1900 to 2000.
An important aspect of the modelling effort is to explore the effects of climate change, as measured here through changes in temperature and precipitation, on groundwater resources.
The change in groundwater recharge is represented by the following relationship:
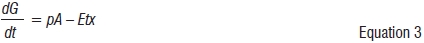
where p is the gross precipitation in a given year, A is the area, and ETx is the interception by natural vegetation and non-irrigated agriculture. Given the low rainfall in the area, the baseline assumption is that run-off is zero. This assumption is, however, easily modified in the context of the model.
The change in groundwater abstracted is given by:

where ETi is the evapotranspiration of potatoes, vineyards and other irrigated land, and Ai is the area planted for each of these crops.
The baseline recharge in 2006 was 65 Mm3/year. Abstraction is estimated at 51 Mm3/year of which 77% is potato irrigation, 19% is vineyard irrigation and 4% is other irrigation.28 In comparison, water use by the potato industry in the Sandveld region was estimated by Knight et al.29 at 46.9 Mm3/year. However, this figure was based on a larger area than the DWA-defined catchment areas used in this study.
It must be noted that abstraction is linked with land-use change in the model. It is assumed that recharge figures are those that actually reach the groundwater reserves and thus excluded interception by natural vegetation.
The dynamics of area planted are modelled as driven by changes in profits from agricultural production (potatoes, rooibos and viticulture). The change in area of crop type i planted is modelled as:

where εi is the elasticity of changes in area to changes in profit, Δprofiti is the change in area planted as a result of a change in profit (growth rate) and Δapj is the change in area planted for a given growth rate. Δap follows an s-shaped function for a given growth rate, which bounds area planted within the range of zero and a desired area. Based on historical information on land-use changes, the elasticity for potatoes and rooibos is estimated at 0.33, and for vineyards at 0.02.
A positive feedback loop exists between profit and area planted (Δ profit) via a lookup function. The mathematical representation of the lookup function is as follows:
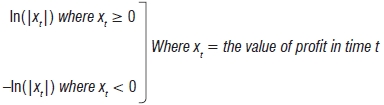
This lookup function is an example of a goal seeking function, which converges on 1 when profits are positive and increasing (within reasonable bounds), and converges on -1 when profits are negative and decreasing.
Natural vegetation is calculated as the difference between the total area available and area of dryland agriculture (livestock), vineyards, rooibos (grown and fallow), potatoes (grown and fallow), other irrigated agriculture, and non-agricultural land (urban areas).
Model evaluation
A sensitivity analysis was conducted on the key parameters in the model. By measuring extreme variations in product price, input costs and temperature, the impacts were measured on profits, natural vegetation and groundwater resources. The main purpose for conducting such a sensitivity analysis is to test the functional integrity of the system; in other words, whether the model operates within the bounds of realistic values for the parameters and also whether the dynamics of the system obey logical laws and relevant theory. For example, if input costs decrease or area planted increases one would expect profitability values to increase. For all reasonable values of the parameters, the model behaved in accordance with expectations.
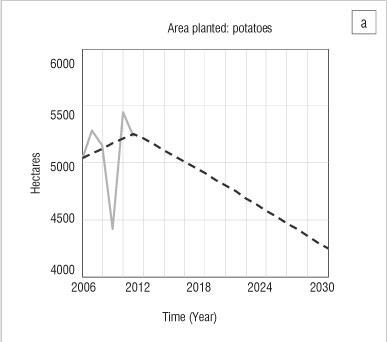
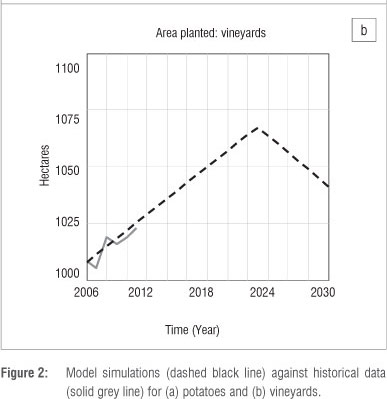
Furthermore, the agricultural economic values and land-use change data in the model were calibrated using historical data. Although historical data were not available for groundwater resources in the Sandveld region, this aspect of the model was validated using expert opinion, notably on the groundwater recharge component (Kennedy K 2011, personal communication, January 18). Earlier estimates of groundwater recharge of 234 Mm3/year based on Knight et al.29, were subsequently revised to 65 Mm3/year. Further, the model calibration outputs for land-use change indicate that it was difficult to capture short-term fluctuations in the area of potatoes planted (Figure 2a), although a better fit was obtained for changes in vineyard area (Figure 2b). The model simulations indicate that the area of potatoes planted increases and then declines. The reason for the decline in the area of potatoes planted is that profits in the simulation drop to zero. As zero profits persist, more and more farmers cease production and the area of potatoes planted continues to decline over time. However, if positive profits are restored, the area of potatoes planted increases. This is a standard approach to model the economic theory of natural resource utilisation.30
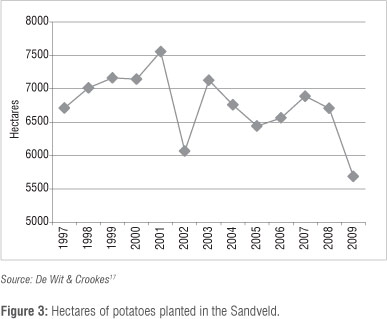
Historical data from the Sandveld region on the number of hectares of potatoes planted also indicates a long-term declining trend.16 The area of potatoes planted reached a high of 7500 ha in 2001, after which it declined to 5700 ha in 2009 (Figure 3).
Given the large variation in the area of potatoes planted, a sensitivity analysis was conducted on this outcome by allowing positive profits and consequently an increase in area of potatoes planted over the timeline of the model (see Simulation 3 below).
The high degree of variability in the area of potatoes planted makes replication of the system in the short term difficult. There are evidently short-term dynamics affecting changes in the area of potatoes planted other than simple profitability parameters. Some of these dynamics are likely to come from outside the Sandveld system, such as potatoes' market prices.16 Our regional Sandveld model is therefore crude and further work is required to better understand the short-term dynamics of the system. It is furthermore important to note that the model was developed shortly after the recession of 2008-2009, which severely affected potato production. Total national potato production has recovered since then, and the Bureau for Food and Agricultural Policy31 expects that Sandveld region's area of potatoes planted will increase gradually or at least remain fairly stable between 2012 and 2021. A preliminary estimate of the adjusted area of potatoes planted, based on Potatoes SA data, seems to support this. The area of potatoes planted was about 5400 ha for Sandveld in 2012 - an increase from 2011, but still well within the long-term declining trend observed in Figure 2. It is, therefore, important to understand the effects of both a recessionary scenario (Simulation 1 below) and a profit recovery scenario (Simulation 3 below).
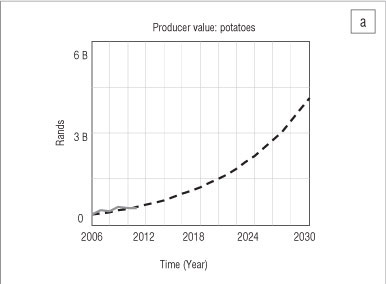
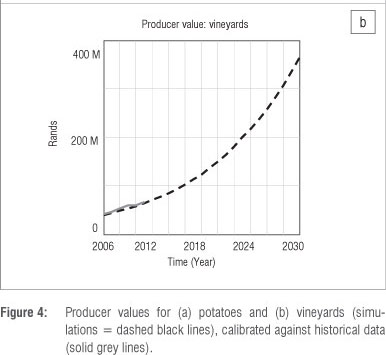
Figure 4a is a plot of the simulated producer value (gross profit before deduction of input costs) of potatoes against historical data, and Figure 4b a plot of producer value for vineyards. The model simulations trend well with historical data and indicate that producer values of these commodities are growing over time. The important driver for profitability in the model is changes in input costs (such as fertiliser costs), which are driven by changes in the fuel price, labour costs and other input costs such as seed and pesticide costs. Although long-term historical data for input costs are not available, we hypothesise that these will be the major drivers of profitability in the agriculture sector in the Sandveld region.
Results
Simulation 1: A long-term decline in precipitation
For Simulation 1, we modelled the effects of climate change (temperature increases) on trends in precipitation. The model was calibrated so that precipitation was 402 mm, which is the 2005/2006 value for gross precipitation reported in Jarmain14. In the model, precipitation declines linearly with increases in temperature, and agricultural production trends persist based on historical data. Groundwater reserves increase steadily over the period of the sample while profitability constraints are reached first: profitability of potatoes increases then declines under the baseline, profitability of rooibos declines more gradually and the profitability of vineyards increases and then declines in the baseline simulation (Figure 5).
However, plotting the model precipitation against the historical data indicated that while the range is good, the historical data do not support a downward trend in precipitation. Furthermore, actual precipitation is more variable. Summary statistics suggest that this data has a mean of 320 mm and a standard deviation of 70 mm. In the next section, we run Monte Carlo simulations on the precipitation data in order to assess how these affect agricultural production and groundwater reserves.
Simulation 2: Monte Carlo simulations on precipitation
In these simulations we eliminate the temperature sub-model altogether and run Monte Carlo simulations directly on precipitation. Precipitation was assumed to follow a normal (320,70) distribution, as per the descriptive statistics based on the historical data. Conrad et al.9 reported figures for groundwater recharge in the Sandveld region of between 0.2% and 3.4%. Consequently, a mean groundwater recharge of 2% per annum is assumed - sensitivity analysis using the 0.2% and 3.4% recharge produced results consistent with the 2% outcome.
Recharge within the Sandveld region is simulated at 2% of net precipitation and recharge from outside the Sandveld region as 34 Mm3/a. The resulting sensitivity plot for groundwater reserves is shown in Figure 6.
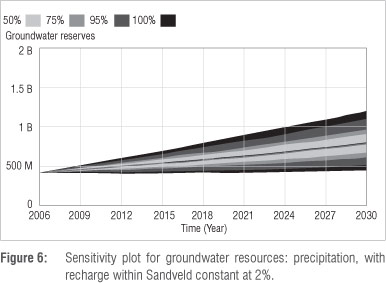
It is evident from this plot that the majority (75%) of simulation outcomes fall within the band of 650 Mm3 to approximately 950 Mm3.
The results suggest that groundwater reserves are expected to recover, even under variable precipitation. Agricultural production, on the other hand, continues to show a declining trend as was the case in the first simulation.
Monte Carlo simulations on the base case scenario indicate that groundwater reserves either remain relatively constant or increase over the time frame of the model. Further simulations indicate that the lower the groundwater recharge percentage used from within the Sandveld region, the more likely groundwater reserves are to recover and the narrower the band of uncertainty. This result is because in the model, with the exception of the first simulation where uncertainty was modelled on both net precipitation and recharge outside the Sandveld region, the greater assurance of supply comes from outside the Sandveld region. These results emphasise the need for better hydrological data on the source and the amount of recharge before final conclusions can be drawn.
Simulation 3: Positive profits
The previous simulations assumed baseline profitability parameters -in other words, that the impact of the recession will drive agricultural profits downwards. No depletion of groundwater resources are predicted under this scenario. It is now important to test the case that recessions do not last forever and that there may be a future impact of positive and growing profits in the irrigation agricultural sector on groundwater resources. For a start, we optimistically assume that vineyard profits grow at pre-recession rates (growth in yield = 1.4%, growth in price = 8%, growth in input costs = 8%), and that the diesel price remains stable. These assumptions result in positive and increasing profits for both vineyard and potato production.
In this simulation, precipitation follows the same normal (320,70) distribution and 2% recharge from precipitation within the Sandveld region as was assumed in the previous simulation. After 200 realisations, the sensitivity plot shown in Figure 7 was obtained.
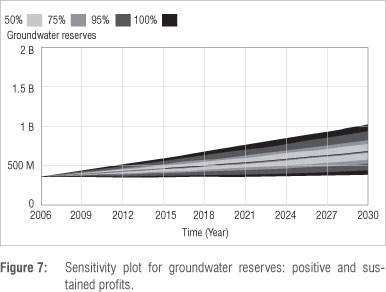
Although positive, sustained profits do show reduced groundwater reserves for some of the low rainfall scenarios. The majority of simulations show an increased or stable groundwater reserve over the time frame of the model (25 years). Low and sustained rainfall may result in a decrease in groundwater reserves to approximately 350 Mm3 but this outcome only occurs in less than 5% of the simulations. The mean value (black line in the figure) shows an increase in groundwater reserves over the time frame of the model.
Improving system performance
A system dynamics model is necessarily an abstraction of reality and a number of areas may be suggested for model improvement. First, it is important to note that the current model only considers the dynamics of potato and vineyard production. All other water abstractors such as urban users, citrus and other irrigators are held constant and could impact on groundwater system recovery. Second, our model indicates that losses in natural vegetation cover are secondary to the groundwater constraint. However, this assumption does not take into consideration the drivers of the dynamics of dryland agriculture, which are likely to have a small impact on groundwater resources but could potentially have a large impact on land use. Third, the link between biodiversity, ecosystem services and land use is an important aspect that requires further work. This aspect was not addressed in the current study owing to the lack of available data. Fourth, the system dynamics model is for the entire Sandveld area to inform broad trends and planning. The model does not have a high spatial resolution and no conclusions on more specific, local dynamics can be made.
Discussion
Using the current reality as a starting point, we find little evidence that pressures on livelihoods result, now and in future, from ecological feedback effects in the first place. The model does, however, indicate that the highest risks are associated with the financial viability of agriculture, notably potato production in its present form, in the Sandveld region. Financial constraints are already placing a limit on agricultural development in the region, and most likely will continue to, even before ecological limits such as groundwater availability and climate change are expected to start reducing returns on agricultural production. Evidence of limits of production has already started to show, with a noticeable downward trend in the number of hectares cultivated for potatoes in the last decade while a relatively constant proportion of land in the Sandveld region is under agricultural production. Although real prices for potatoes are rising, there is recent evidence that real input costs are rising faster17 and putting pressure on net revenues, and thus the incentive for further agricultural development. With lower margins, a drive towards economies of scale in the production of potatoes is more likely in the future. This process is already underway with a 39% drop in the number of potato producers in the Sandveld region between 2003 and 2009.32
Given the baseline model and expectation of a struggling agricultural sector, and given the current understanding of the hydrology of the region, at no point over the time frame of the model up to 2030 is the depletion of the aquifer as a whole a serious possibility. It must be noted that for some quaternary catchments this result may differ, but without a dynamic model with higher spatial resolution and data sets on ecological and economic indicators at these levels, no firm conclusions can be made. When planning for the Sandveld region as a whole, the systemic risk to livelihoods in a declining agricultural sector mostly as a result of economic drivers is the most prevalent issue from a Sandveld ecological-economic systems point of view within the next decade.
These results are noteworthy not only for the planning and management of the Sandveld region, but also for the literature on how to frame a study on regional agro-ecological systems. The limits posed by land space and ecology in sensitive arid zones are well documented, but financial and broader economic limits to agricultural production are other important dynamics that need to be brought into account when attempting to better understand decision-making in agro-ecological systems. Our approach supports the assessments of sustainable agriculture from multiple ecological, social, financial and economic perspectives,33-35 but introduces an explicit temporal dimension to account for the dynamics of site-specific limits posed by land-use space, ecosystems, finance and broader economies, as well as the risks and uncertainties associated with these limits over time (see also Nobre et al.28 for another application of such an approach as applied to aquaculture farming). Further work is needed in integrating such an approach with more refined spatial assessments based on more spatially explicit modelling.36,37 It is anticipated that a conceptual framing of regional agro-ecological systems as proposed here would yield a more robust assessment of the timing and risks of multiple limits across more refined spatial scales within agro-ecological systems.
Conclusions
Although predictions cannot be made on exact time frames, or on spatial sensitivities owing to the limitations of the simulation modelling techniques used, a case is presented here for a study of the complex interactions between both financial and ecological constraints in agro-ecological systems to inform planning for irrigated farming in arid zones. This case departs from the more usual planning paradigm where socioeconomic and ecological dynamics are studied in isolation and used as separate inputs into the planning process or where such dynamics are studied in an integrated way but without explicit information on the anticipated timing of limits. Although limitations remain in using dynamic ecological-economic modelling approaches as presented in this paper, such a modelling approach does give a sense of proportion on the magnitude and timing of spatial, ecological and financial limits in relation to both natural and socio-economic variables.
Acknowledgements
This article is one result of the research project "Water Use Surveillance and Ecological Economic Modelling of Agro-Ecosystems in the Sandveld region, Western Cape", as managed by the CSIR. Funding by the Western Cape Department of Agriculture, the Department of Water Affairs and Forestry and the Cape Action Plan for People and the Environment (C.A.PE) is hereby gratefully acknowledged.
Authors' contributions
M.d.W. was research leader on the ecological-economic modelling work component of the project. D.C. was responsible for the modelling work. Both authors wrote the manuscript.
References
1. Israelsen OW. The foundation of permanent agriculture in arid regions. USU Faculty Honor Lectures. Paper 51. Logan, UT: Utah State Agricultural College; 1943. Available from: http://digitalcommons.usu.edu/honor_lectures/51 [ Links ]
2. Davidson BR. Australia wet or dry? The physical and economic limits to the expansion of irrigation. Melbourne: University of Melbourne; 1969. [ Links ]
3. Dougherty TC, Hall AW, Wallingford HR. Environmental impact assessment of irrigation and drainage projects. Irrigation and Drainage Paper 53. Rome: Food and Agriculture Organization of the United Nations; 1995. [ Links ]
4. Knüppe K, Pahl-Wostl C. Requirements for adaptive governance of groundwater ecosystem services: Insights from Sandveld (South Africa), Upper Guadiana (Spain) and Spree (Germany). Reg Environ Change. 2012;13(1):53-66. http://dx.doi.org/10.1007/s10113-012-0312-7 [ Links ]
5. Wada Y, Van Beek LPH, Van Kempen CM, Reckman JWTM, Vasak S, Bierkens MFP. Global depletion of groundwater resources. Geophys Res Lett. 2010;37:L20402. http://dx.doi.org/10.1029/2010GL044571 [ Links ]
6. Stockle CO. Environmental impact of irrigation: A review. Washington DC: Washington State University; 2002. [ Links ]
7. Harris JM. World agricultural futures: Regional sustainability and ecological limits. Ecol Econ. 1996;17(2):95-115. http://dx.doi.org/10.1016/0921-8009(96)00020-1 [ Links ]
8. Archer E, Conrad J, Münch Z, Opperman D, Tadross M, Venter J. Climate change, groundwater and intensive commercial farming in the semiarid northern Sandveld, South Africa. J Integr Environ Sci. 2009:6(2):139-155. http://dx.doi.org/10.1080/19438150902916589 [ Links ]
9. Conrad J, Nel J, Wentzel J. The challenges and implications of assessing groundwater recharge: A case study - northern Sandveld, Western Cape, South Africa. Water SA. 2007;30(5):75-81. http://dx.doi.org/10.4314/wsa.v30i5.5171 [ Links ]
10. Ranger S, Venter J, Burger J. The Sandveld Action Plan: "An Army of Champions". Northern Cape: Greater Cederberg Biodiversity Corridor Sandveld Task Team; 2006. [ Links ]
11. Shock CC, Feibert EBG, Saunders LD. Potato yield and quality response to deficit irrigation. HortScience. 1998:33(4):655-659. [ Links ]
12. Robbins JS, Domingo CE. Potato yield and tuber shape as affected by severe soil moisture deficits and plant spacing. Agron J. 1956;48(11):488-492. http://dx.doi.org/10.2134/agronj1956.00021962004800110003x [ Links ]
13. Cornish E. Futuring. The exploration of the future Bethesda. Bethesda, MD: World Future Society; 2005. [ Links ]
14. Jarmain C. Progress report: Water use surveillance and ecological economic modelling of agro-ecosystems in the Sandveld region, Western Cape. Stellenbosch: Natural Resources and the Environment, CSIR; 2010. [ Links ]
15. Van Zyl H. Sandveld resources economics study: Concept note. Draft report; 2007 (Unpublished). [ Links ]
16. De Wit MP, Crookes DJ. An ecological-economic systems model for the Sandveld. Consultancy report. Cape Town: De Wit Sustainable Options; 2011. [ Links ]
17. Ford A. Modelling the environment. Washington DC: Island Press; 1999. [ Links ]
18. Coyle RG. Management system dynamics. New York: John Wiley & Sons; 1977. [ Links ]
19. Sterman J. System dynamics modeling: Tools for learning in a complex world. Calif Manage Rev. 2001;43(4):8-25. http://dx.doi.org/10.2307/41166098 [ Links ]
20. Crookes D, Blignaut J, De Wit M, Esler K, Le Maitre D, Milton S, et al. System dynamic modelling to assess economic viability and risk trade-offs for ecological restoration in South Africa. J Environ Manage. 2013;120:138-147. http://dx.doi.org/10.1016/j.jenvman.2013.02.001 [ Links ]
21. Xu Z, Takeuchi K, Ishidaira H, Zhang X. Sustainability analysis for Yellow River water resources using the system dynamics approach. Water Resour Manag. 2002;16:239-261. http://dx.doi.org/10.1023/A:1020206826669 [ Links ]
22. Elmahdi A, Malano H, Khan S. Using a system dynamics approach to model sustainability indicators for irrigation systems in Australia. Nat Resour Model. 2006;19(4):465-481. http://dx.doi.org/10.1111/j.1939-7445.2006.tb00190.x [ Links ]
23. Jogo W, Hassan R. Balancing the use of wetlands for economic well-being and ecological security: The case of the Limpopo wetland in southern Africa. Ecol Econ. 2010;69:1569-1579. http://dx.doi.org/10.1016/j.ecolecon.2010.02.021 [ Links ]
24. De Lange W, Mahumari B. Derived monetary value of water as generated by commercial irrigated agriculture at the farm gate for a selection of commodities. Stellenbosch: Natural Resources and the Environment, CSIR; 2010. [ Links ]
25. Roberts W, Luck-Vogel M. Spatial representation of land use changes and potential biodiversity losses associated with land use changes. Stellenbosch: Natural Resources and the Environment, CSIR; 2010. [ Links ]
26. Department of Agriculture, Forestry and Fisheries (DAFF). Trends in the agricultural sector 2011. Pretoria: Directorate Agriculture information Services, DAFF; 2012. [ Links ]
27. Meijninger W, Voogt M. Spatial estimates of agricultural and ecological water use, biomass, yield production, and water use efficiency. Wageningen: WaterWatch; 2010. [ Links ]
28. Nobre A, Musango J, De Wit MP, Ferreira J. A dynamic ecological-economic modeling approach for aquaculture management. Ecol Econ. 2009;68:3007-3017. http://dx.doi.org/10.1016/j.ecolecon.2009.06.019 [ Links ]
29. Knight F, Conrad J, Helme N. Biodiversity best practice guidelines for potato production in the Sandveld. Consultancy report commissioned by CapeNature and Potatoes South Africa; 2007 (Unpublished). [ Links ]
30. Gordon H. The economic theory of a common-property resource: The fishery. J Polit Econ. 1954;62(2):124-142. http://dx.doi.org/10.1086/257497 [ Links ]
31. Bureau for Food and Agricultural Policy. BFAP baseline agricultural outlook 2012-2021. Stellenbosch/Pretoria: Stellenbosch University, University of Pretoria & Department of Agriculture; 2012. [ Links ]
32. Engelbrecht J. Voorsittersverlag van 2009 [Chairman's report for 2009]. Presented at: SAKO AGM; 2010 April 13; Velddrif, South Africa. Afrikaans. [ Links ]
33. Agrel PJ, Stam A, Fischer GW. Interactive multiobjective agro-ecological land use planning: The Bungoma region in Kenya. Eur J Oper Res. 2004:54(1):194-217. http://dx.doi.org/10.1016/S0377-2217(03)00355-2 [ Links ]
34. Rasul G, Thapa GB. Sustainability of ecological and conventional agricultural systems in Bangladesh: An assessment based on environmental, economic and social perspectives. Agric Sys. 2004:79(3):327-351. http://dx.doi.org/10.1016/S0308-521X(03)00090-8 [ Links ]
35. Dalsgaard JPT, Lightfoot C, Christensen V. Towards quantification of ecological sustainability in farming systems analysis. Ecol Eng. 1995:4(3):181-189. http://dx.doi.org/10.1016/0925-8574(94)00057-C [ Links ]
36. Costanza R, Voinov A, Boumans R, Maxwell T, Villa F, Wainger L, et al. Integrated ecological economic modeling of the Patuxent River watershed, Maryland. Ecol Monogr. 2002;72:203-231. http://dx.doi.org/10.1890/0012-9615(2002)072[0203:IEEMOT]2.0.CO;2 [ Links ]
37. Veldkamp A, Kok K, De Koning GJH, Schoorl JM, Sonneveld MPW, Verburg PH. Multi-scale system approaches in agronomic research at the landscape level. Soil Till Res. 2001;58(3-4):129-140. http://dx.doi.org/10.1016/S0167-1987(00)00163-X [ Links ]
 Correspondence:
Martin de Wit
De Wit Sustainable Options
PO Box 546
Brackenfell 7561 South Africa
Email: martin@sustainableoptions.co.za
Received: 19 Jun. 2013
Accepted: 25 Aug. 2013

