


Services on Demand
Article
 English (pdf)
 Article in xml format
 Article references
Indicators

Related links
-
 Cited by Google
 -
 Similars in Google
Share

 Permalink
South African Journal of Science
On-line version ISSN 1996-7489
Print version ISSN 0038-2353
S. Afr. j. sci. vol.109 n.11-12 Pretoria Jan. 2013
RESEARCH ARTICLES
Prediction of soil distribution on two soilscapes in land type Dc17 east of Bloemfontein, South Africa
Mussie G. Zerizghy; Pieter Le Roux; Malcolm Hensley; Leon D. van Rensburg
Department of Soil, Crop and Climate Sciences, University of the Free State, Bloemfontein, South Africa
ABSTRACT
The predictive nature of digital soil mapping makes it a labour- and cost-effective way of facilitating soil surveys. A digital elevation model was used to generate terrain attributes that can be used to infer the distribution of soil associations relative to the topography. Two study areas - Gladstone and Potsane -in the Free State Province of South Africa were considered. Slope, aspect, contour and plan curvature, topographic wetness index and topographic morphological unit were used to develop a model for predicting soil associations. Discriminant analysis was employed to develop the model. The model was trained on data obtained from Gladstone and validated on data from Gladstone and Potsane. Predicting soil form was unsatisfactory. Prediction done on soil associations, with soils grouped as deep, shallow and valley-bottom soils (criteria closely related to the suitability for in-field rainwater harvesting), achieved acceptable improvement in prediction accuracy. For Gladstone, when analysis was done using equal prior probability, accuracy percentages of 56.9%, 51.5% and 58.3% were found for calibration, cross-validation and areas suited to in-field rainwater harvesting, respectively. With prior probability set in accordance to sample frequency, the accuracy percentages were improved to 83.1%, 80.0% and 94.6%, respectively. In Potsane, the prediction accuracy percentage was low (38.23%) with equal prior probability but markedly improved (67.65%) when prior probability was similar to sample frequency. These results support the validity of the statement that the predictive nature of digital soil mapping makes it a labour- and cost-effective way of facilitating soil surveys.
Keywords: predictive soil mapping; soil survey; discriminant analysis; Gladstone; Potsane
Introduction
Predictive soil mapping (PSM), as part of digital soil mapping, is an important contribution to soil surveying. In practice, PSM is associated with digital soil mapping which is geared towards producing digital maps of soil types and soil properties. This procedure relies heavily on computer support and different software applications to process the observations (data) that are used as a basis of inference. As this procedure is still in its infancy, no formal delineation of scope is available, but definitions have nevertheless been given by practitioners. Scull1 defined PSM as 'the development of a numerical or statistical model of the relationships among environmental variables and soil properties, which is then applied to a geographic database to create a predictive map'.
A critical review of conventional soil surveying reveals that it is often more costly and labour and time consuming than it need be.2 Webster3 suggested that, where observations are excessively expensive and time consuming, more easily observed characteristics and cheaper means of making observations should be devised. PSM uses proxy and ancillary information to infer soil classes, properties and distribution in the landscape, which decreases costs. In addition, PSM uses variables that can easily be quantitatively measured, thereby allowing predictions to be done consistently and objectively. Another advantage of PSM is its role in facilitating soil mapping in contrast to the polygon delineations of traditional soil surveys. PSM uses geographical data types in which the surface of the study area is divided into small grids and the value allocated to every grid cell (pixel) can be individually recorded and depicted. PSM thereby also provides a means of controlling the resolution of the map produced.
The work that pioneered the use of digital applications based on pedological theory was done by Jenny4. He focused on the process of soil formation (pedogenesis), recognised the role of soil forming factors, and expressed this process in the form of mathematical equations (Equations 1 and 2). At the time, and for decades to follow, an acceptable way of quantifying the factors was not available. The equations nevertheless served as a pad for launching predictive soil mapping research. The important formulation done by Jenny4 not only described soil type as a function of the five soil forming factors (Equation 1), but also introduced the concept of single factor variation to observe the influence of a single factor in soil formation (Equation 2). For example, Equation 2 below shows soil variation as a function of climate. Jenny's concept provided the foundation for the assumption made in PSM.


where S represents the soil properties (type), cl is the climate, o is the organisms, r is the topography, p is the parent material and t is time.
The major assumption that stems from the above equations, which is reflected in most PSM models, is that soil pedosequences in a particular relatively small area tend to be similar. The underlying assumption is that in a relatively small area there is not sufficient variation in the soil forming factors (apart from topography) to bring about soil variation. This is presumably what Hudson5 refers to as the 'landscape paradigm', which plays such an important role in soil surveys.
Although Equation 1 represents the theory of soil formation explicitly, it is mathematically unsolvable.6 For this reason no remarkable advances were made soon after Jenny's publication in 1941.4 It was only during the 1960s that research in pedometrics started to expand.7 This development was fuelled by the introduction of new statistical techniques in soil science and spatial know-how. McBratney et al.8 noted that this shift to include spatial factors was necessitated for two reasons: a need to map the results and to quantify the factors in order to use Jenny's equations for prediction purposes.
Because of the difficulty of quantifying the soil forming factors, ways of modelling these factors became important. Among the five soil forming factors, direct measurement of climate and relief is relatively easy. Parent material can easily be expressed nominally or as a dummy variable (i.e. as absent or present). The influence of organisms and time are not easy to measure directly, but surrogate or proxy variables can be used to represent them. In cases where such quantification is very difficult, approximation by local experts who have good knowledge of the area can be used.9
As one of the objectives of PSM is to solve the difficulty of obtaining data during surveying, using readily available data sources is a valid option. To serve this objective, easily measured attributes like topographic, climatic and geological parameters have been used to model the relationship between these environmental attributes and the soil. Zhu et al.9 reported that the choice of environmental variables can be made depending on data availability and significance in impacting pedogenesis, which means that, amongst the available representative variables, the ones that provide ease of measurement and use are utilised to model. Such variables can then be used to model the relationship with the soil and as the basis for prediction.
Much of the work that has been done focused on modelling of variation in relief in relation to variation in soil. Scull et al.6 provided a list of research done on digital soil mapping. Among the listed studies, 15 of them used terrain attributes to model the relationship between the environment and the soil. Of those 15 studies, 8 used terrain attributes only. This wide use of terrain attributes to model the relationship between soils and their environment accentuates the significance of terrain attributes in explaining pedogenesis.
Crop soil suitability criteria, relevant to similar soils, should be related to local soil forming factors, of which topography is dominant. In this study, it was hypothesised that terrain attributes could be used to predict functionally similar soil distribution within a particular land type. Thus, the objective of this study was to predict the spatial distribution of functional soil associations within a selected soilscape of land type Dc17 (a land type in which duplex soils are dominant) with an acceptable level of accuracy. This predictive procedure can play a major role in land evaluation for dryland agriculture with well-defined soil requirements, for example in-field rainwater harvesting (IRWH).10,11 The need to improve the productivity of marginal cropland in South Africa, its importance with regard to subsistence farmers, and the value of IRWH for contributing to the solution of this problem, have recently been accentuated.12,13
Method
The study area is located in land type Dc17, in the Free State Province about 90 km east of Bloemfontein in the vicinity of Thaba Nchu.14 Within this land type two separate soilscapes were studied - Gladstone and Potsane. Data from Gladstone was used to develop, train and validate the developed model. Gladstone covers an area of 2721 ha, which is currently mainly used for grazing. Soil type data from Potsane were also used to validate the model. The area from which the validation data points were collected covers 140 ha of Potsane. As both areas are located in the same land type, they share the same macroclimate and macrogeology.
Soil survey
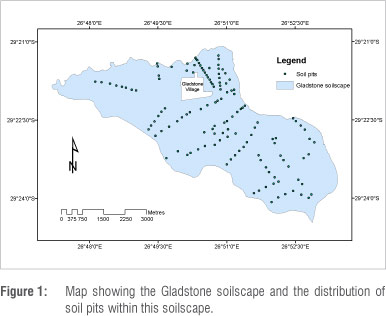
A soil survey procedure specifically designed to meet the objective of the survey was used on Gladstone and Potsane. The objective of the survey was to delineate areas that were 'well suited', 'moderately suited' and 'unsuitable' for IRWH. Soil depth was the main criterion regarding suitability among soils of selected forms. Soil pits (TPs) on carefully selected traverses (Figure 1) provided the needed information about the soil forms, whereas the needed information about soil depth was obtained from penetrometer measurements at 100-m intervals. GPS readings of every TP were recorded for the purpose of mapping and further spatial analysis. Profiles were properly described and soil forms identified according to the South African soil classification system.15
GIS and statistical modelling
A digital elevation model (DEM) of the study area was derived from a Shuttle Radar Topography Mission of 3 arc sec, which was resampled to 30-m by 30-m pixels using an auxiliary topo-map. The DEM was used to generate terrain attributes, i.e. slope (percentage), aspect, profile and plan curvature, flow direction and flow accumulation. The last two attributes and slope were used to calculate wetness index as follows16:

Wetness index= ln (AS/tanβ), Equation 3 where As is the upslope area (m2) and β is the slope in degrees.
In calculating the wetness index, the upslope area was calculated by using flow accumulation (number of contributing pixels) multiplied by the pixel (grid) size of the raster. In so doing and to avoid a 'no-data' error caused by computation of the natural logarithm of zero, where the number of contributing pixels is zero, a value of 1 was added to every pixel. With this procedure, the minimum area is a single pixel.
The terrain morphological unit (TMU) was also derived from the DEM by applying expert knowledge and the utilisation of specialised mapping and three-dimensional visualisation software, '3dMapperTM'.17
In order to utilise the point information obtained from the soil survey, each soil pit observation was plotted using coordinates obtained from the GPS reading. Initially, the relief characteristics that were derived from the DEM were calculated as surfaces (raster data sets). All the terrain attributes were treated with a smoothing technique in order to reduce the significance of anomalous cells.18 The smoothing technique (a neighbourhood tool in ArcGIS) used a low-pass filter that worked on a pixel by three pixels basis. The statistics of the raster data set before and after smoothing showed that the minimum, maximum, average and standard deviation remained the same. With the help of the points representing soil pit observations, the terrain attribute values for each point were extracted and stored in a database on which further statistical analysis was performed.
Different statistical methods were considered to model the relationship between terrain attributes and soils. Discriminant analysis was found to be appropriate and was thus used in the study. Discriminant analysis has an advantage over the other techniques in that the dependent variable does not need to be continuous, and therefore discrete variables like soil type can be analysed. Basically, discriminant analysis finds a set of prediction equations that decide group membership based on independent interval variables. In this study, discriminant analysis was used particularly to find a decision rule in which soil association (or a group of soil types) can be predicted based on terrain attributes at a point.
In developing the discriminant functions, soil type (soil form) was used as the dependent variable (grouping variable), and aspect, slope, profile curvature, plan curvature, wetness index and TMU were used as the independent variables. Of the 140 TPs, 6 were excluded from analysis to avoid anomalies and 134 were used as the training data in the analysis. Each TP can be considered as a sample in statistical terms. A SASTM statistical package was used to analyse the data obtained from GIS using discriminant analysis. Prior probabilities were used as an indication of prior knowledge of the distribution of the soil. The analysis resulted in a discriminant function (or linear equation). This equation calculates the degree of likelihood (posterior probability) of each data point belonging to each soil class. A TP was assigned to a soil class for which it had the highest posterior probability. A classification matrix was constructed to determine the percentage of associations correctly classified. The percentage of samples correctly classified (the hit ratio) was calculated by dividing the number of samples correctly classified by the total sample frequency.
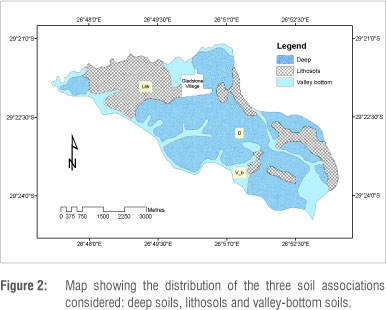
To further the explanation relevant to the purpose of the study, the soil types were combined into appropriate associations. Three soil associations were established based on the properties shared by the soil types. The first soil association included the 'shallow soils' (or lithosols): Glenrosa (Gs) Mayo (My) and Swartland (Sw), with depths of 500-700 mm. The second association consisted of the 'deep soils': Arcadia (Ar), Bonheim (Bo), Rensburg (Rg), Sepane (Se), Valsrivier (Va) and Swartland (Sw), with depths of more than 700 mm. The third association included the 'valley-bottom soils': Dundee (Du) and Estcourt (Es). Soil types which did not fit into the above categories were excluded from the analysis. The above associations were included as dependent variables and slope, aspect, plan curvature, profile curvature, wetness index and TMU as independent variables in the discriminant analysis. As with the previous discriminant analysis, the posterior probability for each TP was calculated, a classification matrix was constructed, and the hit ratio was computed.
Results of the discriminant analysis conducted on these soil associations were further validated in three phases. Firstly, cross validation ('leave one out') was conducted on the same set of data that was used to develop the discriminant functions. Taking one sample out at a time, the group to which this sample belonged was predicted using the remaining set. Secondly, the discriminant function was tested on the same study area but with new data sets of samples taken randomly on areas delineated as suitable for IRWH by an expert. Thirdly, the discriminant analysis was tested on different data sets from another study area - Potsane - which was in the same land type.
Results and discussion
The class level information (Table 1) reveals the make-up of the TP's used for calibration. The information obtained from the classification matrix is also summarised in Table 1. In the first instance of the discriminant analysis run, the chance of encountering any of the soils was set to be equal by assigning them the same prior probability. Thus the main determinant in this instance was the discriminant function derived in the process. Although there are TPs correctly identified for each soil class, the overall hit ratio was 30.6%. This percentage was further reduced in the cross validation to 20.1%. From the cross validation result (Table 1), the soil types that made it to the category of correctly classified were classes with good representation (i.e. classes with relatively higher frequency): Ar, Bo, Es, My, Rg, Se and Sw.
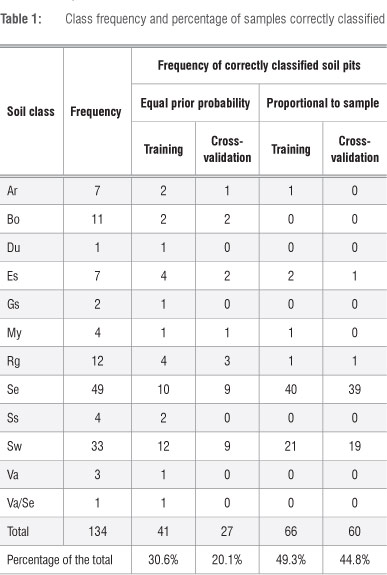
The last two columns of Table 1 show the prediction results in which prior probability was set similar to sample proportion. This selection resulted in an increase in the hit ratio. This setting of prior probability can be used if the sampling is considered to be representative of the actual distribution. Here it should be noted that the sample proportion did provide more information than the plain assumption that 'all soil classes had the same probability of occurrence'. Thus, with prior probability set to sample proportion, a hit ratio of 49.3% was achieved on the calibration data, which decreased to 44.8% when cross validation was conducted on the training data.
Despite this improvement, the hit ratio was still below 50%. A closer study of the classification matrix for soil type revealed which samples were classified into which class. This revelation made it possible to regroup the soil types into the groups defined in the procedure in a way that facilitated investigation of soil distribution prediction in relation to land-use requirements, in this case suitability for IRWH.
Prediction conducted on associations of soil types brought the level of accuracy to an acceptable range. With no prior knowledge regarding the proportion of the soil associations, i.e. prior probability set equal for each association, 56.9% of the calibration data was correctly classified. The cross validation done on the training data supported the result with a similar score - 51.5%. As additional information regarding the suitability to IRWH was available from expert analysis, extra points were used to validate the result. On the samples extracted from areas suitable for IRWH, 58.3% were correctly classified.
The TP samples provided some information about frequency of soil type occurrence. To utilise the information carried by the sample proportion, a prior probability equal to the proportion of samples was considered and yielded a dramatic increase in classification accuracy - hit ratios of 83% and 80% were attained for the training samples and cross-validation data, respectively. This improvement was further magnified by the validation test done on samples extracted from areas suitable for IRWH. From 168 samples, the discriminant classification identified 159 as suitable for IRWH - an accuracy of 94%.
Making the prior probability similar to the sample proportion, as described in the previous paragraph, provided a striking improvement in prediction accuracy. However, the overall improvement achieved was not proportional for all the soil associations - only those associations including a large proportion of the training sample had a high probability of being predicted correctly (Figure 2). For instance, because the deeper soils made up the majority of the training samples, the validation test done on areas suitable for IRWH yielded a very high accuracy. The accuracy percentage for the minor soil associations (the shallow and valley-bottom soils) was very low.
To compensate for minor soil associations, one can adjust the prior probability assigned to each association and monitor the changes effected. This approach could involve making trade-offs between the percentage of overall accuracy and class accuracy. To observe the effect of such an adjustment, prior probabilities of 20%, 30% and 50% (Table 2), based on the information observed in the samples (the proportion was arbitrarily selected), were used.
In comparison with the 'prior probability set proportional to sample', the 'self-assigned prior probability' more than doubled the accuracy of prediction in the minor associations (Table 2). At the same time, this approach reduced the accuracy of the major association. Furthermore, it reduced overall accuracy, with resulting accuracies of 74.6%, 66.2% and 78.0% for training samples, cross-validation data and test areas suited to IRWH, respectively (Table 2). The decrease in overall accuracy was considerable, i.e. more than 15%. Thus one should give careful consideration to changing the prior probability. The use of sample proportion appears to yield the best results and also makes sense from a practical point of view. Poor predictions of small areas with poor soils are considered relatively unimportant compared with good predictions on large areas of good (deep) soils.
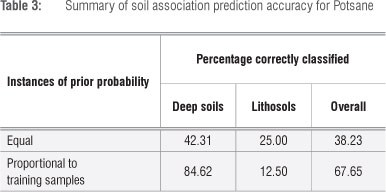
The results of the validation test done on Potsane are presented in Table 3. As with the exercises considered earlier, the results from this test show that prior knowledge on the dominance of soil associations is important. Land type data provide valuable information in this respect. The estimated percentages of the soils on each TMU are clearly presented in the land type inventories now available for the whole of South Africa. Because the deep soil association contains the soils that are suitable for IRWH, it is their prediction that is important. The validation test shows that the model predicts these soils with an accuracy of 85%, which is very satisfactory. The poor prediction accuracy of 12.5% for the lithosols is relatively unimportant from a practical point of view.
Improved mapping accuracy with soil associations is an indication that accuracy was hampered by pixel size or z-axis accuracy. The scaling of 90-m grids to 30-m grids is reported to improve resolution, but improved z-axis accuracy could make it possible to distinguish finer resolutions. During a field visit, we could see subtle nuances in elevation that were related to differences in soils; these differences were not detected by the DEM.
Conclusion
The following conclusions are relevant:
• There is considerable potential in modelling digital terrain attributes in order to predict the distribution of soil associations, for example those suitable for IRWH, in a land type. Acceptable accuracy can be obtained with careful application of relevant statistical methods.
• Improved resolution and accuracy of the z-axis will increase mapping accuracy.
• The essential role of expert knowledge in formulating the prediction model needs to be accentuated.
• Based on the different results obtained by changing the probabilities, it is clear that prior knowledge of the soil distribution in an area (from land type data or reconnaissance studies) greatly improves the accuracy of the discriminant functions.
• There is a greater probability of dominant soils being correctly classified when the prior probability is set according to sample frequency proportion.
• For prediction in a new locality, the environmental factors influencing soil formation should be similar. This is to a large extent taken into consideration when working within a land type.
Acknowledgement
We thank the Water Research Commission for financial support of this study.
Authors' contributions
M.G.Z. was responsible for the digestion of data and predictive mapping; PL.R. was responsible for the design, management and quality control of the project; M.H. performed the field soil survey work; and L.D.v.R. was responsible for management and quality control.
References
1. Scull P Predictive mapping in the Mojave desert of California [dissertation]. Santa Barbara, CA: University of California; 2002. [ Links ]
2. Zhou B, Zhang X, Wang R. Automated soil resources mapping based on decision tree and Bayesian predictive modeling. J Zhejiang Univ-Sc. 2004;5(7):782-795. http://dx.doi.org/10.1631/jzus.2004.0782 [ Links ]
3. Webster R. Quantitative and numerical methods in soil classification and survey. Oxford: Clarendon Press; 1977. [ Links ]
4. Jenny H. Factors of soil formation. New York: McGraw-Hill; 1941. [ Links ]
5. Hudson BD. The soil survey as a paradigm-based science. Soil Sci Soc Am J. 1992;56:836-841. http://dx.doi.org/10.2136/sssaj1992.03615995005600030027x [ Links ]
6. Scull P Franklin J, Chadwick OA, McArthur D. Predictive soil mapping: A review. Prog Phys Geog. 2003;27(2):171-197. http://dx.doi.org/10.1191/0309133303pp366ra [ Links ]
7. Webster R. The development of pedometrics. Geoderma. 1994;62:1-15. http://dx.doi.org/10.1016/0016-7061(94)90024-8 [ Links ]
8. McBratney AB, Mendonça Santos ML, Minasny B. On digital soil mapping. Geoderma. 2003;117:3-52. http://dx.doi.org/10.1016/S0016-7061(03)00223-4 [ Links ]
9. Zhu AX, Hudson B, Burt J, Lubich K, Simonson D. Soil mapping using GIS, expert knowledge, and fuzzy logic. Soil Sci Soc Am J. 2001;65:1463-1472. http://dx.doi.org/10.2136/sssaj2001.6551463x [ Links ]
10. Hensley M, Botha JJ, Anderson JJ, Van Staden PP Du Toit A. Optimizing rainfall use efficiency for developing farmers with limited access to irrigation water. Report no. 878/1/00. Pretoria: Water Research Commission; 2000. [ Links ]
11. Van Rensburg LD. Advances in soil physics: Application in irrigation and dryland crop production. S Afr J Plant Soil. 2010;27(1):9-18. http://dx.doi.org/10.1080/02571862.2010.10639966 [ Links ]
12. Hensley M, Bennie ATP Van Rensburg LD, Botha JJ. Reviews of 'plant available water' aspects of water use efficiency under irrigated and dryland conditions. Water SA. 2011;37(special edition):771-779. [ Links ]
13. Backeberg GR. Improving rural livelihoods with rainwater harvesting and conservation on communal croplands in South Africa: Opportunities and obstacles. In: Behl RK, Merbach W, Meliczek H, Kaetsch C, editors. Crop science and land use for food and bio-energy. Jodhpur: Agrobios (International); 2010. p. 299-317. [ Links ]
14. Hensley M, Le Roux PAL, Gutter J, Zerizghy MG. A procedure for an improved soil survey technique for delineating land suitable for rainwater harvesting. Pretoria, South Africa: Water Research Commission, 2007 TT 331/07. [ Links ]
15. Soil Classification Working Group. Soil classification - A taxonomic system for South Africa. Pretoria: Department of Agricultural Development; 1991. [ Links ]
16. Burrough PA, McDonnell RA. Principles of geographic information systems. Oxford: Clarendon Press; 1998. [ Links ]
17. Burt JE, Zhu AX. 3dMapper 4.02. Madison, WI: Terrain Analytics; 2004 [cited 2006 Oct]. Available from: www.terrainanalytics.com [ Links ]
18. Cohen S, Willgoose G, Hancock G. A methodology for calculating the spatial distribution of the area-slope equation and the hypsometric integral within a catchment. J Geophys Res-Earth Surf. 2008;113(F3):F03027. [ Links ]
 Correspondence:
Pieter Le Roux
Department of Soil, Crop and Climate Sciences
University of the Free State
PO Box 339, Bloemfontein 9300, South Africa
Email: lerouxpa@ufs.ac.za
Received: 24 Apr. 2012
Revised: 18 Sep. 2012
Accepted: 19 Jul. 2013

