


Serviços Personalizados
Artigo
 Inglês (pdf)
 Artigo em XML
 Referências do artigo
Indicadores

Links relacionados
-
 Citado por Google
 -
 Similares em Google
Compartilhar

 Permalink
South African Journal of Science
versão On-line ISSN 1996-7489
versão impressa ISSN 0038-2353
S. Afr. j. sci. vol.109 no.9-10 Pretoria Jan. 2013
RESEARCH ARTICLE
Contamination of the water supply to the town of Carolina, Mpumalanga, January 2012
Terence S. McCarthyI; Marc S. HumphriesII
ISchool of Geosciences, University of the Witwatersrand, Johannesburg, South Africa
IIMolecular Sciences Institute, School of Chemistry, University of the Witwatersrand, Johannesburg, South Africa
ABSTRACT
Acid mine drainage has become a serious environmental concern in South Africa, particularly for the long-term sustainability of the country's fresh water supply. Such concerns were dramatically highlighted in January 2012 when water in the Boesmanspruit Dam, which supplies the town of Carolina with potable water, underwent rapid deterioration following a large rainstorm event. A sudden drop in pH to 3.7, accompanied by elevated levels of iron, aluminium, manganese and sulphate rendered the water toxic and unsuitable for use. The problem remained unresolved for 7 months, provoking community protests and eventually court action against the Department of Water Affairs. Although evidence pointed to coal mining as the source of contamination, it was unclear how the dam became polluted so rapidly. We investigated the events surrounding the contamination of Carolina's water supply, in an attempt to identify a possible cause and to assess whether the event has relevance for other dams in the Vaal River system. Chemical analyses of water samples revealed that the pollution originated from the Witrandspruit subcatchment where seepage from coal mines had accumulated in a wetland upstream of the dam. During an unusually heavy downpour, ponds holding polluted run-off from coal handling facilities overtopped and flushed the contents of the wetland into the Boesmanspruit Dam. While a recurrence of the event at Carolina is possible, major dams in the upper Vaal River catchment are unlikely to experience a similar catastrophic event. In the long term, pollution of these dams is likely to proceed gradually, as is currently occurring at the Middelburg and Witbank Dams.
Keywords: acid mine drainage; water chemistry; coal mining; contamination; South Africa
Introduction
South Africa has substantial coal reserves. The country is the sixth largest coal producer and the fifth largest exporter of coal in the world.1 Coal thus plays an integral role in South Africa's domestic economy, with approximately 93% of the country's electricity produced by coal-fired stations.2 Most collieries are concentrated in the Mpumalanga Province, specifically around the towns of Witbank, Middelburg, Ermelo and Secunda. Coal production and use results in a number of serious environmental impacts. South Africa's CO2 emissions from fuel combustion were around 340 Mt in 2006, making it the 15th largest emitter of CO2 globally.2 Eskom's coal-fired power stations and Sasol's commercial coal synfuel plants account for the majority of this emission. However, perhaps the most serious immediate environmental concern is that of acid mine drainage.3-5
South African coal occurs in layers within sedimentary rocks of the Karoo Supergroup. Both the coal and the host rock contain pyrite (FeS2), which when exposed to atmospheric oxygen and water, oxidises to produce sulphuric acid. This oxidation process occurs naturally in undisturbed rock, but at a rate that it is normally neutralised by buffering minerals such as carbonates and by hydrolysis of aluminosilicate minerals. Mining increases the exposed surface areas of these sulphur-bearing rocks, generating acid beyond the buffering capabilities of the local environment. The resultant acidic water increases the solubility of Fe, Al and heavy metals, rendering stream and groundwater toxic.6,7
Acid mine drainage has become a very visible and highly political issue in South Africa in recent years. It has serious environmental and socio-economic consequences, particularly for the long-term sustainability of the country's supply of fresh water. These consequences were dramatically highlighted by a sequence of events that unfolded at the town of Carolina, Mpumalanga Province, in early 2012.
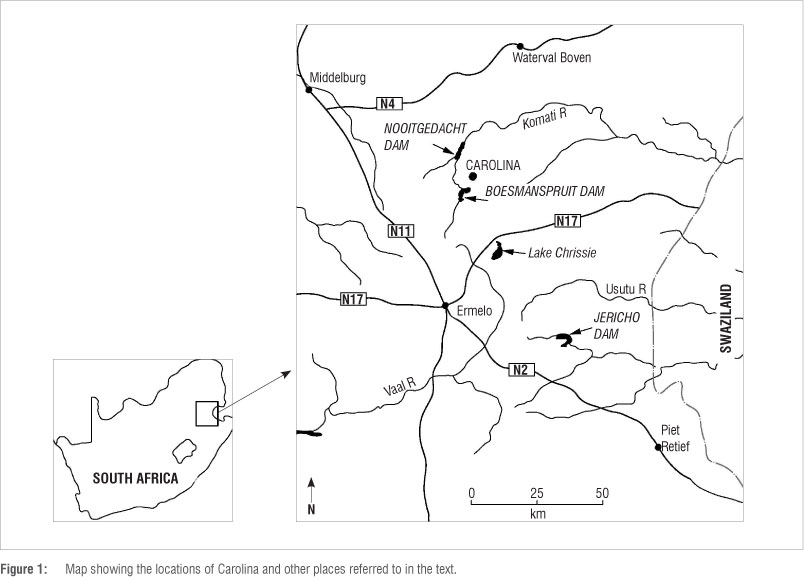
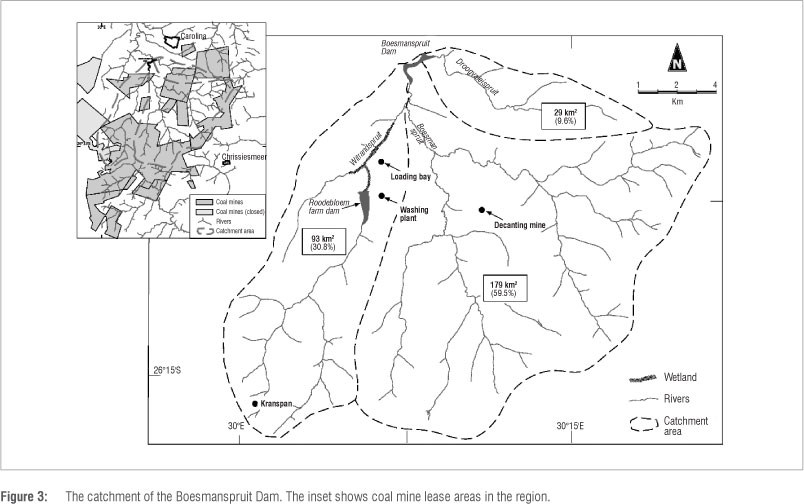
Carolina (population 23 000) is situated in the eastern Highveld between the towns of Middelburg and Ermelo (Figure 1). It was founded in 1883 to service the needs of the local farming community and travellers bound for Barberton, a role maintained well into the 20th century. Rapid growth in coal mining activities over the last decade has led to the expansion and diversification of the economic activity in the town.
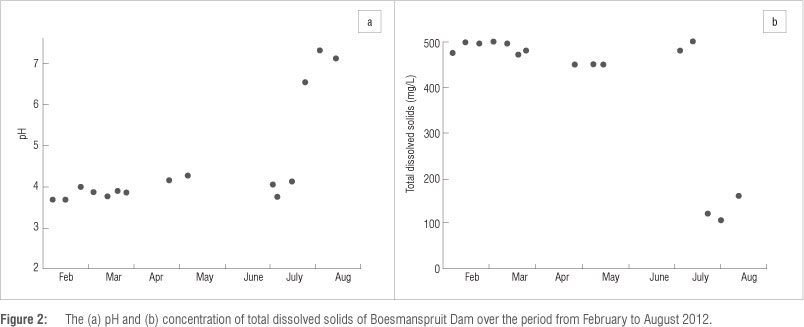
On 11 January 2012, the Technical Services Department of the Chief Albert Luthuli Municipality became aware that the quality of the water produced by the Carolina Water Treatment Works at the Boesmanspruit Dam just south of the town, which supplies the town's water, had undergone a rapid deterioration. Chemical analyses revealed that the pH of the water was 3.7 and that the concentrations of iron, aluminium, manganese, sulphate and certain other constituents were above acceptable limits. The total dissolved solids (TDS) concentration was in the order of 500 mg/L (Figure 2a and 2b). Investigations further revealed that fish in the Boesmanspruit and the dam were dying and the water had taken on a dark green colour.8 The protocols in use at the Water Treatment Works (chlorination and sediment removal) were inadequate to bring the water to drinking quality standard.9 Thus began a 7-month long nightmare for the residents of Carolina.
Emergency notices were posted throughout the town on 12 January, advising residents that the town's piped water was unsafe for drinking, cooking and washing.8 Emergency supply measures were put in place. Plastic water tanks were installed at strategic locations in the town which were supplied using water tankers. Water was obtained from boreholes in the area. At the Water Treatment Works, lime was added to the water to raise the pH, but oxidation and removal of the iron and manganese remained a problem.10 Plans were drawn up to upgrade the Water Treatment Works so that it could cope with the poor water quality in the dam.
Examination of past records indicated that the fall in pH was sudden,11 and followed a major storm in the catchment on 10 January. The elevated sulphate concentration and low pH in the dam water indicated that the contamination originated from coal mining activities in the catchment.
By early May, the modifications to the treatment plant were still not fully operational, and there were problems with the supply of potable water by the tankers.12 The quality of water in the dam remained poor (Figure 2). In mid-May, community protests in the township of Silobela outside Carolina erupted into violence and municipal buildings were damaged. One of the protestors was shot by police.13 By June, the water supply problem had still not been resolved and the delivery of potable water by tankers remained erratic. Lawyers for Human Rights and the Legal Resources Centre, acting on behalf of the residents of Silobela, brought a court action against the Department of Water Affairs in late June to force the government to provide an adequate water supply.14 Judgment was awarded in favour of the plaintiffs on 10 July 2012 (North Gauteng High Court, Case No. 35672/12).
Resolution of the problem came swiftly in July. The Department of Water Affairs operates a number of inter-basin water transfer schemes in the upper reaches of the Vaal River basin. The main function of these schemes is to supply high quality water to Eskom power stations in the region. One of these schemes involves the transfer of water from Jericho Dam in the Usutu catchment to the Nooitgedacht Dam in the Nkomati catchment (Figure 1) from where it is drawn off for use in power stations in the Olifants catchment to the west.15 The water pumped from Jericho Dam is discharged into the upper catchment of the Boesmanspruit Dam and flows via this dam to the Nooitgedacht Dam. No transfers had taken place in 2011 (Van der Westhuizen W, Department of Water Affairs, 2012, oral communication to JP Pretorius, April) and the first half of 2012, but commenced early in July 2012. We estimated a flow rate of about 1.5 m3/s on 03 July, based on the observed depth of flow through a culvert in the upstream tributary (James C 2012, written communication, July). Water quality in the dam improved rapidly and by the end of July the pH had risen to 7 and the concentration of TDS had fallen to about 100 mg/L (Figure 2), values typical of unpolluted streams in the area.
The chemistry of the polluted water, notably the elevated sulphate concentration, pointed to coal mining activity as the main source,10 but it was unclear how the entire dam could have become polluted so rapidly. A field investigation conducted shortly after the event suggested that the pollution emanated from dams containing polluted surface run-off at coal washing and loading facilities in the catchment.16 It was believed that these had overflowed during the heavy rain on 10 January. Another possibility was the rapid oxidation of pyrite in coal dust at these facilities that was entrained in run-off during the storm.
We commenced our investigation shortly after the incident to try to establish the cause. It is important to find out what went wrong to reduce the possibility of a recurrence and to assess whether the event has relevance for other dams in the Vaal River system, notably the Grootdraai and Vaal Dams, which supply water for the Gauteng region. Coal mining in the upper Vaal catchment is steadily expanding5 and the dams could be at risk in the future.
Methods
In February and March 2012, water samples were collected from the Boesmanspruit Dam and certain of its tributaries by Dr JP Pretorius, which were analysed by Regen Waters Laboratory, Witbank. In May 2012 we conducted an extensive sampling campaign throughout the catchment, which was supplemented by a second sampling campaign in early July 2012. In addition to sampling open water bodies, we used auger holes to access and sample shallow groundwater at several localities.
The pH and electrical conductivity of water samples were measured in the field using portable meters calibrated against appropriate standard solutions. TDS were calculated from electrical conductivity values. Samples were filtered through 0.45-um syringe filters and refrigerated prior to analysis. Samples were analysed for calcium, magnesium, sodium, potassium, silicon, iron, aluminium and manganese by inductively coupled plasma-optical emission spectrometry (Optima 5300 DV, Perkin Elmer, Waltham, MA, USA), and for Cl, NO3, SO4 and PO4 by ion chromatography (ICS-90, Dionex, USA).
Experimental investigations were carried out to examine the rate of oxidation of pyrite in coal from the region. The experiment was designed to emulate the potential for acid generation during the entrainment of coal dust in run-off associated with a large rainstorm. Coal dust collected from the coal loading bay was mixed with uncontaminated water collected from the upper Boesmanspruit catchment in a 1:1 ratio and agitated vigorously in an open container. The pH of this mixture was monitored on a daily basis for a period of 5 days. This simulation is likely to be considerably more severe than what would be encountered under field conditions, but provides an indication of the availability of pyrite for oxidation. For comparative purposes, a sample of pyrite was crushed into a fine powder and treated in the same way.
In order to reconstruct the likely response of the dam water to acid influx, we tested the buffering capacity of an uncontaminated water sample from the upper Boesmanspruit catchment. We assumed that the composition of this water would most likely represent the typical input into the dam under natural conditions. A 10-mL aliquot of water was titrated using 0.001 M (pH 3) HCl while monitoring the pH of the solution.
Rainfall records for the region were obtained from Internet sources and a local farmer, Mr Pretorius, of the farm Kranspan in the Witrand-spruit catchment.
Results
The Boesmanspruit Dam has a capacity of approximately 106 m3 and a catchment area of about 300 km2 (Figure 3) supporting agriculture and coal mining. The dam is fed by three tributary streams: the Boesmanspruit, which supplies 60% of the inflow, the Witrandspruit (31%) and the Droogevalleispruit (9%). Along most of their length, these are bedrock streams. However, in its lower reach, the Witrandspruit broadens into a wetland dominated by bulrushes (Typha sp.) and reeds (Phragmites sp.). The wetland overlies rocks of the lower Ecca Group and terminates at the Ecca-Dwyka transition.17 It appears to have formed as a result of a minor change in river gradient caused by preferential erosion of the Ecca Group strata relative to that of the Dwyka Group, analogous to the Seekoeivlei wetland.18 Depth probing and coring in the wetland indicated that there is very little peat development and the substrate for the emergent plants consists mainly of organic-rich mud.
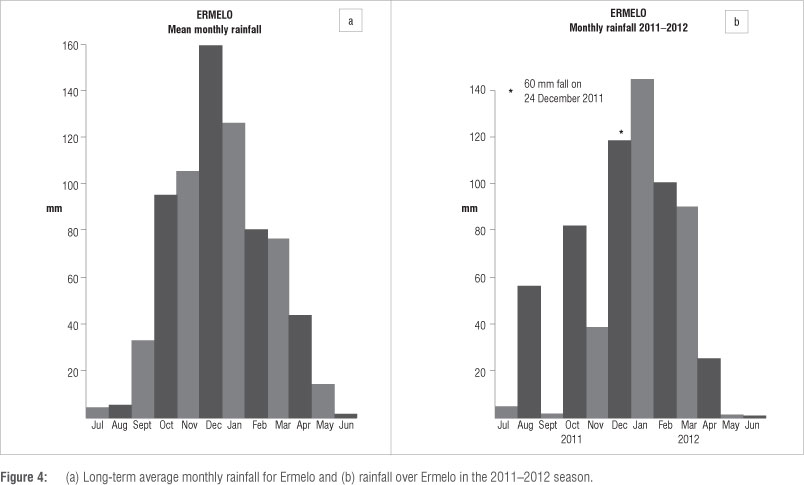
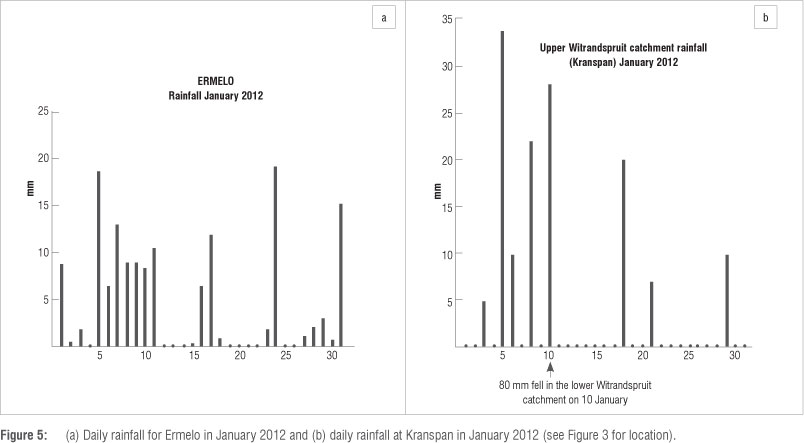
Rain in the area occurs mainly in the form of local afternoon thundershowers in summer. Mean annual rainfall (based on records for Ermelo, which are more complete) is 650 mm (Figure 4a). Rainfall during the 2011-2012 summer season (676 mm) was similar to the long-term average although it peaked a month later than normal (Figure 4b). Rainfall in January 2012 was sporadic except for the period from 05 to 10 January, when rain fell on most days (Figure 5a and 5b). There were particularly heavy storms on Kranspan in the upper Witrandspruit catchment during this period. Rainfall on Kranspan for the month was 136 mm. In the lower Witrandspruit catchment, 80 mm fell on 10 January (Pretorius JP 2012, oral communication, April). This storm cell bypassed Kranspan.
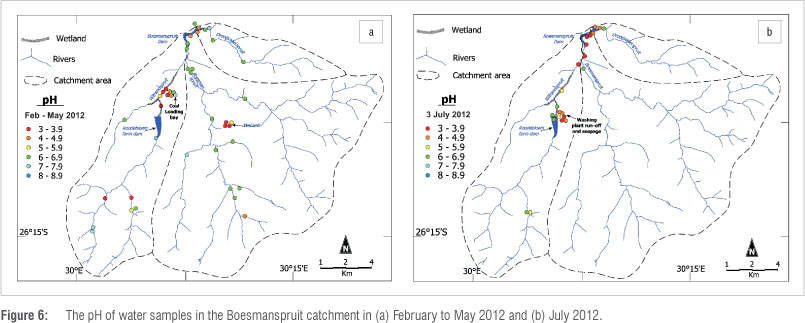
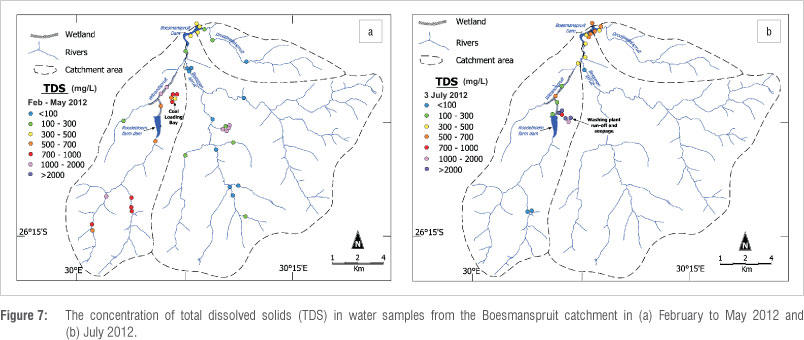
The quality of water in the catchment between February and July is summarised in Figure 6a, b and Figure 7a, b on the basis of pH and TDS, respectively. Low pH and elevated TDS water was largely confined to the catchment of the Witrandspruit and the reach downstream of its junction with the Boesmanspruit. Polluted water decanting from a defunct coal mine in the Boesmanspruit catchment (pH 1000 mg/L) did not appear to have had an adverse impact on the stream at the time of sampling. During the sampling in May, there was no outflow from the Witrandspruit wetland into the Boesmanspruit and the quality of water entering the dam was good. Lack of outflow may have been a result of abstraction from the dam on Roodebloem and evapotranspiration from the wetland.
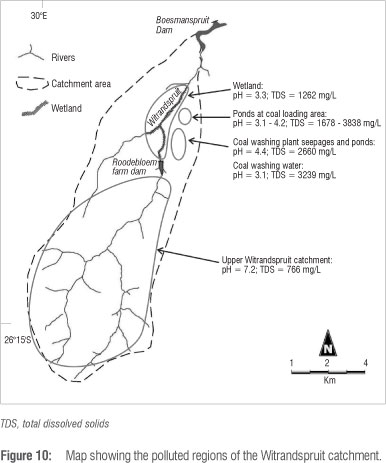
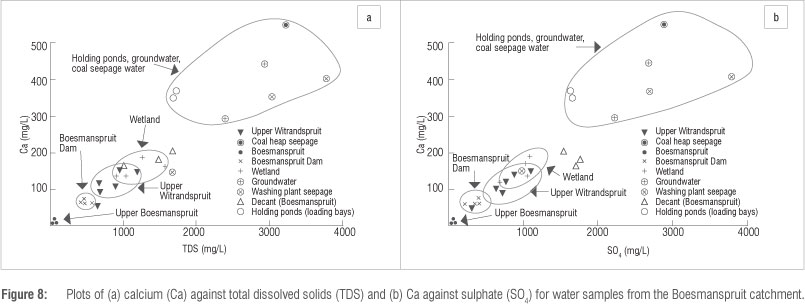
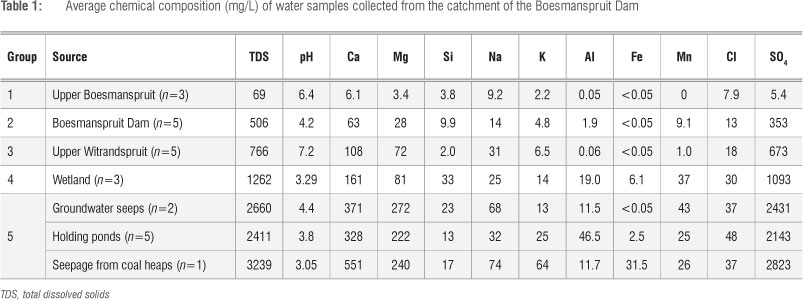
Plots of calcium against TDS and SO4 (Figure 8a, b) and TDS against pH (Figure 9) capture the main characteristics of water in the area. On the basis of chemistry and sample locations it is possible to divide the data into five groups: (1) the upper Boesmanspruit and the Droogevalleispruit, which are probably representative of unpolluted water in the area, (2) the Boesmanspruit Dam, (3) the upper Witrandspruit, (4) the wetland on the lower Witrandspruit and (5) the groundwater seepages, holding ponds and seepage from coal heaps at the railway siding. The average compositions of these groups are listed in Table 1 with those occurring in the Witrandspruit catchment illustrated in Figure 10. The most severely polluted samples are characterised by low pH and elevated concentrations of sulphate, calcium and, to a lesser extent, magnesium. The low pH water generally has elevated iron content as well. These are the typical hallmarks of acid mine drainage.6

Results of experiments to examine the rate of oxidation of pyrite in entrained coal dust are shown in Figure 11. Data show that oxidation associated with the coal dust had very little effect on the pH of the water, decreasing the pH from 7.4 to 7.2 over a period of 5 days. By comparision, oxidation of the pure pyrite sample showed a noticeable decrease with time, with the pH decreasing to 3.4 after 5 days.

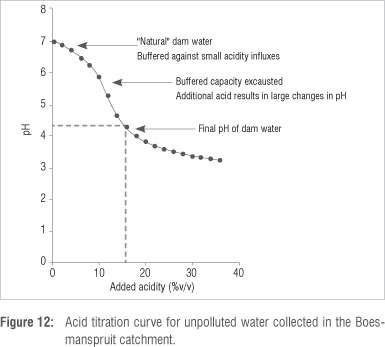
The titration curve for water collected from the upper Boesmanspruit catchment indicates that, under natural conditions, water flowing into the dam would be buffered against small additions of acidity (Figure 12). However, this buffering capacity is quickly exhausted, with further additions of acid resulting in a sharp drop in pH. In order to decrease the pH of the natural water to the pH level measured in the dam (pH = 4.3), a ~15% addition of acid with pH = 3 (0.001 M HCl) would be required.
Discussion
Localisation of the source
Data regarding water quality in the dam prior to the event on 10 January 2012 do not exist or are unavailable. The information we have collected only reflects the water composition of the dam and inflowing rivers subsequent to the severe polluting event (the earliest samples were collected in late January). Notwithstanding uncertainties in the compositions of the streams prior to 10 January, it is evident from the results (Figures 6 and 7) that the source of the pollution lies in the Witrandspruit catchment. The binary plots involving Ca, SO4 and TDS (Figure 8a and 8b) show that the data form linear arrays. Such arrays usually arise from two-component mixing and can be used to calculate the mixing proportions of water samples of different composition, as is illustrated in Figure 13a.
Binary plots involving pH and TDS can be used to place additional constraints on mixing models (Figure 13b).19 It is evident from the model illustrated in Figure 13b that the pH responds rapidly to addition of small quantities of acidic water. However, the response will differ in natural water, depending on the buffering characteristics. A model calculation based on water having the buffering characteristics of the local stream water is shown in Figure 13c. Other processes can influence compositions in TDS vs. pH plots. For example, addition of lime (a mixture of calcium oxide and hydroxide), which is commonly used to neutralise acid mine drainage, will increase both pH and TDS (Figure 13b), whereas oxidation of iron II to form a hydrated iron III precipitate, as commonly occurs when acidic groundwater emerges at groundwater seeps,20 will substantially reduce pH but will only have a small effect on TDS.
Possible specific sources
The end members on the mixing lines (Figure 13a, 13b and 13c) are the unpolluted Boesmanspruit-type water, the heavily polluted holding ponds, and coal heap seepage and groundwater seepages at the upper end of the Witrandspruit wetland. Mixing of these end members in different proportions could give rise to the remaining water types. However, reference to the location map (Figure 10) shows that the upper Witrandspruit samples cannot represent mixing of water from the holding ponds and polluted seepages with the Boesmanspruit-type water, although they lie on the mixing line. This situation simply illustrates that there is a generic aspect to the mixing arrays evident in the binary plots. Water polluted by acid mine drainage arising from Highveld coal mines will generally have more or less the same composition, and unpolluted water in the region emanates from the same bedrock type and will therefore resemble the unpolluted water such as that which occurs in the Boesmanspruit. In considering mixing models, it is therefore also necessary to take the spatial locations of water types into account.
Holding ponds
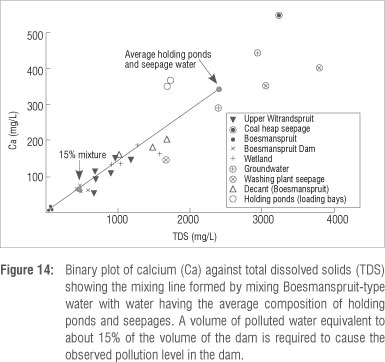
Marais et al.16 suggested that overflow from the holding ponds at the coal loading bay and washing plant caused pollution of the Boesmanspruit Dam. This water would have flowed through the wetland and they imply that the contamination seen in the wetland also arose from this source. To form the composition of water in the dam would require a mixture of about 15% of holding pond water (~150 000 m3) and about 85% Boesmanspruit-type water (Figure 14). Using Google Earth images and field observations we estimated the combined volume of all of the holding ponds at the various coal handling facilities at 25 000-30 000 m3. Although investigations in the area shortly after the event strongly suggested that some or all of the holding ponds did overflow,16 it is evident from the mixing calculations that the volume of the ponds is insufficient for them to have caused the problem on their own.
Oxidation of pyritic coal dust
Field investigations have shown that coal dust which accumulates on the floors of the handling areas becomes entrained in run-off and washes down into the wetland.16 It is conceivable that during a heavy storm, pyrite in entrained dust might undergo oxidation and acidify the water. Our experiments showed that while the exposure of pyrite to oxygen can generate acidity, this oxidation process in coal is probably too slow to have caused significant acidification of the run-off.
The Roodebloem farm dam and upper Witrandspruit
The Roodebloem farm dam (estimated capacity 120 000 m3) and the upper reaches of the Witrandspruit, both polluted by acid mine drainage, are also potential contributors to pollution of the Boesmanspruit Dam. However, the pH of their water is too high (pH = 6-7; Figure 9) to have caused the observed drop in pH in the Boesmanspruit Dam. A significant contribution of polluted water from the upper Witrandspruit source is therefore discounted.
The wetland
The remaining possible source of the pollution is the wetland itself. The composition of water in the wetland prior to 10 January is unknown, and the composition after this date could have been affected by water discharge from the holding ponds. However, it is evident from the volume estimates made previously that pollution must have been caused by a large volume of polluted water. The wetland potentially has sufficient capacity to make that contribution.
The area of the wetland is about 340 000 m2. The water depth is difficult to determine because the bed is gradational and the water is loosely held in the fibrous mat of vegetation. Near the surface, the mat is fairly open but density increases with depth as the proportion of muddy sediment increases. Assuming that 0.3-0.4 m of the water column could be flushed out during a flood, the wetland could yield about 120 000 m3 of water. If contaminated, this water could have made a significant contribution to the pollution of the dam.
There are two possible ways the wetland could have become polluted. In wetlands that receive acid mine drainage, sulphate is reduced to sulphide which is partly fixed as metal sulphides, especially iron sulphide in the wetland. If this iron sulphide were to oxidise it could regenerate acidic water within the wetland. Regular historical transfer of water to Nooitgedacht Dam via the Witrandspruit may have increased the average discharge in the wetland, causing it to expand. Cessation of transfer during 2011 would have led to a lowering of the water level in the wetland and hence exposure of accumulated iron sulphide bearing organic debris to oxidation, leading to acidification of the wetland.
We discount this scenario because the production of acid in this manner would have lowered the pH but only slightly increased the TDS. In the binary plots involving pH and TDS (Figure 9), the water in the wetland is clearly not anomalously low in respect of its solute content. While oxidation of iron oxide in the wetland as a result of aerial exposure may have occurred, we do not consider it to be a major contributor to pollution of the wetland.
The second way in which the wetland could have become polluted is by slow accumulation of severely polluted seepage water from adjacent areas. One such seepage occurs on the slope below the coal washing plant and it seems that a plume of acidic groundwater (Table 1) enters the Witrandspruit from this source. The wetland vegetation at the toe end of the plume had died16 and the grass on the upper slope also showed signs of distress. A large amount of coal debris had been washed down the slope below the washing plant and was interbedded with fluvial sediment in the stream at the upper end of the wetland.16 Pore water in this sediment had a pH of 4.4.
We have not carried out an exhaustive search for polluted seepages, but it is likely that the one identified is not alone. For example there is an old coal mine on the edge of the wetland and a large rock waste dump, including coal fragments, within and adjacent to the wetland. Their presence presumably also contributes to the pollution load in the wetland. Slow accumulation from these sources may have increased the TDS and lowered the pH of the wetland.
Although the wetland is a likely contributor to the pollution of the dam, mixing diagrams indicate that pollution of the dam to the observed level would require about 150 000 m3 of water with a pH of 3 and TDS in the range of 1500-3000 mg/L. The wetland could therefore not have been the only source. If, however, the wetland water were combined with overflow from the holding ponds and water flushed from coal piles on the loading bay, a sufficiently large volume of water could have been generated to pollute the Boesmanspruit Dam to the extent observed.
Response of the dam to the influx of polluted water
Natural water bodies can compensate for acidity influxes through the internal production of alkalinity. The alkalinity of most natural waters is imparted by the presence of bicarbonates. As long as there is sufficient buffering capacity present, the addition of acid to a system will have little effect on pH. However, once this natural alkalinity is consumed and the critical acidity load is exceeded, a water body can develop rapidly into an acidic system. This process explains how a large influx of acidic water could have caused the sudden change observed in the pH of the dam water (Figure 15).

Suggested sequence of events leading to the pollution
During the course of 2011, acidic groundwater discharging into the wetland created a reservoir of low pH, high TDS water, possibly as much as 350 000 m3. The very low flow rate through the wetland enhanced the accumulation of this polluted water. Some polluted water probably flowed beyond the wetland, but would have been diluted and neutralised at the junction with the Boesmanspruit because of the larger discharge in the latter stream. However, this flow may have compromised the buffering capacity of the dam to some extent. Early January 2012 was a particularly wet period and during this time it is likely that holding ponds at the various coal handling facilities filled with water.
Heavy rainfall on 10 January led to overtopping of the holding ponds,16 and created sufficient additional local run-off to flush the combined overflow from the ponds and the contents of the wetland into the Boesmanspruit Dam. The buffering capacity of the dam, possibly already compromised by slow leakage from the Witrandspruit wetland, was overwhelmed and the dam became acidic.
The dam remained acidic for 7 months. It is evident from the data portrayed in Figure 2 that the pH increased slowly during this period, most likely because of the combined inflow of the Boesmanspruit and Droogevalleispruit, which contributes 70% of the inflow. In July, the pH fell briefly and TDS rose as a result of the advancing flood of water from Jericho Dam which pushed the still contaminated wetland water into the dam. In the absence of the inflow from Jericho Dam, it is likely that complete recovery of the dam would have taken at least another 12 months, based on the gradual, linear increase in pH observed in the months immediately following the event (Figure 2).
Could there be a recurrence? The analysis presented here suggests that a number of factors contributed to the incident. The primary cause was acid groundwater seepage into the wetland, creating a large reservoir of polluted water. This acid groundwater has since largely been flushed out by water from Jericho Dam. However, if regular water transfer ceases, we believe that the wetland will again become polluted, recreating the pre-January 2012 situation. Local heavy rain could then cause a recurrence.
Our analysis of the Carolina incident has some bearing on the vulnerability of dams on the upper Vaal River to catastrophic pollution. Rivers draining the Ecca Group sandstones of the Highveld coalfields have limited buffering capacity. Nevertheless, it is evident that pollution of the Boesmanspruit Dam required the influx of a volume of severely polluted water (pH = 3, TDS>1500 mg/L) equal to about 15% of the total volume of the dam. At Carolina, the wetland acted as a reservoir enabling a relatively large volume of polluted water to accumulate. The major dams on the upper Vaal River have large volumes (Grootdraai Dam: 364 million m3; Vaal Dam: 2536 million m3) and their catchments do not support wetlands where sufficiently large volumes of polluted water could accumulate. It is extremely unlikely that they could experience a catastrophic pollution event like the Boesmanspruit Dam. In the longer term, pollution of these dams is likely to proceed gradually, as is occurring at the Middelburg and Witbank Dams.5
Conclusions
It appears that the catastrophic pollution of the Boesmanspruit Dam was the result of a complex chain of events. Extensive coal mining has and is taking place in the catchment. Some mines have closed and are decanting severely polluted water. Active mines and coal handling facilities are also contributing to the pollution load. The lower Witrandspruit subcatchment is the most severely affected and it appears that polluted surface, and especially groundwater, is entering the stream. The Witrandspruit is primarily a bedrock river, except for a section on the lower reach where the river widens into a wetland. Significantly, the storage capacity of this wetland is substantial in relation to the volume of the Boesmanspruit Dam. The major pollution sources appear to be located along this lower reach of the river.
In the past, the polluted water may have been flushed from the system as a result of the transfer of water from Jericho Dam to the Nooitgedacht Dam downstream of the Boesmanspruit Dam. However, no transfer took place during 2011, which enabled a substantial volume of polluted water to accumulate in the wetland. We suggest that the trickle of water leaving the wetland was being neutralised and diluted by the larger volume of water in the Boesmanspruit. This situation could have persisted, perhaps indefinitely, were it not for the heavy rains in the period from 05 to 10 January which probably filled and finally overtopped the holding dams at the coal handling facilities. The overflow discharged into the wetland and this now substantial volume of polluted water was flushed by storm-generated run-off into the dam, reducing the pH to 3.7.
The buffering capacity of water entering the dam via unpolluted streams is low. Therefore, the low pH condition of the dam persisted and we estimate that a return to normal conditions would have taken at least 12 months following the incident had flushing of the dam by water from Jericho Dam not taken place. If transfer of water from Jericho Dam is discontinued, we believe that the wetland will again become primed for a repeat of the events of January 2012.
In order to find a sustainable solution to the problem, we recommend that a detailed investigation of the surface and groundwater be undertaken in the Witrandspruit catchment, especially its lower reaches, so as to identify sources of ingress of polluted water. Once these have been identified, appropriate remediation measures should be devised and implemented.
The catastrophic pollution of Boesmanspruit Dam required a relatively unusual combination of circumstances and we believe that similar occurrences at the large dams in the upper Vaal River catchment are unlikely. However, smaller dams in coal mining areas could be vulnerable and risk assessments for such dams are recommended.
Acknowledgements
Dr JP Pretorius is acknowledged for drawing our attention to the Carolina problem, for collecting the initial samples and having them analysed, and for providing us with observations and photographs of the conditions existing in the area immediately following the event. Dr AJ Marais provided helpful information, and drew our attention to several important features in the catchment. Dr Letitia Pillay assisted with analytical work. Matthew Kitching and Leigh Gordon assisted with sample collection. Queen Molekwa carried out the oxidation experiments. Mr T Pretorius provided us with rainfall data. The University of the Witwatersrand and the National Research Foundation are acknowledged for providing financial support.
Authors' contributions
T.S.M and M.S.H. collected the samples and wrote the paper together.
References
1. International Energy Agency. Coal information. Paris: Organization for Economic Cooperation and Development; 2010. [ Links ]
2. Eberhard A. The future of South African coal: Market, investment and policy challenges. Stanford, CA: Program on Energy and Sustainable Development, Stanford University; 2011. [ Links ]
3. Geldenhuis S, Bell FG. Acid mine drainage at a coal mine in the eastern Transvaal, South Africa. Environ Geol. 1999;34:234-242. http://dx.doi.org/10.1007/s002540050275
4. Hodgson FDI, Krantz RM. Investigation into groundwater quality deterioration in the Olifants River catchment above the Loskop Dam with specialized investigation in the Witbank Dam sub-catchment. WRC Report 291/1/98. Pretoria: Water Research Commission; 1998. [ Links ]
5. McCarthy TS. The impact of acid mine drainage in South Africa. S Afr J Sci. 2011;107(5/6), Art. #712, 7 pages. http://dx.doi.org/10.4102/sajs.v107i5/6.712 [ Links ]
6. Blowes DW, Ptacek CJ, Jambor JL, Weisener CG. The geochemistry of acid mine drainage. In: Holland HD, Turekian KK, editors. Treatise on geochemistry. Volume 9. Oxford: Elsevier; 2003. p. 149-204. http://dx.doi.org/10.1016/B0-08-043751-6/09137-4 [ Links ]
7. Blodau C. A review of acidity generation and consumption in acidic coal mine lakes and their watersheds. Sci Total Environ. 2006;369:307-332. http://dx.doi.org/10.1016/j.scitotenv.2006.05.004 [ Links ]
8. Gumede ME. Report of the bad raw water that rendered the Carolina Water Treatment Works producing substandard water and the dead fish in the river and Boesmanspruit Dam in Chief Albert Luthuli Municipality. Carolina: Chief Albert Luthuli Municipality; 2012. [ Links ]
9. National Assembly. Reply to Question No. 381 to the Minister of Water and Environmental Affairs, 2012 February 24. [ Links ]
10. Technical Services Department. Minutes of the meeting on Carolina water quality failure. Carolina: Chief Albert Luthuli Municipality; 2012 February 02. [ Links ]
11. Technical Services Department. Minutes of the meeting on Carolina water quality failure. Carolina: Chief Albert Luthuli Municipality; 2012 March 08. [ Links ]
12. Technical Services Department. Minutes of the meeting on Carolina water quality failure. Carolina: Chief Albert Luthuli Municipality; 2012 April 26. [ Links ]
13. Tempelhoff E. Suur water, polisie skiet op betogers [Acid water, police shoot at protesters]. Die Beeld. 2012 May 18. Afrikaans. [ Links ]
14. Kings S. Carolina residents take their water woes to court. Mail and Guardian. 2012 June 25. Available from: http://mg.co.za/article/2012-06-25-esidents-take-their-water-woes-to-court [ Links ]
15. Vaz AC, Van der Zaag R Sharing the Nkomati waters: Cooperation and competition in the balance. Technical Documents in Hydrology, CR Series 14. Raris: UNESCO; 2003. [ Links ]
16. Marais AJ, Lotter A, Mbedzi F, Beetge A, Thirion C. Report on the impacts of contaminated water from mining and related activities, on wetlands in the Boesmanspruit catchment area, close to the town of Carolina (Chief Albert Luthuli Local Municipality). Nelspruit: Mpumalanga Tourism and Rarks Agency; 2012. [ Links ]
17. Geological Survey map. Mbabane, sheet 2630. 1:250 000. Pretoria: Council for Geoscience; 1986. [ Links ]
18. Marren RM, McCarthy TS, Tooth S, Brandt D, Stacey G, Leong A, et al. A comparison of mud- and sand-dominated meanders in a downstream coarsening reach of the mixed bedrock-alluvial Klip River, eastern Free State, South Africa. Sediment Geol. 2006;190:213-226. http://dx.doi.org/10.1016/j.sedgeo.2006.05.014 [ Links ]
19. Tutu H, McCarthy TS, Cukrowska E. The chemical characteristics of acid mine drainage with particular reference to sources, distribution and remediation: The Witwatersrand Basin, South Africa as a case study. Appl Geochem. 2008;23:3666-3684. http://dx.doi.org/10.1016/j.apgeochem.2008.09.002
20. Naiker K, Cukrowska E, McCarthy TS. Acid mine drainage arising from gold mining activity in Johannesburg, South Africa, and environs. Environ Rollut. 2003;122:29-40. http://dx.doi.org/10.1016/S0269-7491(02)00281-6
 Correspondence:
Marc Humphries
School of Chemistry
University of the Witwatersrand, Private Bag 3
Wits 2050, South Africa
Email: marchump@gmail.com
Received: 19 Dec. 2012
Revised: 27 Mar. 2013
Accepted: 26 Jun. 2013

