


Serviços Personalizados
Artigo
 Inglês (pdf)
 Artigo em XML
 Referências do artigo
Indicadores

Links relacionados
-
 Citado por Google
 -
 Similares em Google
Compartilhar

 Permalink
South African Journal of Science
versão On-line ISSN 1996-7489
versão impressa ISSN 0038-2353
S. Afr. j. sci. vol.109 no.9-10 Pretoria Jan. 2013
RESEARCH ARTICLE
A simulation age-specific tuberculosis model for the Cape Town metropole
Farai NyabadzaI; Dieter WinklerII
IDepartment of Mathematical Sciences, Stellenbosch University, Stellenbosch, South Africa
IIDST/NRF Centre of Excellence in Epidemiological Modelling and Analysis, Stellenbosch University, Stellenbosch, South Africa
ABSTRACT
Tuberculosis (TB) continues to present an insurmountable health burden in the Western Cape Province of South Africa. TB dynamics in adults is different from that in children, with the former determining the latter. Because the dynamics of TB are largely dependent on age, planning for interventions requires reasonable and realistic projections of the incidence across ages. It is thus important to model the dynamics of TB using mathematical models as predictive tools. We considered a TB compartmental model that is age dependent and whose parameters are set as functions of age. The model was fitted to the TB incidence data from the Cape Town metropole. The effective contact rate, a function of both age and time, was changed to fit the model to the notification rates of active TB disease cases. Our simulations illustrate that age structure plays an important role in the dynamics of TB. Projections on the future of the epidemic were made for each age group. The projected results show that TB incidence is likely to increase in the lower age groups of the population. It is clearly evident that even very simple models when applied to limited data can actually give valuable insights. Our results show that the age groups who have the highest incidence rates of active TB disease have the highest contribution in the transmission of TB. Furthermore, interventions should be targeted in the age group 25-34 years.
Keywords: simulation; age-specific model; incidence; tuberculosis; data
Introduction
Mycobacterium tuberculosis (Mtb) is transmitted by airborne particles of bacilli. Tuberculosis (TB) infection results when the bacterium is deposited in the lungs of exposed persons.1-2 A small proportion (approximately 10%)3 of persons progress to active TB and become infectious within the first 2 years of infection, while the remainder remain latently infected. Latent infections are asymptomatic and do not contribute to TB transmission, but they may progress to active TB disease through either endogenous reactivation or exogenous re-infection. Pulmonary TB, which refers to TB in the lungs, is the most common form of TB.4 Adults might suffer from this type of TB many years after a primary infection, arising from either endogenous reactivation of the primary infection or a recent, exogenous re-infection.5
Tuberculosis is a major problem in the Western Cape Province of South Africa. Much research on TB has been done in the last decade.510 The incidence of active TB disease in the Cape Town metropole differs for different age groups. Within the 0-5-year age range, the incidence of active TB disease is quite high, as young children are at higher risk of developing active disease once they are infected.7 Infection in this age group is predominantly as a result of contact with infectious adults in their households. Within the 5-14-year age range, the incidence of active TB disease is surprisingly low. This age group is referred to as the 'golden years'. After age 14, the incidence of TB increases considerably as age increases. Then from 35 years onwards the incidence of TB decreases as age increases.5
Planning for TB interventions requires reasonable and realistic projections of the incidence across the ages because TB dynamics in adults is different from that in children, with the former determining the latter. The parameters should also be age dependent as transmission differs across age.11 There is a general tendency for the age-specific incidence of TB to vary greatly within and between countries over time.1213 This tendency is because of problems in determining TB infection and the effects of HIV which have increased the annual incidence rates of active TB disease since 1990 by two- to threefold in many countries of sub-Saharan Africa.10 A global plan to stop TB - 'The Global Plan to Stop TB 2006-2015' - was launched in 2006. The goals of this programme were twofold: (1) to reach the UN Millennium Development Goal of halting and beginning to reverse the epidemic by 2015 and (2) to halve 1990 levels of TB prevalence and death rates. The plan includes improving TB diagnosis, treatment success rate, TB case finding and TB care, and updating epidemiological projections.14 To achieve up-to-date projections, it is important to build mathematical models that take into account the important dynamics of the disease - such as age.
Many of the mathematical models for TB are of the SEIR compartmental structure, built on four standard compartments of individuals: those who are susceptible (S), latently infected or exposed (E), infectious (I) and recovered (R). To capture the complex transmission dynamics of TB, variations to the standard compartments have been proposed in recent years. For instance Guzzeta et al.15 considered a variant model built around the one proposed by Brooks-Pollock et al.11 in which the infectious class is divided into three sub-compartments in order to distinguish between the three forms of active TB (primary, endogenously reactivated and exogenously re-infected). Some models have considered re-infection and age structure within the same SEIR structural framework.3" So re-infection and age need to be incorporated into TB models because they are two of the most important underlying factors that influence the dynamics of TB. When Vynnycky and Fine16 excluded active TB disease which arose from exogenous re-infection from their model, the fit to observed notification rates was inaccurate. This inaccuracy in their study resulted because about 60% and 80% of the active disease incidence for the 40- and 60-year-olds, respectively, was a result of exogenous re-infection. Models have been successfully used to guide the choice of case finding strategies, approaches to treatment and the establishment of operational targets that will result in the elimination of TB.17-19
It is thus important to model the dynamics of TB taking into consideration age. It is against this background that we look at a basic TB model that incorporates age structure in a homogenous population and apply it to data from the Western Cape Province of South Africa.
Because the data do not take into consideration the HIV status of individuals, we do not model explicitly the effects of HIV on TB dynamics. The model is fitted to data with the aim of making projections on the trends of TB in the Western Cape Province. These projections, performed across age groups, are essential in planning and public health interventions, especially in determining the age groups to target.
Model formulation
We begin by considering a five-state deterministic model comprising individuals who are susceptible to TB infection S(a, f). susceptibles who get vaccinated with BCG V(a, t), individuals with latent TB infection L(a, t), individuals with active TB disease /(a, f). and those who have recovered from active TB disease R(a, t). It is important to note that the state variables, for instance S(a,t), are the number of susceptibles of age a at anytime t. We assume that
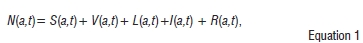
where N(a,t) is the total population size, of age a, at time t.
A proportion ψ(a) is where ψ(a) - [0,1] of susceptibles is vaccinated at age a. Once they are vaccinated, they move into the class of vaccinated individuals. As the immunity of a vaccinated individual wanes, contact with an individual with active TB can result in infection. Upon infection these individuals progress to the compartment of the latently infected. We assume that vaccination reduces the risk of infection. The reduction in the risk of infection is measured by the parameter θ. At age a the risk of infection is θ(a), where θ(a) - [0, 1]. We assume that the vaccine wanes completely by the age of 15 years and provision is made accordingly in the simulations by setting ψ = 0 after age 15. Depending on an individual's immunity, a susceptible individual can either move to the compartment of latently infected individuals if the pathogen is hypovirulent or to the active disease compartment if the pathogen is hypervirulent. A susceptible individual is considered subject to primary progression if he or she develops active TB disease within the first 2 years of infection. We assume that a proportion p(a) of individuals progress slowly to latent TB upon infection. Therefore, if p(a) = 0, all susceptible individuals progress to active TB disease while if p(a) = 1 all susceptible individuals progress slowly to active TB disease. The susceptibles only move out of their state if they come in contact with infectious individuals in compartment /.
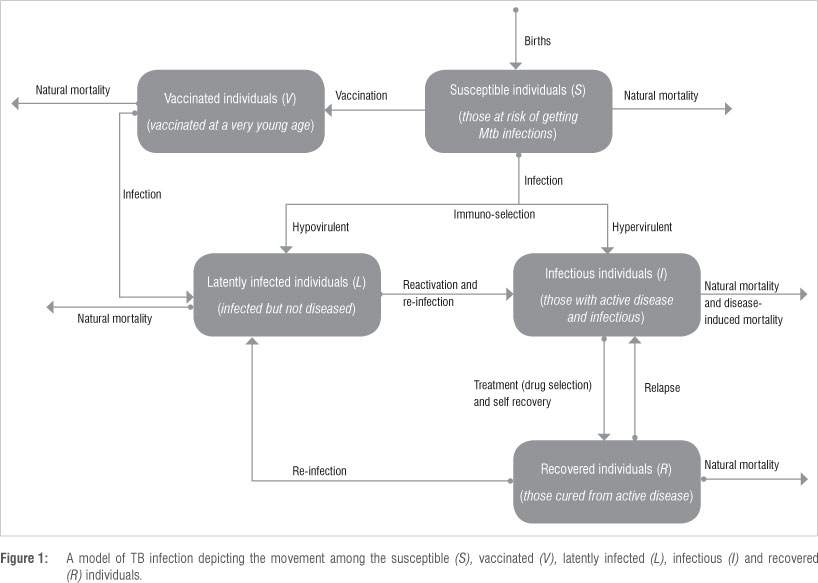
Individuals in the latent compartment can move to the compartment of the active TB disease through two processes: exogenous re-infection and endogenous reactivation. Latently infected individuals can be reinfected with active TB disease if they come into contact with infectious individuals. The parameter associated with the re-infection of latently infected individuals is r,(a). If r1,(a) - (0,1), the susceptibility decreases as a result of a previous history of infection, and if r1,(a) >1, the susceptibility increases as a result of previous infections. Individuals with active TB can recover and move to the compartment of the recovered who can relapse and develop active disease again. The recovered cases can also get re-infected if they come in contact with infectious individuals. Similarly, r2(a) is the parameter linked with the re-infection of recovered individuals. If r2(a) - (0,1), the susceptibility after recovery to re-infection decreases as a result of previous active TB development, and if r1,(a) r1 > 1, the susceptibility after recovery to reinfection increases. The movement between compartments is shown in Figure 1 and the description of the state variables and parameters (rates) is given in Appendix 1 of the online supplementary material.
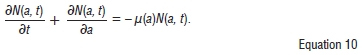
Using Figure 1, together with the model assumptions, we obtain the following system of partial differential equations:
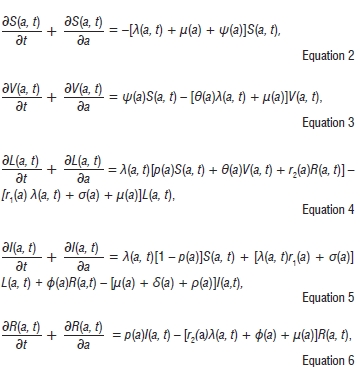
where the force of infection is given by

The transmission of TB occurs through respiratory droplets; therefore the infection process occurs as a result of an effective contact between a susceptible (or vaccinated susceptible) of age a at time f and infectious individuals at time t. The parameter β(a) is the rate of infection of age group a from all other age groups and l(t) is the total incidence at time t. This is synonymous to assuming the equilibrium age distribution of TB incidence through time (see also Murray and Salomon17). The age-specific infection rate is thus given by λ(a, t) with units 1/time.
The partial differential equations (Equations 2-6) describe the change in the state variables with respect to both age and time. The parameters also depend on age - see Appendix 1 of the online supplementary material for detailed descriptions of the parameters and state variables.
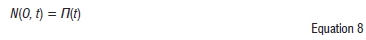
In this system, the number of births and deaths are balanced, while the number of births is equal to the number of people aged 0, N/(Q t) = S{0, t).
The boundary conditions are

The boundary conditions mean that at age 0, we do not have any vaccinated, latent, infective or recovered individuals. We only have births at a non-constant rate /7(t).
By adding the boundary conditions and Equations 2-6 respectively we obtain
and
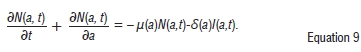
If we take δ to be very small so that δ ≈ 0 then we have:
We can thus show that the population is bounded and the model is epidemiologically well-posed.
Results
The data set of active TB disease notification rates for the Cape Town metropole was obtained from the City of Cape Town Health Department and is displayed in Table 1. The data were collected from the TB clinics of the Cape Town metropole. The Cape Town metropole includes the regions Blaauwberg, Cape Town central, Greater Athlone, Helderberg, Khayelitisha, Mitchell's Plain, Gugulethu, Nyanga, Oostenberg, South Peninsula, Tygerberg Eastern and Tygerberg Western. Data are available for the years 2003-2009 and are categorised into the following age classes: 0-4, 5-14,15-24, 25-34, 35^14, 45-54, 55-64, 65-74 and 75 or older. Data before the year 2003 are deemed to be unreliable and are not included here.
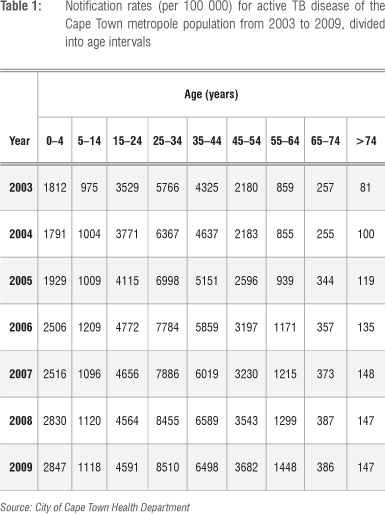
A distinction in the data is made between pulmonary and extrapulmonary TB. However, we considered only pulmonary TB in our study. The pulmonary TB cases are subject to either a positive smear test, negative smear test or no smear test. This data set is certainly important to our study because the data were collected over time and from different age groups. It is thus easier to apply the model to such a data set.
We assume that there is a uniform distribution of notification rates within the age intervals. The uniform distribution was used because we assumed all values within the age range had the same constant probability density. The data of an age interval are divided by the length of the interval to obtain the average notification rate for that interval. We then assume that the average notification rate applies to the midpoint of the interval. The longest age interval of the Cape Town metropole data set is assumed to be 10 years. The modified data for Cape Town metropole are displayed in Table 2.
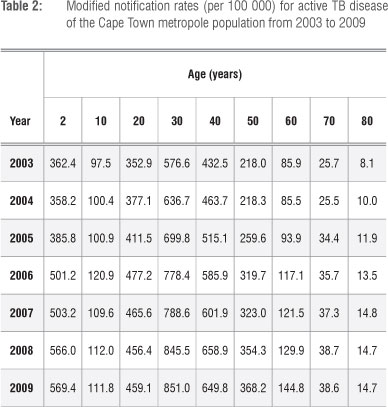
The boundary conditions are assumed to be functions of time and the initial conditions functions of age (see Appendix 2 of the online supplementary material). We modified the conditions according to the total population size of the Cape Town metropole and distributed the total population differently in disease classes. We considered the year 1996 to be the initial year. The boundary condition for the susceptibles is obtained by taking the population of the Cape Town metropole in 1996, multiplying this value by 0.29 (which is the proportion of the individuals aged up to 15 years) and then dividing it by 15 (which is the length of the age interval for which that population is applicable). The boundary condition is also made an increasing function of time in terms of the average annual growth rate of the population.20 We assume that the initial prevalence of active TB disease is 10%.21
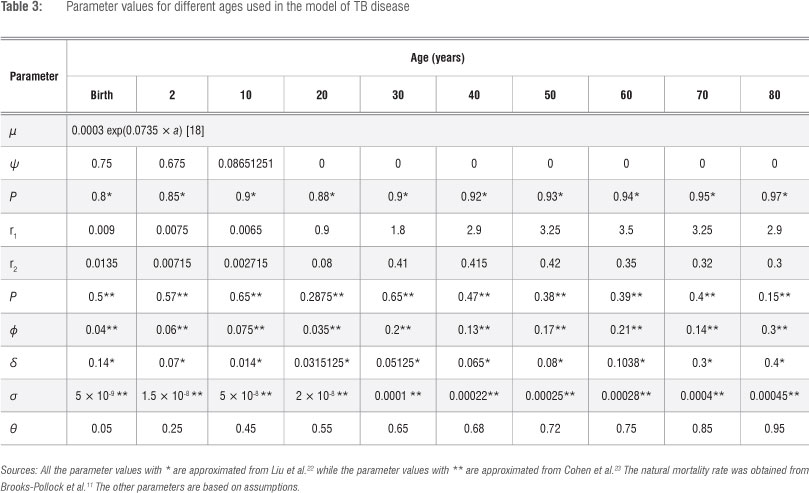
The natural mortality rate is approximated by a Gompertz function because this function produces the most realistic patterns of human mortality by allowing the risk of death to increase exponentially with age.11 The values of the parameters in Table 3 are either assumed or approximated from the literature.
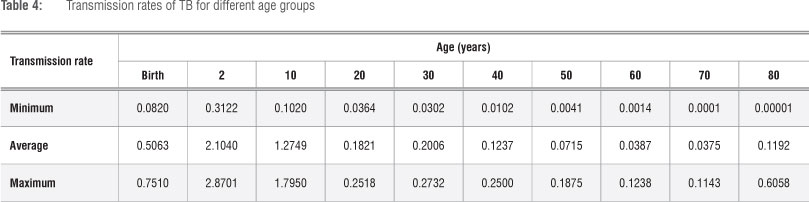
We fitted the effective contact rates (as shown in Table 4) to the data by changing the rates for each age class to fit the data. The fitting process was iterative. With most of the parameters obtained from the literature, the model was fitted to data for a particular age group while iteratively changing the values of p until a range of values were found that gave reasonable fits. The average values for each age group were then chosen to be the representative contact rates and are given in Table 4.
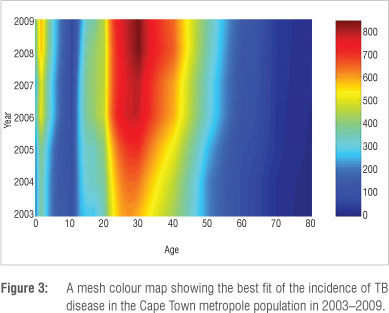
We now use the discretised system of equations (Equations 1-5 in Appendix 3 of the online supplementary material) and fit it to the data of Table 2. By an iterative process that involves changing of parameter values for each age group, we obtain the mesh fit depicted in Figure 2. The figure has a corresponding colour bar to show how the incidence changes over years. Figure 2 is specifically a view from the left-hand side, in order to observe how the incidence of active TB disease appears for the younger ages.
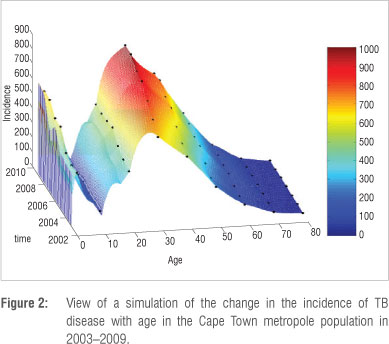
Figure 2 is summarised into a simple and informative mesh colour map shown in Figure 3. The incidence can be interpreted from the adjacent colour bar. It is clear that the incidence is high for the very young and economically productive age groups and low for the older age groups. The highest TB incidence occurs at age 30.
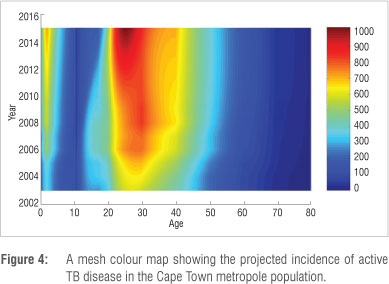
It is important to predict the possible trends of TB over time, not only for planning interventions but also for formulating policies designed to halt the spread of TB. Mathematical modelling can be used to obtain sneak previews into future trends of diseases based on the currently available data. We simulated our model up to the year 2015. Figure 4 depicts the projection until 2015 for active TB disease incidence in the Cape Town metropole as a mesh colour map. All the age groups' projections reflect a significant increase in active TB disease incidence. However, the projected incidence rates for individuals in the 0-4-year, 25-34-year, 35-44-year and 45-54-year age groups reflect the most prominent increases in incidence rates over time. It is important to note that the incidence increases as age decreases. A comparison between Figure 3 and Figure 4 shows that currently the highest incidence of TB occurs at 30 years, whereas in 2015, the projected highest incidence occurs at 25 years.
The simulations of incidence over time for each age group are illustrated in Figure 5a-5c. Here it is important to note that the model fits to the data are discrete for two reasons: the model is discrete and each age group has its own parameters governing the dynamics of TB. All the age groups show an increasing incidence over time. However, the increase was remarkable for individuals in the 0-4-year, 25-34-year, 35-44-year and 45-54-year age groups. The reason for increased TB incidence could be attributed to the adverse effects of HIV, which were not explicitly included in this model. HIV infection causes about a tenfold increase in TB incidence with a much higher risk in patients who have clinically advanced disease.8 However, projected decreases were observed in the 15-24-year age group (Figure 5c) and in those above 65 years (Figure 5h and 5i).
Discussion
Clinical data indicate that the HIV epidemic has played a role in shifting the TB epidemic to younger age groups. In 1996-1997, the largest number of TB notifications was in the age group 40-49. By 2004 it had shifted to the 25-30 year olds.9 Here we propose that mathematical modelling could improve the understanding of TB dynamics in an area with a high HIV prevalence, such as the Western Cape Province. Using routinely collected data from the City of Cape Town Health Department, we applied a simple but reliable TB model. Our results are useful for planning purposes and highlight the importance of age-stratified data for prioritising key age groups to target for interventions.
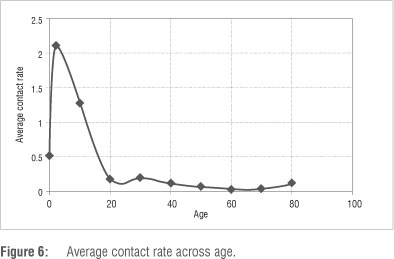
The implications of our findings are that the age groups who have the highest incidence rates of active TB disease also have the highest contribution in the transmission of TB. In the Cape Town metropole, higher incidence rates of TB disease are indicative of co-infection with HIV as the higher rates occur in the sexually active population - those between the ages of 15 and 49 years. During the fitting process, it was interesting to note that there was a direct relationship between mortality as a result of TB and infection rate. We noted that the higher the transmission of TB, the higher the number of disease-induced deaths. This observation is not surprising, especially when we consider the assumption on which the model is built. We have also shown that TB incidence will increase in the lower age groups of the population. It is important to note that the average contact rate decreases with age. TB is easily transmitted to children whose immune systems are generally vulnerable. Figure 6 shows how the average contact rate changes with age, with each marker giving the mean transmission rate for a given age group.
It is important to take epidemiological modelling from a theoretical realm to apply it to real-world scenarios. This process is usually littered with approximation errors, under- and/or overestimation of parameters and flawed modelling exercises. While these factors do not invalidate the usefulness of mathematical models as tools to understand dynamic systems, it is clearly evident that even very simple models applied to limited data can actually give valuable insights. Like every modelling exercise, this work is not without limitations. TB is a disease that is usually influenced by socio-economic conditions. Differences in living conditions should also be further considered. The most important aspect to consider in future models is HIV/AIDS, which will allow us to conclude extrapulmonary TB cases that are linked to HIV.
TB is the most common presenting opportunistic infection in HIV-infected individuals. The routinely collected data used in this model should also include HIV cases stratified according to age, which will increase the robustness of such mathematical models. Indeed, simply focusing on TB alone in an area with high prevalence of HIV, is a sizeable limitation. However, despite these limitations, some interesting results were obtained. Future work should be extended to the whole of South Africa and refinements should be made for as long as these epidemics endure.
Acknowledgements
D.W. acknowledges financial support from the National Research Foundation (South Africa) and the South African Centre for Epidemiological Modelling and Analysis. We thank Judy Caldwell and Karen Jennings from the City of Cape Town Health Department for providing appropriate data for this research work.
Authors' contributions
This work formed part of D.W.'s master's degree. D.W. was responsible for writing the manuscript and F.N. was responsible for structuring the manuscript and supervision of the research work.
References
1. Aparicio JR Capurro AF, Castillo-Chavez C. Transmission and dynamics of tuberculosis on generalized households. J Theor Biol. 2000;206:327-341. http://dx.doi.org/10.1006/jtbi.2000.2129 [ Links ]
2. Gabriela M, Gomes M, Rodrigues R Hilker FM, Mantilla-Beniers NB, Muehlen M, et al. Implications of partial immunity on the prospects for tuberculosis control by post- exposure interventions. J Theor Biol. 2007;248:608-617. http://dx.doi.org/10.1016/jjtbi.2007.06.005 [ Links ]
3. Feng Z, Castillo-Chavez C, Capurro AF. A model for tuberculosis with exogenous reinfection. Theor Popul Biol. 2000;57:235-247. http://dx.doi.org/10.1006/tpbi.2000.1451 [ Links ]
4. Kagina BMN, Abel B, Bowmaker M, Scriba TJ, Gelderbloem S, Smit E, et al. Delaying BCG vaccination from birth to 10 weeks of age may result in an enhanced memory CD4 T cell response. Vaccine. 2009;27:5488-5495. http://dx.doi.Org/10.1016/j.vaccine.2009.06.103 [ Links ]
5. Maartens G, Beyers N. Tuberculosis in the tropics. Clin Chest Med. 2002;23:341 -350. http://dx.doi.Org/10.1016/S0272-5231(01)00004-1 [ Links ]
6. Wood R, Johnstone-Robertson S, Uys R Hargrove J, Middelkoop K, Lawn SD, et al. Tuberculosis transmission to young children in a South African community: Modeling household and community infection risks. Clin Infec Dis. 2010;51:401-408. http://dx.doi.org/10.1086/655129 [ Links ]
7. Van Rie A, Beyers N, Gie RR Kunneke M, Zietsman L, Donald PR. Childhood tuberculosis in an urban population in South Africa: Burden and risk factor. Arch Dis Child. 1999;80:433^137. http://dx.doi.Org/10.1136/adc.80.5.433 [ Links ]
8. Wood R, Maartens G, Lombard CJ. Risk factors for developing tuberculosis in HIV-1 infected adults from communities with a low or very high incidence of tuberculosis. J Acq Immu Def Synd. 2000;23:75-80. [ Links ]
9. Pretorius CD. An investigation into joint HIV and TB epidemics in South Africa [PhD thesis]. Stellenbosch: Stellenbosch University; 2009. [ Links ]
10. Lawn SD, Bekker LG, Middelkoop K, Myer L, Wood R. Impact of HIV infection on the epidemiology of tuberculosis in a peri-urban community in South Africa: The need for age-specific interventions. Clin Infect Dis. 2006;42:1040-1047. http://dx.doi.org/10.1086/501018 [ Links ]
11. Brooks-Pollock E, Long T, Murray M. The impact of realistic age structure in simple models of tuberculosis transmission. PLoS ONE. 2010;5:e8479.
12. Pesut DR Gledovic ZB, Grgurevic AD, Nagorni-Obradovic LM, Adzic TN. Tuberculosis incidence in elderly in Serbia: Key trends in socioeconomic transition. Croat Med J. 2008;49:807-812. http://dx.doi.org/10.3325/cmj.2008.49.807 [ Links ]
13. Yu M-C, Bai K-J, Chang J-H, Lee C-N. Age transition of tuberculosis patients in Taiwan, 1957-2001. J Formos Med Assoc. 2006;105:25-30. http://dx.doi.org/10.1016/S0929-6646 (09)60105-4 [ Links ]
14. World Health Organization. The global plan to stop TB 2011-2015 [document on the Internet]. c2010 [cited 2011 May 10]. Available from: http://www.stoptb.org/assets/documents/global/plan/stopTB2011_insert_FINAL.pdf
15. Guzzetta G, Ajelli M, Yang Z, Merler S, Furlanello C, Kieschner D. Modelling socio-demorgraphy to capture tuberculosis transmission dynamics in a low burden setting. J Theor Biol. 2011 ;289:197-205. http://dx.doi.Org/10.1016/j.jtbi.2011.08.032 [ Links ]
16. Vynnycky E, Fine PEM. The natural history of tuberculosis: the implications of age-dependent risks of disease and the role of reinfection. Epidemiol Infect. 1997;119:183-201. http://dx.d0i.0rg/l0.1017/S0950268897007917 [ Links ]
17. Murray C, Salomon J. Modelling the impact of global tuberculosis control strategies. Proc . Natl Acad Sci USA. 1998;95:13881-13886. http://dx.doi.org/10.1073/pnas.95.23.13881 [ Links ]
18. Dye C, Williams BG. Criteria for the control of drug-resistant tuberculosis. Proc Natl Acad Sci USA. 2000;97:8180-8185. http://dx.doi.org/10.1073/pnas.140102797 [ Links ]
19. Dye C, Williams BG. Eliminating human tuberculosis in the twenty first century. J R Soc Interface. 2008;5:653-662.
20. City of Cape Town: Strategy and Planning. Strategic information and GIS discussion paper: Demographics scenario [homepage on the Internet]. c2010 [cited 2011 June 21]. Available from: http://www.capetown.gov.za/en/Pages/ [ Links ]
21. Lawn SD, Wood R, Wilkinson RJ. Changing concepts of 'latent tuberculosis infection' in patients living with HIVinfection. Clin Devlmmunol. 2011 ;2011:1-9. http://dx.d0i.0rg/l0.1155/2011/980594 [ Links ]
22. Liu L, Zhao X-Q, Zhou Y A tuberculosis model with seasonality. B Math Biol. 2010;72:931-952. http://dx.doi.org/10.1007/s11538-009-9477-8 [ Links ]
23. Cohen T, Colijn C, Finklea B, Murray M. Exogenous re-infection and the dynamics of tuberculosis epidemics: Local effects in a network model of transmission. J R Soci Interface. 2007;4:523-531. http://dx.doi.Org/10.1098/rsif.2006.0193 [ Links ]
 Correspondence:
Farai Nyabadza
Department of Mathematical Sciences
Stellenbosch University, Private Bag X1
Matieland 7600, South Africa
Email: nyabadzaf@sun.ac.za
Received: 16 Feb. 2012
Revised: 13 Apr. 2013
Accepted: 28 Apr. 2013

