


Services on Demand
Article
 English (pdf)
 Article in xml format
 Article references
Indicators

Related links
-
 Cited by Google
 -
 Similars in Google
Share

 Permalink
South African Journal of Science
On-line version ISSN 1996-7489
Print version ISSN 0038-2353
S. Afr. j. sci. vol.109 n.7-8 Pretoria Jan. 2013
RESEARCH ARTICLE
Effect of farming activities on seasonal variation of water quality of Bonsma Dam, KwaZulu-Natal
Ayanda N. ShabalalaI, II; Ludwig CombrinckII, III; Robert McCrindleIV
ICouncil for Geoscience, Pretoria, South Africa
IIDepartment of Geography, Geoinformatics and Meteorology, University of Pretoria, Pretoria, South Africa
IIISpace Geodesy Programme, HartRAO, Hartebeesthoek, South Africa
IVDepartment of Chemistry, Tshwane University of Technology, Pretoria, South Africa
ABSTRACT
Agriculture has both direct and indirect effects on the quality of surface water and groundwater and is among the leading causes of water quality degradation, mainly as a result of the excessive use of agrochemicals. Water samples were collected in a selected catchment area (Bonsma Dam) in KwaZulu-Natal and analysed for physicochemical variables. The concentrations of most of the elements and total dissolved solids, as well as the pH and electrical conductivity values, met the water quality requirements for domestic, agricultural, livestock and aquatic ecosystem uses. However, the inlet streams feeding the dam were found to be eutrophic during the wet season. Analysis of nitrate in the water body of the study area indicated that agricultural applications of manure and fertilisers may be a potential source of nitrate contamination. Most elements were more concentrated in the dam during the wet season. The overall ionic conductivity values were also higher in the wet season, while the pH was lower. The outcome of this work links the concentrations of physicochemical variables to land use, agricultural practice and local geomorphology. Seasonal patterns in the concentration of physicochemical variables occur, as land use, rainfall and farming activities change seasonally, and these concentrations should therefore be determined periodically.
Keywords: agriculture; eutrophication; dairy farming; physicochemical variables
Introduction
South Africa has a robust agricultural industry comprising a well-developed commercial sector and a predominantly subsistence-oriented sector in the rural areas. Agricultural activities range from intensive crop production and mixed farming in winter rainfall and high summer rainfall areas to cattle ranching in the bushveld and sheep farming in more arid regions.1 However, agriculture has both direct and indirect effects on the quality of surface water and groundwater and is among the leading causes of water quality degradation, caused mainly by a high nitrate content, in many parts of the country. As reported by Schilling and Wolter2, agricultural practices can cause pollution of water bodies and, over time, cumulative effects can lead to the depletion of water quality. Typical sources of water pollution associated with agricultural systems include livestock manure, nitrate and phosphate in fertilisers, metals, pathogens, sediments and pesticides. The two most common agricultural pollutants are nitrogen and phosphorus. Many studies have shown that non-point sources of nitrogen from agricultural activities include fertilisers, manure application and leguminous crops. The major point sources include septic tanks and dairy lagoons.3 Elevated nitrate concentrations in water bodies are associated with dairy and poultry operations, barnyards and feedlots.4,5 High concentrations of nitrate in drinking water can be detrimental to both humans and other animals - elevated nitrate concentrations in drinking water can cause methaemoglobinemia in infants and stomach cancer in adults.6
Phosphorus in surface water arises from various sources, including run-off from agricultural soils; domestic, farm and industrial effluents e.g. farm and municipal sewage; silage effluents; groundwater discharge and atmospheric deposition.7 Fields that are intensively fertilised, manured and grazed, lead to excessive accumulation of phosphorus in the soil. This accumulation has a major impact on the transportation of phosphorus in surface runoff. Long-term excessive manure or slurry application can result in the saturation of soils with nutrients, especially phosphorus which is relatively less mobile in soils. The accumulation of phosphorus contributes to the degradation of surface water as a result of accelerated eutrophication. Nitrate, potassium and phosphate in agricultural runoff have potentially serious ecological and public health implications resulting in a variety of problems, such as clogged pipelines, fish mortality and reduced recreational opportunities.8 An excess of these nutrients is also the leading cause of aquatic eutrophication.
A significant relationship exists between stream chemistry and season. For instance, phosphate tends to show little seasonal variation, with concentrations increasing slightly during periods of low run-off and during the dry season, while a decrease in phosphate levels is associated with high rainfall events during summer. Nitrate concentrations also tend to be highest in spring and after high run-off events during the rainy season.9 Climate (rainfall and temperature) and soil types can also strongly influence nitrate leaching. According to Hooda et al.10, the greatest leaching of nitrate occurs after heavy rainfall; however smaller leaching losses can be expected from less permeable soils, such as clay. Manure application in early autumn increases leaching losses, whereas later applications in winter or spring reduce leaching and improve crop nitrogen utilisation.11 In spring, the crop is actively growing and nitrogen demand is greatest, whereas in autumn or early winter more nitrogen will be lost, mostly through leaching.
In general, the concentrations of dissolved trace elements and heavy metals tend to increase during the dry season and decrease in the wet period.12,13 Increasing anthropogenic activities, such as agriculture and mineral processes in the summer, elevate the total concentration of metals. The diluting effect in the rainy season reduces the total concentration of the metals. In order to address increased concerns about water quality degradation as a result of agricultural practices, water quality investigations were carried out with the aim of investigating the impact of farming activities, mainly dairy farming, on the Bonsma Dam, which is situated in Underberg, KwaZulu-Natal.
Dairy farming in the area under study is non-seasonal; therefore farming activities are not restricted to the spring-autumn period. Irrigation of pasture occurs throughout the year, with possible adjustments during the summer (rainy season) to compensate for rainfall and to avoid run-off or loss to groundwater. The contribution of nutrients and pathogens into streams or via run-off to the dam from animal faecal matter and urine is therefore expected to be fairly constant during the year.
Study area background
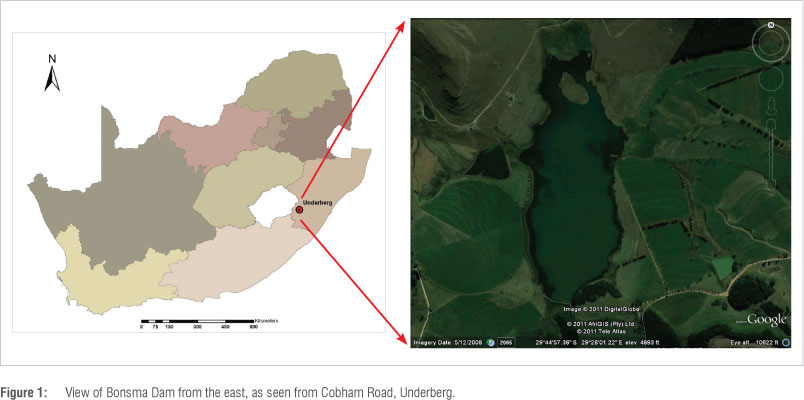
Bonsma Dam (Figure 1) is situated in Underberg, which is a town located beneath the Southern Drakensberg, on the Umzimkhulu River. Underberg started out as a single store built to serve the settlers who had started farming there in 1886. It is predominantly a farming community whose livelihood depends on activities such as grazing, dairy, crops and timber farms with its main economic activity being cattle and sheep ranching. Much of the grassland is grazed by livestock, providing meat and dairy products, employment and a source of income central to the local economy. Bonsma Dam provides drinking water for stock and irrigation water for crops to the surrounding farms. Its location among farmlands makes it vulnerable to pollution associated with agricultural activities, which makes it probable that the quality of the dam water is compromised.
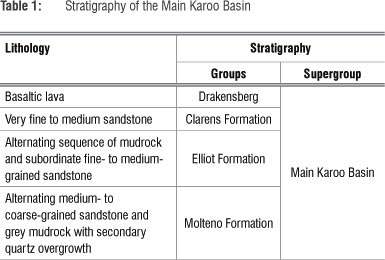
The regional geology consists of lithologies from the Karoo Supergroup. The main Karoo Basin comprises the Drakensberg Group, Clarens Formation (very fine to medium sandstone) and the Elliot Formation (alternating sequence of mudrock and subordinate fine- to medium-grained sandstone), which, in turn, overlays the Molteno Formation (alternating medium to coarse-grained sandstones and grey mudrocks with secondary quartz overgrowth), as can be seen in Table 1. The Drakensberg Group is made up of a succession of solely basaltic lavas.14
Methodology
Sampling of the farm dam was conducted in March 2011 (after the wet season) and October 2011 (after the dry season). This procedure was followed in order to monitor changes in water quality brought about by the seasonal hydrological cycle. Results obtained were used to determine the relationship between water quality and season. A total of 100 samples was collected and a GPS receiver was used to locate appropriate sampling points. Water samples were collected at a depth of 300 mm below the water surface and placed in previously acid-washed, high-density polyethylene bottles, chilled to between 3 °C and 5 °C and despatched in a cooler box to the laboratory where the physicochemical parameters, metals and trace elements were determined to enable the exploration of potential links between water parameters and dam water quality. Water temperature, pH, electrical conductivity and total dissolved solids were determined on-site, using a multiparameter meter ((MX300 Polymate, Mettler Toledo, Schwerzenbach, Switzerland). Cations (Na, Ca, Mg, K, Al and Fe) were analysed using a PerkinElmer SCIEX (Concord, Ontario, Canada) ELAN® 6000 inductively coupled plasma-mass spectrometry system. The water samples were prepared in the laboratory by diluting aliquots of the samples in 16-mL polypropylene autosampler tubes with ultra-pure water (18.2 MΩ) and were acidified with 2% guaranteed reagent grade HNO3. Indium (20 µg/L) and iridium (30 µg/L) were added as internal standards. The calibration standards (Merck KGaA, Darmstadt, Germany) were prepared using a Merck VI multi-element standard (containing 30 elements) and single-element standard solutions for the major elements.15 The concentrations of major ions (Cl, NO3, SO4 and PO4) were determined using ion chromatography (Dionex QIC-IC, Sunnyvale, CA, USA). The results were processed using the Geosoft Oasis montaj16 (Toronto, Canada) mapping and processing system. Sample points were superimposed on a Google® image to illustrate their spatial distribution. Google images typically have a margin of error of about 30 m, so were not georeferenced but were sufficient to indicate approximate locations of the various sampling points. During the dry season, a kayak was used to traverse the dam, allowing easier access to sampling points. Certain areas were difficult to navigate because of plant growth.
Results and discussion
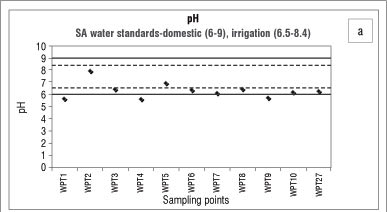
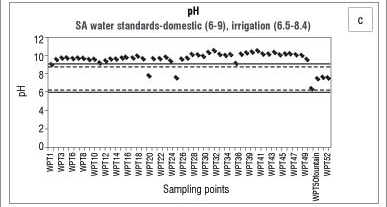
The suitability of water for a particular use can be determined by the total concentration of dissolved mineral constituents in that water. The macroelements are used in part for determining the water quality as well as determining how the concentrations of constituents in the water change over a certain time (trend analysis) or area (spatial analysis). In the wet season, as can be seen in Figure 2a, the pH values of Bonsma Dam water were mostly neutral and fell within the range for drinking water (6-9), as set by the Department of Water Affairs and Forestry (DWAF).17 As a result of high rainfall in summer, a dam can be diluted by rainwater and surface run-off which can lead to low to neutral pH values. In the dry season (Figure 2c), the dam water was highly alkaline (pH>9). A possible explanation for this high alkalinity is the application of calcium-based fertilisers or additives such as agricultural lime by farmers in the area (Table 2). For agricultural purposes the pH of the soil has to be raised through the use of limestone. According to Ometo et al.18, the two minerals typically used for this purpose are calcite (CaCO3) and dolomite (MgCO3), which consequently end up in water bodies and lead to an increase in alkalinity. Brainwood et al.19 observed that, during the dry months, an increase in the pH of a dam is associated with photosynthetic activities, a decrease in rainfall and an increase in water use for irrigation, resulting in an unstable diurnal pH curve. Another factor which can influence the pH of a body of water is the deliberate or inadvertent dumping of chemicals into the water by individuals. This chemical contamination can be caused by packing material (e.g. bags) being disposed off incorrectly and ending up in the streams, allowing fertiliser remnants to enter the water directly. It has been reported that bags have been retrieved from the streams feeding Bonsma Dam.
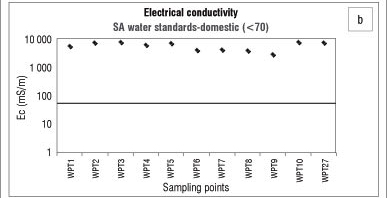
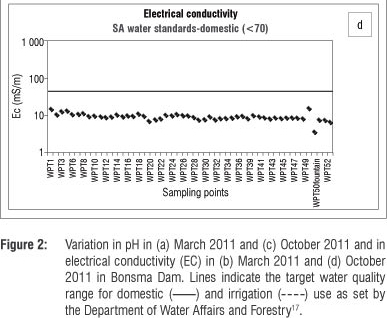

The electrical conductivity limit for water quality17 for water for domestic use is 70 mS/m. Measurements taken in the dry season showed that the electrical conductivity of water in Bonsma Dam was within the limit for water for domestic use (3-16 mS/m). Electrical conductivity was higher in the wet season (Figure 2b) than in the dry season (Figure 2d), possibly because water bodies are recharged during the rainy season and salts and nutrients are leached to the water table. Discharge into streams can also change the conductivity. A sharp increase in electrical conductivity in waterways can also be caused by factors such as the geology and soil of the area as well as land use such as agriculture (irrigation). High chloride, phosphate and nitrate contents associated with agricultural activities are known to increase electrical conductivity.20,21
Nutrients, mainly nitrogen and phosphorous, are applied to croplands in the form of fertilisers to promote plant growth. An excessive amount of these nutrients can cause water quality problems when entering water systems.22,23 Analysis of the water samples from the dam showed that the concentrations of nitrogen, potassium and phosphorous were within the Target Water Quality Range for domestic, irrigation and aquatic ecosystem use. A water body is rendered eutrophic when the concentration17 of nitrate ranges from 2.5 mg/L to 10 mg/L. Nitrate concentrations in the dam remained below 2.5 mg/L in the wet and dry seasons, except at three sampling points (WPT 6, 7 and 8) at which nitrate concentrations were above 2.5 mg/L in the wet season. The three sampling points, seen in Figure 3, were along inlet streams that feed the dam. The combined use of livestock manure and mineral fertilisers results in considerable enrichment of surface soils with nutrients. Overland flow from such areas, during or after a rainfall event, contains relatively high levels of nutrients, organic matter and suspended particles.24 These may be transported by the streams into surface waters, leading to elevated nitrate concentrations.
Eutrophic waters are associated with low levels of species diversity, growth of aquatic plants (specifically reeds at Bonsma Dam) and blooms of blue-green algae.25 Algal blooms may include species which are toxic to humans, livestock and wildlife. Nitrate concentrations tend to be highest in spring and after high run-off events (rainy season) as the water bodies are recharged during the rainy season and salts and nutrients (nitrogen, phosphorous and potassium) are leached to the water table.9,26,27 This leaching also explains why potassium concentrations were higher in the wet season. In the dry season, in which there is no rainfall, potassium concentrations remained within the range for natural waters. Seasonal changes in nitrate concentration are shown in Figure 4 and those for potassium in Figure 5. Negligible amounts of phosphate were present in the dam. According to Cooke et al.28, negligible amounts of phosphate might be because the phosphate is less readily leached out because of its low mobility in soils.
Conductivity in streams and rivers is affected primarily by the geology of the area through which the water flows. For example, streams that run through areas with granite bedrock tend to have lower conductivity,29 as granite is composed of more inert materials that do not ionise (dissolve into ionic components) when washed into the water. The geology of this study area is mainly basalt, sandstone and mudrocks.14 Mudrock is a clay mineral and streams that run through areas with clay soils tend to have higher conductivity,29 as a result of the presence of materials that ionise when washed into the water, which explains the high conductivity values observed following high rainfall events and surface run-offs.
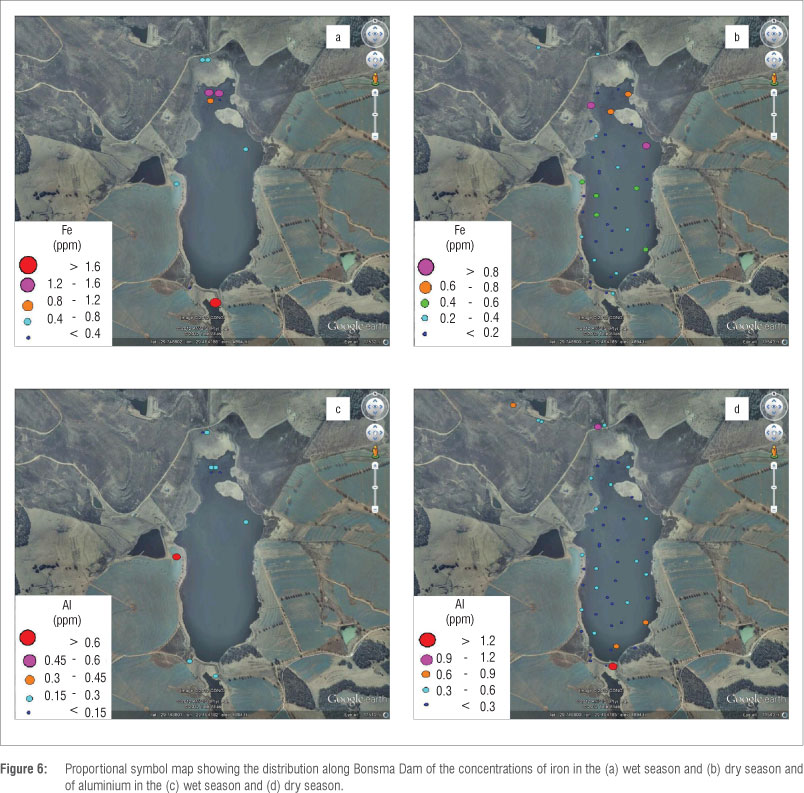
The pH of a body of water is also affected by factors such as the bedrock and soil composition through which the water moves. Some rock types, such as limestone, can, to an extent, neutralise acid, while others, such as granite, have virtually no effect on the pH.30,31 Sandstone, which is found in the study area, essentially consists of quartz. The natural cementing material which binds the sand together to form a rock is usually composed of silica, calcium carbonate or iron oxide. The weathering of this rock may result in the transportation of carbonates that can increase the alkalinity of the water, which can subsequently result in the high pH values that were observed during the dry season. Basalt, which provides a protective capping for the underlying soft sandstone layers of the Underberg, is rich in iron and magnesium and also contains small traces of calcium and aluminium. Therefore, the basalt may partially account for the concentrations of iron, magnesium, calcium and aluminium found in the dam water.
The iron concentration in the dam water ranged from 0.06 mg/L to 1.7 mg/L and thus exceeded the guidelines17 for domestic (0-0.1 mg/L) and aquaculture (0.01 mg/L) use set by DWAF. The highest concentration was recorded in the wet season. The aluminium content of the dam, which ranged from 0.1 mg/L to 1.37 mg/L, did not meet the requirements for domestic (0-0.15 mg/L) or aquatic ecosystem (0-0.005 mg/L) uses. Distribution maps of the concentration of iron and aluminium are presented in Figure 6. The concentration of elements, pH and electrical conductivity measurements of water from Bonsma Dam are presented in Table 3.
Conclusion
The analysis of nitrate in the water body of the study area indicates that agricultural applications of manure and fertilisers may be a potential source of nitrate contamination. We also found that the overall ionic conductivity values were higher in the wet season, while the pH was lower in the wet season. High intensity storms that occur during the wet months (spring/summer) mobilise more salts and nutrient-laden sediments than low intensity rainfall in the dry months (winter), which explains the elevated concentrations of the nutrients, organic matter and suspended solids found in the dam following the wet season. Agricultural run-off, during the rainy season, would raise the conductivity due to the presence of chloride, phosphate and nitrate in the run-off. Rainfall and run-off events explain the low pH values observed during, and after, the wet season. Highly alkaline conditions in the dam during the winter season can be caused by the use of calcium-based fertilisers and additives which, once released into the water, increase the pH. The geology of Underberg, which consists mainly of basalt, sandstone and mudrock, can have a great influence on the overall water quality, as the weathering processes of these rocks may contribute to the content of metals, nutrients and sediments in the reservoir water.
The concentrations of most of the metals studied, as well as the values of the total dissolved solids, pH and electrical conductivity, met the water quality requirements for domestic, agricultural, livestock and aquatic ecosystem uses as set by DWAF. On the other hand, concentrations of nitrate, aluminium and iron were of concern as they exceeded the guidelines set by DWAF for irrigation and aquatic ecosystem uses. The iron and aluminium content of the dam water also did not meet the requirements for domestic use.
Recommendations
The conditions of a water body can fluctuate periodically, so water quality must be measured regularly to observe trends. The results of analyses performed on a single water sample are only valid for the particular location and time at which that sample was taken. Therefore, future work should include the gathering of sufficient data by means of regular or intensive sampling and analysis, in order to assess spatial and/or temporal variations in water quality. The quality of the aquatic environment is described not only in terms of water quality but also in terms of other issues that affect its overall state. Biological life and aquatic vegetation should be investigated and evaluated in order to obtain a complete assessment of the quality of reservoir water.
Acknowledgements
We thank the Council for Geoscience and the Tshwane University of Technology for their assistance in water analysis; the National Research Foundation and the Inkaba yeAfrica project for providing funding for this project; and the reviewers of the original manuscript for constructive comments.
Authors' contributions
A.N.S. drafted the manuscript and performed most of the experiments. A.N.S. and L.C. were responsible for the experimental and project design. R.M. supervised the ICP-OES analysis.
References
1. Goldblatt A. Agriculture: Facts and trends, South Africa [document on the Internet]. c2010 [cited 2012 Oct 22]. Available from: http://awsassets.wwf.org.za/downloads/facts_brochure_mockup_04_b.pdf [ Links ]
2. Schilling KE, Wolter CF. Contribution of base flow to nonpoint source pollution loads in an agricultural watershed. Ground Water. 2001;39(1):49-58. http://dx.doi.org/10.1111/j.1745-6584.2001.tb00350.x
3. Almasri MN, Kaluarachchi JJ. Assessment and management of long-term nitrate pollution of groundwater in agriculture dominated watersheds. Journal of Hydrology. 2004;295:225-245. http://dx.doi.org/10.1016/j.jhydrol.2004.03.013
4. Almasri MN, Kaluarachchi JJ. Multi-criteria decision analysis for the optimal management of nitrate contamination of aquifers. Journal of Environmental Management. 2005;74(4):365-381. http://dx.doi.org/10.1016/j.jenvman.2004.10.006
5. Zebarth BJ, Hii B, Liebscher H, Chipperfield K, Paul JW, Grove G, et al. Agricultural land use practices and nitrate contamination in the Abbotsford Aquifer, British Columbia, Canada. Agriculture, Ecosystems and Environment. 1998;69:99-112. http://dx.doi.org/10.1016/S0167-8809(98)00100-5
6. Anayah FM, Almasri MN. Trends and occurrences of nitrate in the groundwater of the West Bank, Palestine. Applied Geography. 2009;29:588-601. http://dx.doi.org/10.1016/j.apgeog.2009.01.004
7. Ryding SO, Enell M, Wennberg L. Swedish agricultural nonpoint sourcepollution: A summary of research and findings. Lake and Reservoir Management. 1990;6:207-217. http://dx.doi.org/10.1080/07438149009354711
8. Ribaudo M, Johansson R. Water quality: Impacts of agriculture. Agricultural resources and environmental indicators: 2006 edition [document on the Internet]. c2006 [cited 2012 Oct 22]. Available from: www.ers.usda.gov/publications/arei/eib16/eib16_2-2.pdf
9. Brainwood MA, Burgin S, Maheshwari B. Temporal variations in water quality of farm dams: Impacts of land use and water sources. Agriculture Water Management. 2004;70:151-175. http://dx.doi.org/10.1016/j.agwat.2004.03.006
10. Hooda PS, Edwards AC, Anderson HA, Miller A. A review of water quality concerns in livestock farming areas. The Science of the Total Environment. 2000;250:143-167. http://dx.doi.org/10.1016/S0048-9697(00)00373-9
11. Thomsen IK. Crop N utilization and leaching losses as affected by time and method of application of farmyard manure. European Journal of Agronomy. 2005;22:1-9. http://dx.doi.org/10.1016/j.eja.2003.10.008
12. Sarmiento AM, Nieto JM, Olias M, Canovas CR. Hydrochemical characteristics and seasonal influence on the pollution by acid mine drainage in the Odiel river Basin (SW Spain). Applied Geochemistry. 2009;24:697-714. http://dx.doi.org/10.1016/j.apgeochem.2008.12.025
13. Li S, Zhang Q. Risk assessment and seasonal variations of dissolved trace elements and heavy metals in the Upper Han River, China. Journal of Hazardous Materials. 2010;181:1051-1058. http://dx.doi.org/10.1016/j.jhazmat.2010.05.120
14. Johnson MR, Anhaeusser CR, Thomas RJ. The geology of South Africa. Johannesburg/Pretoria: Geological Society of South Africa/Council for Geoscience; 2006. p. 464-486. [ Links ]
15. Perkin Elmer ELAN version 3.0 software guide: Simplify ultra trace analysis. Ontario: Perkin Elmer; 2003. [ Links ]
16. Geosoft. Software for Earth science mapping and processing [program on the Internet]. c2011 [cited 2012 Oct 22]. Available from: http://www.geosoft.com/media/uploads/resources/brochures/ oasis_montaj_b_2013_05.pdf [ Links ]
17. Department of Water Affairs and Forestry. South African water quality guidelines: Volume 1-7 [homepage on the Internet]. c1996 [cited 2012 Oct 22]. Available from: www.dwa.gov.za [ Links ]
18. Ometo JHB, Martinelli LA, Ballester MV Gessner A, Krusche AV, Victoria RL, et al. Effects of land use on water chemistry and macroinvertebrates in two streams of the Piracicaba River Basin, south-east Brazil. Freshwater Biology. 2000;44:327-337. http://dx.doi.org/10.1046/j.1365-2427.2000.00557.x
19. Brainwood MA, Burgin S, Maheshwari B. Temporal variations in water quality of farm dams: Impacts of land use and water sources. Agriculture Water Management. 2004;70:151-175. http://dx.doi.org/10.1016/j.agwat.2004.03.006
20. Acosta JA, Faz A, Jansen B, Kalbitz A, Martinez-Martinez S. Assessment of salinity status in intensively cultivated soils under semiarid climate, Murcia, SE Spain. Journal of Arid Environments. 2011;75:1056-1066. http://dx.doi.org/10.1016/j.jaridenv.2011.05.006
21. Sainato CM, Losinno BN, Malleville HJ. Assessment of contamination by intensive cattle activity through electrical resistivity tomography. Journal of Applied Geophysics. 2012;76:82-91. http://dx.doi.org/10.1016/j.jappgeo.2011.10.010
22. Bernot MJ, Tank JL, Royer TV David MB. Nutrient uptake in streams draining agricultural catchments of the Midwestern United States. Freshwater Biology. 2006;51:499-509. http://dx.doi.org/10.1111/j.1365-2427.2006.01508.x
23. Bilota GS, Brazier RE, Haygarth PM. The impacts of grazing animals on the quality of soils, vegetation, and surface waters in intensively managed grasslands. Advances in Agronomy. 2007;94:237-280. http://dx.doi.org/10.1016/S0065-2113(06)94006-1
24. Khaleel R, Reddy KR, Overcash MR. Transport of potential pollutants in runoff water from land areas receiving animal wastes: A review. Water Research. 1980;14:421-436. http://dx.doi.org/10.1016/0043-1354(80)90206-7
25. Department of Water Affairs. Beware: Toxic cyanobacteria (blue-green algae) [homepage on the Internet]. No date [updated 2011 Dec 14; cited 2012 Oct 22]. Available from: http://www.dwaf.gov.za/iwqs/eutrophication/toxalg.html [ Links ]
26. Blanchard PE, Lerch RN. Watershed vulnerability to losses of agricultural chemicals: Interactions of chemistry, hydrology and land-use. Environmental Science and Technology. 2000;34:3315-3322. http://dx.doi.org/10.1021/es991115+
27. Castillo MM, Allan JD, Brunzell S. Nutrient concentrations and discharges in a Midwestern agricultural catchment. Journal of Environmental Quality. 2000;29:1142-1151. http://dx.doi.org/10.2134/jeq2000.00472425002900040015x
28. Cooke CM, Gove L, Nicholson FA, Cook HF, Beck AJ. Effect of drying and composting biosolids on the movement of nitrate and phosphate through repacked soil columns under steady-state hydrological conditions. Chemosphere. 2001;44:797-804. http://dx.doi.org/10.1016/S0045-6535(00)00293-9
29. USEPA. Monitoring and assessment: 5.9 Conductivity [document on the Internet]. c2012 [cited 2012 Oct 22]. Available from: http://water.epa.gov/type/rsl/monitoring/vms59.cfm [ Links ]
30. Mosher JJ, Klein GC, Marshall AG, Findlay RH. Influence of bedrock geology on dissolved organic matter quality in stream water. Organic Geochemistry. 2010;41:1177-1188. http://dx.doi.org/10.1016/j.orggeochem.2010.08.004
31. Frankenberger J, Esman L. Monitoring water in Indiana: Choices for nonpoint sources and other watershed projects [document on the Internet]. c2012 [cited 2012 Oct 22]. Available from: https://engineering.purdue.edu/watersheds/monitoring/ MonitoringWaterinIndiana.2012.1.pdf
 Correspondence:
Ayanda Shabalala
Council for Geoscience - Water Geoscience
Private Bag X112
Pretoria 0184, South Africa
ashabalala@geoscience.org.za
Received: 05 July 2012
Revised: 31 Oct. 2012
Accepted: 15 Mar. 2013

