


![Dichloro(bis[diphenylthiourea])cadmium complex as a precursor for HDA-capped CdS nanoparticles and their solubility in water](/img/en/prev.gif)


Services on Demand
Article
 English (pdf)
 Article in xml format
 Article references
Indicators

Related links
-
 Cited by Google
 -
 Similars in Google
Share

 Permalink
South African Journal of Science
On-line version ISSN 1996-7489
Print version ISSN 0038-2353
S. Afr. j. sci. vol.109 n.7-8 Pretoria Jan. 2013
REVIEW ARTICLE
International positioning of South African electricity prices and commodity differentiated pricing
George A. Thopil; Anastassios Pouris
Institute of Technological Innovation, University of Pretoria, Pretoria, South Africa
ABSTRACT
The South African electricity industry has seen a dramatic increase in prices over the past 3 years. This increase has been blanketed across all sectors and is based on a number of factors such as sector, usage and, in the case of domestic pricing, suburb. The cost of electricity in South Africa, particularly to the industrial sector, has been among the lowest in the world. In this paper, we analyse the recent price increases in the South African electricity sector and discuss the price determination mechanism employed by Eskom, South Africa's electricity provider. We also analyse the revenue and sales of Eskom and review the electricity price from an international perspective. The concept of differential pricing and international benchmarking is analysed as a possibility for the South African industrial electricity industry, so that all sectors are not adversely affected by across-the-board increases. Our aim is to raise the question of whether South Africa's electricity prices are in line with international increases and to suggest the possibility of differentiated prices in the local electricity sector.
Keywords: electricity; differentiated pricing; Eskom; international pricing; regulation
Introduction
Electricity supply capacity, access and cost play a vital role in the functioning of an economy and are critical for economic growth, social development and poverty alleviation. Because of their monopolistic character and ability to dominate the control of access to and the price of electricity, supply companies have drawn attention to their performance and regulation internationally since the 1990s.1,2
In order to address concerns related to the supply of electricity, governments establish independent groups of experts, called regulators, with statutory powers to set the prices charged by utilities. The regulatory body has two objectives. The first is to address market failures in the provision of electricity, mainly resulting from the monopoly of power that the electricity utility often enjoys. An equally important objective is the task of addressing concerns associated with social accountability regarding the implications of the utility's services for environmental pollution control and issues of public health and safety. The second objective of regulation is to establish an investment-friendly environment capable of attracting capital at a reasonable cost. A healthy regulatory environment provides investors with greater confidence during the process of investment.
However, regulators face their own challenges. They operate in an environment characterised by a lack of relevant and unbiased information, conflicting interests of stakeholders and substantial uncertainty. Furthermore, in developing countries, there is usually a lack of relevant human resources, expertise and research capacity. Regulators use different approaches in order to decide on the appropriate price of electricity. One approach, used most often, is called return on asset regulation. The revenue to be earned by a utility should be equal to the efficiently incurred cost to supply electricity plus a fair rate of return on the regulatory asset base (all productive assets employed by the utility in the supply of electricity). Our objective here is to elaborate on the electricity pricing mechanism in South Africa.
Electricity prices in South Africa
The concept of a regulator is relatively new in South Africa: the National Electricity Regulator (NER) was established only in 1995 and undertook its price-setting responsibilities in relation to Eskom in 2000. Prior to 1994, the government had an agreement with Eskom, in which a decrease of 15% in the real price of electricity was required during the period 1994-2000. With Eskom's priority centring on providing basic electricity to the masses and electrification being the primary focus, generational capacity expansion was shelved. Incremental demand since the mid-1990s culminated in demand exceeding supply capabilities in 2008 with Eskom having to employ load shedding until demand stabilised. The formulation of the Integrated Resources Plan was made with the intention of expanding generation capacity from 2010 to 2030, taking into account multiple possibilities to meet electricity demand.3 The process of expanding generational capacity meant increased revenues for Eskom, primarily by increasing tariffs.
The regulation and determination of electricity prices is performed by the National Energy Regulator of South Africa (NERSA). The electricity pricing scheme employed by NERSA is based on the multi-year pricing determination (MYPD). The MYPD was implemented, based on Eskom's cost recovery requirements, such that the utility remains functioning and sustains itself economically.4 The functioning and economic sustainability of Eskom is vital, considering the significance Eskom plays in the electricity sector in South Africa. MYPD or MYPD1 was formulated for the years 2006/2007 to 2008/2009.
Eskom submitted a petition to NERSA in April 2007 to revaluate the MYPD, based on primary energy cost variances, variances on capital expenditure and rules on a trigger for a reopener based on variations in costs, revenues and initial erroneous estimates.4 The determination was reviewed and an increase of 14.2% in price was agreed on by the regulator. In March 2008, Eskom again applied for a review of the prices based on increasing energy costs. Table 1 shows the variance between the original application and the subsequent applications.
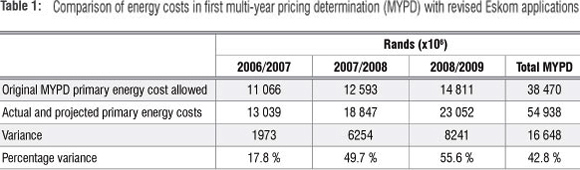
The reasons for the revised application by Eskom were specified as:
- Fuel price volatility, caused by an increase in the fuel commodity (coal, gas) price which directly impacts the price of electricity
- Fuel mix uncertainty, as a result of a variety of power-generation technologies which may cause prices to vary across regions
- Energy demand or volume uncertainty, as a result of changes in economic growth which may cause excess demand, thereby creating uncertainty
- Fuel burn rate efficiency uncertainty, which could be caused by a change in the quality of the type of fuel used to generate an equivalent amount of power
Eskom's revised application requested an increase of 35% per annum over the second MYPD period. The proposed increase in revenue for the MYPD2 period was R98 billion, R132 billion and R180 billion. After a process of stakeholder consultation and public hearings (which included private individuals, small users, intensive users, government departments, political parties and trade unions), the energy regulator decided that the allowed revenues to Eskom, standard average prices and percentage prices would be as shown in Table 2.
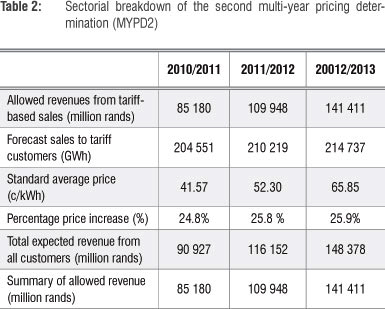
It can be seen from Table 2 that the price increases have been made in line with Eskom's proposed increases. The increases proposed and implemented were applicable to all electricity consumers. Local electricity sales from Eskom can be subdivided into residential, commercial, industrial, mining, agricultural, traction and redistributor (municipalities) categories. Figure 1 shows the total electricity sold per category, excluding sales to redistributors by Eskom, taking into account the ambiguity of sectorial breakdowns of sales and revenue made by redistributors.
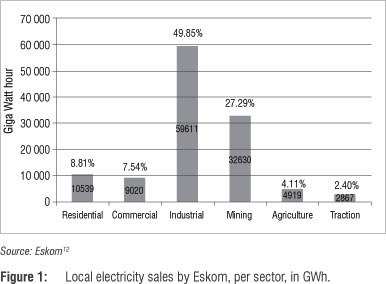
Figure 2 shows the revenue that Eskom receives from the various sectors. It can be seen that two sectors - industrial and mining (the largest two sectors) - contribute 77% of the sales but generate only 67% of the revenue, with the industrial sector showing the largest disparity. This trend can be better observed in the revenue to sales ratio of the percentage contribution, shown in Table 3.
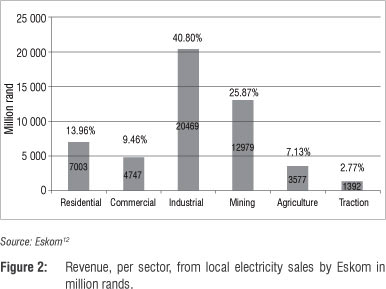
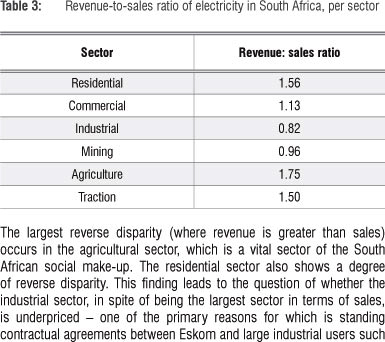
The largest reverse disparity (where revenue is greater than sales) occurs in the agricultural sector, which is a vital sector of the South African social make-up. The residential sector also shows a degree of reverse disparity. This finding leads to the question of whether the industrial sector, in spite of being the largest sector in terms of sales, is underpriced - one of the primary reasons for which is standing contractual agreements between Eskom and large industrial users such as mines. These contracts are equally beneficial for both entities: large industrial users contribute to the largest section of revenue for the utility while being able to keep their utility costs low.
In order to support the argument that the industrial sector is underpriced in South Africa, the electricity supply process in South Africa was compared with a number of other countries. Table 4 shows the comparison of industrial and household electricity prices in a few OECD (Organisation for Economic and Development) countries with those in South Africa. A close inspection of the table shows that the ratio of domestic to industrial prices is a factor between 1 and 2 for all countries except for Mexico, in which industrial prices are higher than domestic prices. In the case of South Africa, the domestic to industrial price factor is between 2 and 3. In other words, the disparity between domestic and industrial prices is greatest for South Africa.
Table 4 also shows that South Africa's industrial electricity prices are among the cheapest in the world. These prices have been kept low historically, and the adverse effects of this situation are now becoming evident. Closer inspection of the prices shows that most countries have either avoided hiking electricity prices or marginally decreased or increased them during the period of 2008-2009, which coincides with the economic downturn. Meanwhile, South Africa's electricity utility has been forced to increase prices significantly to recoup monetary resources to invest in the ever-increasing demand for electricity. These increases have taken place across the board for all sectors and are not synchronised with the increases seen internationally. The average projected prices, based on the MYPD4, are ZAR52.30 c/kWh for 2011/2012 and ZAR65.85 c/kWh for 2012/2013. These prices are averaged across all consumer sectors. Considering the historical disparity in electricity pricing in South Africa, the unilateral increase across all sectors is subject to criticism.
These findings raise further questions. Why does Eskom increase prices equally in the residential and industrial sectors, when the benefits that these sectors receive are not proportional? Is it the best approach to equally increase the prices among all sectors or is a discriminatory approach, favouring particular sectors that will bring better results both for the economy and Eskom, a better option?
Discussion
MYPD1 and MYPD2 are pricing techniques that apply blanket pricing. MYPD is thus a mechanism that is applied across all sectors, which is deemed unfair because of the historical pricing disparity in the electricity sector that has prevailed in South Africa. Alternatives to such blanketed pricing techniques could be applied as substitutes to counter the historical pricing disparities.
Pouris7 discusses the technique of incentive-based regulation (IBR) in the context of international benchmarking as a compensatory mechanism in Eskom's pricing structure. It is mentioned that IBR as a stand-alone policy will not be able to achieve tariffs comparable to prices in competitive markets without the use of international benchmarking.7 Jamasb and Pollitt8 surveyed benchmarking and regulation in the OECD countries as well as the effect of IBR. They found that benchmarking was more prevalent and effective in countries that had highly competitive electricity utility industries, such as European and North American countries. Shuttleworth9 looks into the problems encountered during regulation and recommends techniques on how benchmarking should be used as an objective tool to support regulation.
Another technique that can be used to deal with price increases is differential pricing. Differential pricing is a process of pricing the resources used in the production of different commodities differentially. A utility or institution establishes different price points for different customers based on a number of variables such as customer type, volume, delivery and payment terms. Differential pricing could also be based on the cost of acquiring a raw material to produce a commodity. Prices are also dependent on the consumers' willingness to pay. Lin and Liu10 investigated differential pricing in energy-intensive industries in the
Henan Province of China and Chen11 reports on differential pricing in China from the perspective of energy conservation.
Lin and Liu10 observed five energy-intensive industries and how they responded when differential pricing was introduced. The five industries were (1) the non-ferrous metal smelting and rolling processing industry, (2) the chemical materials and chemical products industry, (3) the non-metallic mineral products industry, (4) the ferrous metal smelting and rolling processing industry and (5) the coal mining and coal industry. In these five industries, eight products - steel, electrolytic aluminium, zinc smelting, calcium carbide, ferrosilicon, cement, caustic soda and polysilicon - were subjected to differential pricing. However, after a year it was found that the profits relating to calcium carbide and caustic soda remained the same, while the profits for the other commodities decreased differentially. The conclusion was that the goal of discouraging energy-intensive industries was not fully accomplished. The reasons stated were that industries could have improved energy efficiency while receiving incentives from the local government. The lack of synchronisation between the local and central government policies was given as a reason for the limited success of the differential electricity pricing policy.
An additional option proposed is that of identifying sectors that are highly energy-intensive and applying a differential or discriminatory pricing mechanism to adjust profits based on energy intensity. The purpose of differential pricing is to confine the development of high energy-intensive industries while promoting the growth of low energy-intensive industries. An observation made on this kind of technique is the change in the energy intensity balance.10 Although energy intensities remained unaffected over a year, the introduction of differential pricing caused profits to vary for dissimilar commodities. The effect of decreasing profits in the long run could force industries to improve production mechanisms, thereby resulting in improved energy intensities. Differential pricing can also be applied based on a time differential, in other words, consumers are charged based on the amount of time they spend using the utility (determined with the help of smart grids), thereby flattening demand profile and improving baseload supply.
In conclusion, current revised pricing mechanisms in South Africa are a result of historical subsidisation of electricity prices. The drawback of subsidising electricity costs, by inference, is that energy-intensive industries increase production, indirectly causing an increase in external cost. While industrial subsidies may be important to sustain productivity and competitiveness, they come at the cost of increasing energy intensity, whereas domestic subsidies come at the cost of decreased revenues. Differential pricing is therefore a technique that offers flexibility within the context of the country's economic, social, industrial and environmental policies.
References
1. Helm D. British utility regulation: Theory, practice and reform. Oxford Rev Econ Pol. 1994;10:17-19. http://dx.doi.org/10.1093/oxrep/10.3.17
2. Crew MA, Kleidorfer PR. Incentive regulation in the United Kingdom and the United States of America: Some lessons. J Regulatory Econ. 1996;9:211-225. http://dx.doi.org/10.1007/BF00133474
3. Department of Energy. Integrated resource plan for electricity 2010-2030. Pretoria: Department of Energy; 2011. [ Links ]
4. National Energy Regulator of South Africa (NERSA). Nersa's decision on Eskom's required revenue application - MYPD 2010/11 to 2012/13 [media statement]. Pretoria: NERSA; 2010. [ Links ]
5. Eurostat. Online energy database [database on the Internet]. c2011 [cited 2011 Dec 02]. Available from: http://epp.eurostat.ec.europa.eu/portal/page/portal/energy/data/database [ Links ]
6. Organisation for Economic Cooperation and Development (OECD). OECD Stat Extracts [document on the Internet]. c2011 [cited 2011 Dec 02]. Available from: http://stats.oecd.org/Index.aspx?datasetcode=SNA_TABLE4 [ Links ]
7. Pouris A. Administered prices in South Africa: The example of Telkom's tariffs. S Afr J Sci. 2004;100:512-514.
8. Jamasb T, Pollitt M. Benchmarking and regulation: International electricity experience. Utilities Policy. 2001;9:107-130. http://dx.doi.org/10.1016/S0957-1787(01)00010-8
9. Shuttleworth G. Benchmarking of electricity networks: Practical problems with its use for regulation. Utilities Policy. 2005;13:310-317. http://dx.doi.org/10.1016/j.jup.2005.01.002
10. Lin B, Liu J. Principles, effects and problems of differential power pricing policy for energy intensive industries in China. Energy. 2011;36:111-118. http://dx.doi.org/10.1016/j.energy.2010.11.001
11. Chen J. China's experiment on the differential electricity pricing policy and the struggle for energy conservation. Energy Policy. 2011;39:5076-5085. http://dx.doi.org/10.1016/j.enpol.2011.06.006
12. Eskom. Annual report 2011. Johannesburg: Eskom; 2011. [ Links ]
13. OECD iLibrary. IEA energy prices and taxes statistics [document on the Internet]. c2011 [cited 2011 Dec 05]. Available from: http://www.oecd-ilibrary.org/energy/data/iea-energy-prices-and-taxes-statistics_eneprice-data-en [ Links ]
 Correspondence:
George Alex Thopil
Graduate School of Technology Management
Room 4-7 Engineering Building 2
University of Pretoria
Pretoria 0083, South Africa
gathopil@gmail.com
Received: 20 Feb. 2012
Revised:21 Nov. 2012
Accepted: 16 Mar. 2013

