


Services on Demand
Article
 English (pdf)
 Article in xml format
 Article references
Indicators

Related links
-
 Cited by Google
 -
 Similars in Google
Share

 Permalink
South African Journal of Science
On-line version ISSN 1996-7489
Print version ISSN 0038-2353
S. Afr. j. sci. vol.109 n.5-6 Pretoria Jan. 2013
REVIEW ARTICLE
Plant metabolomics: A new frontier in phytochemical analysis
Fidele Tugizimana; Lizelle Piater; Ian Dubery
Department of Biochemistry, University of Johannesburg, Johannesburg, South Africa
ABSTRACT
The primary and secondary metabolites found in plant cells are the final recipients of biological information flow. In turn, their levels can influence gene expression and protein stability. Qualitative and quantitative measurements of these metabolites reflect the cellular state under defined conditions, and yield critical insights into the cellular processes that control the biochemical phenotype of the cell, tissue or whole organism. Metabolomics differs from traditional targeted phytochemical analysis in various fundamental aspects; for example, it is a data-driven approach with predictive power that aims to assess all measurable metabolites without any pre-conception or pre-selection. As such, metabolomics is providing new dimensions in the study of systems biology, enabling the in-depth understanding of the intra- and extracellular interactions of plant cells. Metabolomics is also developing into a valuable tool that can be used to monitor and assess gene function, and to characterise post-genomic processes from a broad perspective. Here, we give an overview of the fundamental analytical technologies and subsequent multivariate data analyses involved in plant metabolomics as a research tool to study various aspects of plant biology.
Keywords: chromatography; mass spectrometry; metabolite profiling; multivariate data analysis; nuclear magnetic resonance
Introduction
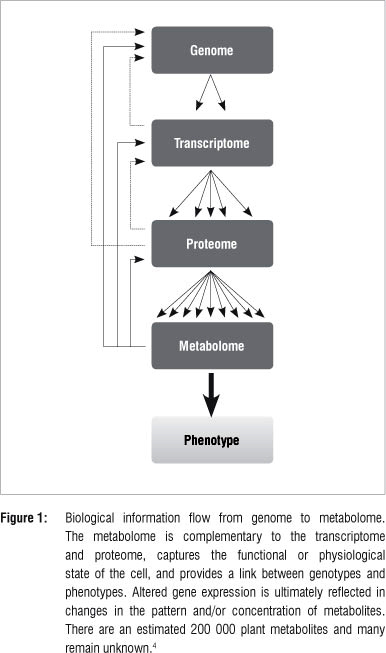
An organism is an expression of its underlying molecular composition that reacts and responds to a variety of intra-, inter- and extracellular stimuli. Whereas genes and proteins are mostly involved in storing and unfolding information needed for actualisation of cellular functional processes, metabolite patterns reveal the actual dynamic cellular environment.1 In plants, the metabolome is a compilation of all primary and secondary metabolites, and can be regarded as the final recipient of genetic information (Figure 1) where levels of individual metabolites can influence gene expression, protein stability and metabolic fluxes.2-5 These constituents of the metabolome have a wide range of physiological roles in plants such as participating in basic functions of the living cell, contributing to cellular structural integrity, acting as mobile inter- and intracellular signals, and being involved in passive and active defence responses in plant cells.2,6,7 Hence, qualitative and quantitative measurements of intracellular metabolites yield critical insights into the cellular processes that control the biochemical phenotype of the cell, tissue or whole organism.1,8,9
Metabolomics and systems biology
Metabolomics developed from metabolic profiling and is the most recent of the '-omics' approaches to emerge. The word 'metabolome' was first suggested in 1998 by Stephen Oliver (University of Manchester, UK) to designate the set of all low molecular mass compounds synthesised by an organism. In 2002, Oliver Fiehn (Max Plank Institute, Golm, Germany) introduced the word 'metabolomics' to designate a comprehensive analysis in which all the metabolites of an organism were supposed to be identified and quantified.4 Metabolomics is generally defined as a holistic qualitative and quantitative analysis of all metabolites present within a biological system under specific conditions.1,3,8,9 It differs from the classical or traditional targeted phytochemical analysis in various fundamental aspects, such as being a data-driven approach with predictive power that aims to assess all measurable metabolites without any pre-conception or pre-selection. In order to attain this goal, advanced analytical tools that provide high degrees of sensitivity, selectivity and reproducibility are required.5,9-11
Metabolomics has become a valuable tool for advancing our understanding of primary and secondary metabolism in plants and is revolutionising the field of plant biology.12 It is viewed as a complementary technique to other functional genomics approaches such as transcriptomics and proteomics. Furthermore, metabolomics is a cornerstone in the integration of the '-omics' technologies that contribute to a systems biology overview.13 As such, it assists in providing a holistic understanding of the organisation principle of cellular functions at different levels, and in providing ways of monitoring all biological processes operating as an integrated system.1,4,6,14 Moreover, metabolomics as a post-genomics tool is often regarded as offering distinct advantages when compared to other '-omics' technologies. This point of view is based on the fact that changes in the transcriptome or proteome do not always correlate to biochemical phenotypes.1,11,15,16
Metabolomic approaches, on the other hand, monitor the ultimate products of gene expression - the metabolites - thus providing a phenotypic assessment of a biological system. Metabolites are organic compounds that may not be directly encoded in the genome, and their biosynthesis often involves a diversity of enzymes. Furthermore, metabolites are stoichiometrically interrelated, which results in more complex metabolic networks that do not exist in the case of transcripts or proteins. Thus, metabolomic strategies may actually offer the most valuable and functional information that is crucial in systems biology studies.1,4,6,13,17
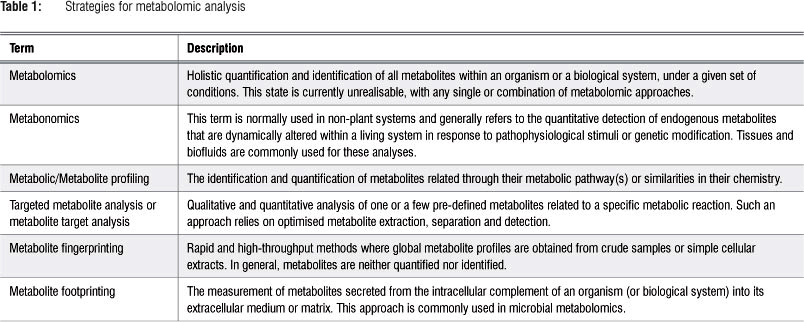
All metabolomic analyses are a snapshot (or a point-in-time chemistry) of a biological system (cell, tissue or whole organism), showing which metabolites are present and their levels at a given time point and under specific physiological conditions.3,9,11,14,18 Different metabolomic strategies have thus been developed for different applications, and are presented in Table 1.9,18-20
The workflow for plant metabolomic analysis
Plant metabolomes can be very diverse. Because of the complexity and divergent physicochemical properties of the cellular metabolome, a combination of two or more metabolomic strategies (outlined in Table 1) may be considered to achieve a comprehensive coverage of the plant metabolome. Furthermore, in any metabolomic approach, a broad metabolic picture is achieved through the combination of multiparallel- and complementary analytical systems, including the use of various extraction protocols.5'6'9'1821
A metabolomic analysis comprises three main experimental stages: (1) preparation of the sample, (2) acquisition of the data using analytical methods and (3) data mining using chemometric methods followed by compound identification. These steps are crucially interrelated' and as illustrated in Figure 2, may each consist of a series of sub-steps. The resulting analysed data from the various experimental phases form the basis for meaningful biochemical interpretation.15,22
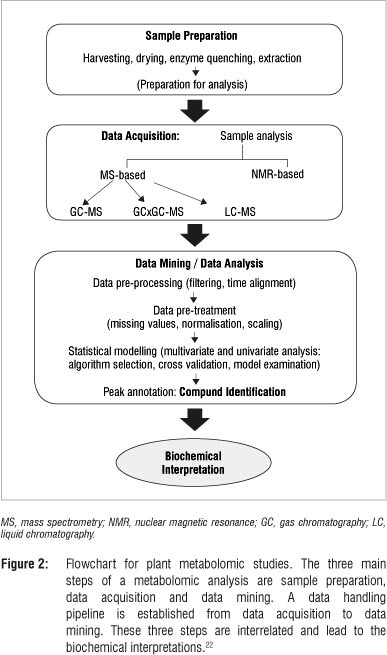
Sample preparation is a critical step in transforming the sample into a solution that can be analysed to make a vital contribution in defining the array of metabolite classes to be covered. This step involves a series of different experimental stages: selection and harvesting of samples, drying or enzyme quenching procedures, extraction of metabolites and preparation of the samples for analysis. The selection of plant material depends mainly on the biological question that the researcher seeks to investigate.22,23 Throughout this step, care must be taken to avoid the introduction of any form of unwanted variability that would significantly affect the outcome of the analysis. Sample degradation (thermal, oxidative or enzymological) and contamination are major factors leading to variations during this step.8,10,24 Various enzyme quenching methods include drying, treatment with acid, use of enzyme inhibitors or high concentrations of organic solvents.4,22
Plant metabolites are structurally diverse, forming a highly complex spectrum of compounds of different size, solubility, volatility, polarity, quantity and stability.1,19,25-27 Any extraction method would certainly produce an inherently multidimensional sample arising from the chemical and physical differences of the constituents.28,29 Several methods may be employed to extract metabolites; the choice of method depends on a variety of factors, such as the physicochemical properties of the target metabolites, the biochemical composition of the system under investigation and the properties of the solvent to be used. Some of the common extraction methods include solvent extraction, supercritical fluid extraction, sonication and solid phase extraction. However, no comprehensive extraction technique exists for the recovery of all classes of compounds with high reproducibility and robustness. Thus, for a comprehensive coverage of different classes of metabolites, extraction methods may be used in combination.5,10,18,19,22
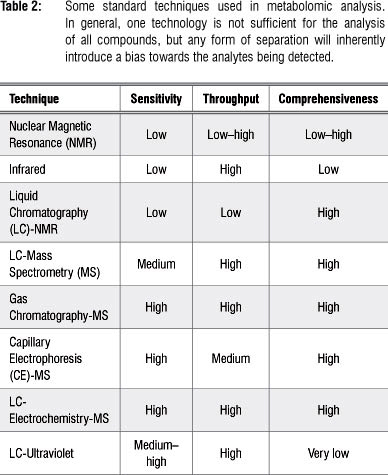
Data acquisition (sample analysis) follows the sample preparation step and requires advanced analytical techniques as the ultracomplexity of samples for metabolomic analysis makes it impossible to technologically separate, quantify and identify every metabolite within a biological sample.1,9 A range of analytical platforms are employed in metabolomic studies (separately or in combination), and each platform has its own advantages and limitations, either in selectivity or sensitivity (Table 2). The choice of the analytical platform depends mainly on the- study at hand, taking into consideration the class of compounds, their chemical and physical properties, and their concentration levels. As such, the techniques most often used are nuclear magnetic resonance spectroscopy3,5,30 and chromatography coupled to MS.9,31
Analytical platforms employed in metabolomics
A range of analytical technologies may be used in metabolomics, including gas chromatography-mass spectrometry (GC-MS), capillary electrophoresis-mass spectrometry (CE-MS), liquid chromatography-mass spectrometry (LC-MS), liquid chromatography-electrochemistry-mass spectrometry (LC-EC-MS), nuclear magnetic resonance (NMR) spectroscopy, LC-NmR, direct infusion mass spectrometry (DIMS), and Fourier-transform infrared (FT-IR)- and Raman spectroscopies.8,10,14,31,32 Of these, chromatography-mass spectrometry (GC-MS and LC-MS) and NMR are the most widely applied.4,5,30,31
The use of NMR-based fingerprinting marked the beginning of metabolomics as a tool in biochemistry and phytochemical analysis.19 It is an unbiased, rapid, non-destructive technique that requires little sample preparation and thus lessens the chance of sample loss or the introduction of variability into the preparation.30 In an NMR analysis, there is no analyte separation process involved (as is the case in chromatographic analyses); NMR can thus provide selectivity without separation, is independent of analyte polarity, and does not require sample derivatisation prior to analysis. The magnetic properties of paramagnetic (e.g. 1H and 13C) nuclei allow for a powerful tool for observing the environments of such nuclei bonded all over a molecular skeleton. When samples in a deuterated solvent are placed in a strong magnetic field and irradiated with a radio frequency, the absorption of energy allows the nuclei to be promoted from low-energy to high-energy- spin states. The subsequent emission of radiation during the relaxation process generates the resonances or signals recorded on an NMR spectrum as 'chemical shifts', representing frequencies from all NMR-visible nuclei in the sample, relative to that of a reference proton present in a reference compound. Thus, an NMR spectrum of a multicomponent extract is the result of the superposition of the collective spectra of all NMR-visible individual compounds present in the sample under study. Hence, an NMR analysis would generally give a global view of all the metabolites (primary and secondary) in a sample, provided that they are NMR detectable.5,30 In NMR spectroscopy, the signal intensity for all compounds is dependent on the molar concentrations and reproducibility is high, even though the sensitivity is relatively low (micromolar range) and more sample is required.3,5 Following data acquisition, it is necessary to apply solvent suppression techniques, baseline or background correction, and integration and data normalisation methods.30
Although NMR spectroscopy can yield detailed information on the quantities and identities of metabolites present in extracts, the chemical elucidation of NMR-detected compounds can be highly complex as a result of overlapping signals and shielding effects by neighbouring electrons. Moreover, the inherent low sensitivity of NMR, its sensitivity to the chemical environment (pH, ionic strength, temperature, etc.) of the sample and the differential sensitivity of metabolites to the chemical environment, hamper the quality of NMR analyses of complex samples.30,33 However, the disadvantages of low sensitivity and resolution are addressed by the development of cryogenic probes, higher strength superconducting magnets, miniaturised radio frequency coils and multidimensional (e.g. 2D-J-resolved and heteronuclear single quantum coherence) techniques.5,30,34 By using 2D-NMR that spreads the spectral content over a two-dimensional plane, the identification of compounds can be facilitated and minor compounds can be better observed, even allowing for structural elucidation in crude extracts.3,5,30
Column chromatographic techniques (GC/LC), on the other hand, have medium and high sensitivity, and provide separation of the sample components based on the partitioning of an analyte between stationary and mobile phases, according to its physicochemical properties. A better chromatographic separation of an inherently multidimensional sample can significantly enhance the quality of MS analysis and subsequent- compound identification by reducing the complexity of the mass spectra and the matrix effect. To optimise chromatographic separation of such complex samples, factors including column chemistry, the elution method for LC (gradient or isocratic) and the programmed-temperature method for GC are to be considered. Recent developments in enhancing chromatographic separation of complex samples include the use of multidimensional separation systems such as two-dimensional gas chromatography (GCxGC) and two-dimensional liquid chromatography (LCxLC). Separation involved in these techniques is based on the orthogonality of the two columns (of different chemistries) used. These techniques thus permit an improved chromatographic separation of complex samples by providing an expanded separation space, thereby minimising possible co-elution of an analyte or one-dimensional peak overlap.35-38
Coupled to MS detection, these chromatographic techniques are more sensitive and capable of detecting metabolites in low abundance. GC-MS is a versatile, robust, technically reproducible and sensitive technique in the nano- to picomolar range. It is well suited to non-targeted metabolite profiling of volatile and thermally stable non-polar or derivatised polar metabolites or the targeted analysis of derivatised primary metabolites.39 LC-MS, on the other hand, is technically more demanding, but caters well for metabolites that are non-volatile, polar or thermally labile. In plant metabolomics, LC-MS is frequently used to profile secondary metabolites. As chromatographic separation is based on the chemical nature of the analytes and that of the stationary and mobile phases of the column, more than one type of column chemistry might be needed to cover a wide range of analyte classes, especially for secondary metabolites. In combination with EsI-MS (electron spray ionisation-MS) it offers a powerful and sensitive technique in the pico- to femtomolar range.1,31
Here, the detection of the mass-to-charge ratio (m/z) and abundance of the various analytes generated during ionisation is a key aspect of the analysis. The three main components in all types of MS instruments are (1) an ionisation source such as electron impact- (EI), electrospray-(ESI) and atmospheric pressure chemical (API) ionisations, (2) a mass analyser such as time-of-flight, quadrupole mass filters and quadrupole ion traps and (3) a detector such as an electron multiplier-based detector or a micro-channel plate linked to a time-to-digital converter. To optimise the transmission of ions to the analyser and detector, all three MS components are maintained under vacuum. The detected ions are recorded as pairs of m/z and abundance values, processed, and displayed in a mass spectral format.14,31 To enhance detection efficiency, mass resolving power and mass accuracy of MS, various technologies (in ionisation methods, mass analysers and detectors) have been developed for different applications and for use in multi-MS platforms.14,40-43
In plant metabolomic analyses, MS is the key platform for compound identification, an essential step in the workflow of any metabolomic analysis. The mass spectral data provides a pattern that is most often compound specific. However, the degree of certainty in elucidating the structural and chemical identity of an MS-detected analyte relies on the efficiency and accuracy of the three principal processes of the MS (ionisation, m/z analysis/manipulation and ion detection) and on appropriate algorithms. The procedure in metabolite assignments from MS data consists of: (1) acquisition of sufficient and accurate structural information (such as accurate mass measurement and fragmentation patterns), (2) calculation of chemical combinations that fit the measured accurate mass (elemental composition formula), (3) spectral comparison (mostly for GC-MS instruments) or a database search and verification of the fragmentation pattern (for LC-MS instruments), (4) the use of other MS information available such as MSn and MSE data (the latter is a form of non-selective MSn where E is collision energy) and (5) the use of authentic pure standards (when commercially available) or 13C materials as internal standards.14,15,44,45
The usage of parallel analytical platforms can provide additional information or confirmation for a putatively identified metabolite. For example, EI ionisation is the most commonly used GC-MS ionisation technique that generates informative and characteristic mass spectra resulting from the relative high degree of fragmentation which aids in- compound identification. In contrast, ESI-MS, used in LC-MS, usually generates [M+H] + and [M-H]- ions as the main signals, and these ions are useful for reducing the candidate structures of detected compounds. GC-EI-MS is thus a good approach for targeted analysis of known primary metabolites, whereas LC-ESI-MS is good for untargeted analysis of secondary metabolites.14,15,34,44,45
Data mining and data processing
High-performance instrumentation as described generates extremely large volumes of data. In order to handle these large data sets and to comprehend the metabolome data, automated software is needed that can identify peaks from raw data, align the peaks among different samples and replicates, and identify and quantify each metabolite. Informatics and statistics are therefore essential tools for processing metabolomic data sets.33,46,47 Data mining comprises data pre-processing, data pre-treatment and statistical modelling of the primary data (Figure 2). The statistical modelling (which is essential and central in data analysis) is briefly explained below and the reader is referred to more advanced discussions of the topic.46,47
Because metabolomic analyses reflect the cellular state under defined conditions, metabolomic experiments are designed in such a way as to measure the biological variation in the metabolome.5,18 However, the total variation in the metabolomic data is actually the sum of the pre-defined or induced biological variation and all other variations (non-induced biological, technical and analytical variation). Hence, in the data mining step the procedures of data pre-processing and data pre-treatment aid in 'cleaning' the data to focus on the biologically relevant information. Various software packages (which depend on the analytical technique employed for data acquisition) have been developed to aid with data mining in an automated manner.9,48
Some of the data pre-treatment methods include centring, scaling and transformation. The centring procedure enables the conversion of all concentrations to fluctuate around the zero value of coordinates, by calculating the average of each variable and subtracting it from each observation. This process adjusts differences in the offset between high and low levels of compounds in samples. It thus simplifies the estimation of regression coefficients. Scaling, on the other hand, involves dividing each variable by a function related to its standard deviation (scaling factor) to adjust for the variation in fold differences between detected metabolites. Lastly, mathematical transformation processes are performed on the raw data because of the possibility of non-linearity in variables from a biological system. These methods transform the data into data matrices suitable for linear modelling techniques by converting multiplicative relations into additive relations, and correcting for heteroscedasticity (random variables with different variability).47-49 The cleaned data are then subjected to statistical analysis which provides model-based descriptions of the biological variation in the system under study. These statistical models specifically single out representatives of metabolites of interest (annotated peaks), which can further be chemically or structurally identified in a definitive manner.
Statistical modelling and multivariate data analysis
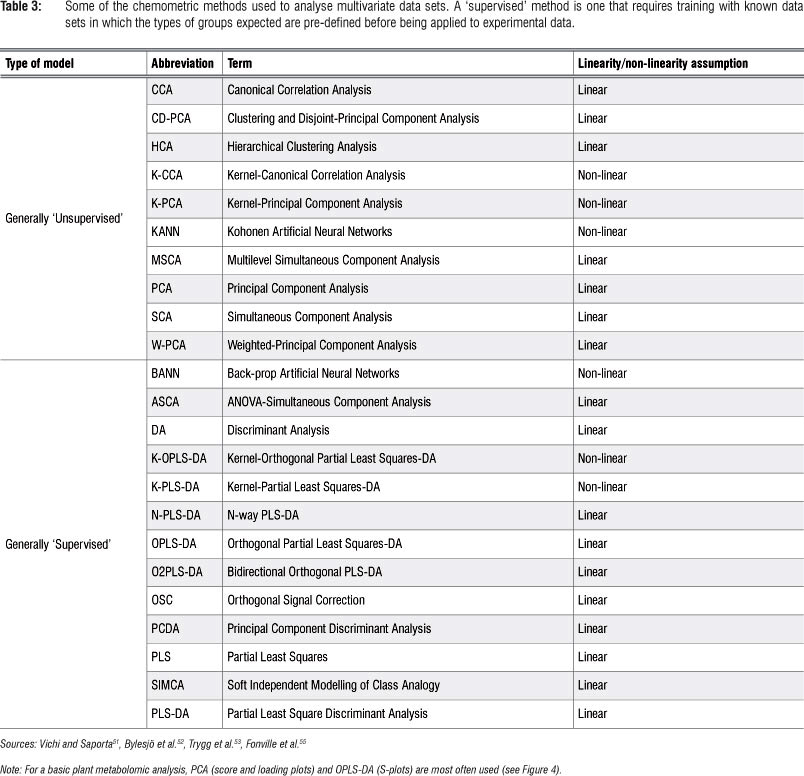
Metabolomic studies generally generate high-dimensional and complex data sets that are difficult to analyse and interpret by visual inspection or any traditional univariate statistical analyses. Multivariate data analysis (MVDA) methods - mathematical modelling approaches - are therefore used to extract meaningful information from these large empirical data sets.4,49-51 These chemometric techniques provide models that are well suited to handle confounding and covariance patterns (both within and between variables) - analyses that are normally beyond the capacity of traditional univariate statistical methods.52-54 Table 3 lists a number of chemometric methods that are used for MVDA. Depending on the research objectives, the most appropriate method should be exploited. Detailed explanations of the mathematical algorithms on which these chemometric models are based, can be found in the cited literature. It may suffice to underline that most of these MVDA models are projection-based methods and apply, in an expanded manner, the- eigenvector/eigenvalues and kernel algebraic notions. Furthermore, these methods are based on the notion of latent variables (assuming that the system under consideration is driven by a definable number of latent variables) that assume a linear (or non-linear) relationship between the descriptor and response variables (see Figure 3: X and Y matrices: observed variables and pre-defined response outputs).53-55
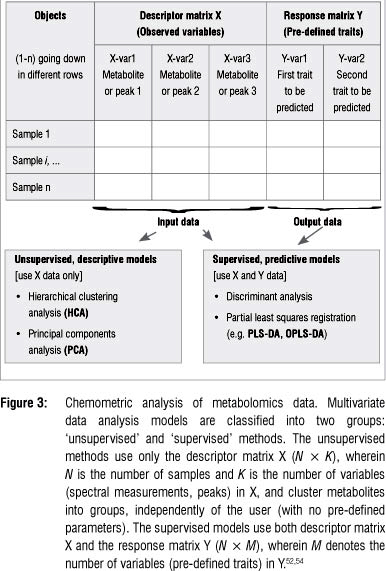
The high-dimensional and complex metabolomic data can be chemometrically analysed in unsupervised and supervised ways (Table 3 and Figure 3). The unsupervised modelling of the data focuses on the intrinsic structure, relations and interconnectedness of the data and is sometimes referred to as descriptive models. Supervised modelling, on the other hand, seeks to transform the multivariate data from metabolite profiles into a representation of biological interest under the guidance of a 'supervisor'. These models are often called predictive models. The basis of supervised modelling is that there are some patterns (such as metabolic fingerprints) in data that have predefined responses (such as effects of a treatment or condition), and the goal of supervised methods is to find a model or mapping that will correctly associate the inputs with the responses.54 The data is thus algebraically represented in two types of matrices - the descriptor- matrix X (observed variables) and the response matrix Y (the pre-defined traits). Geometrically, a multivariate modelling process defines a point in K-dimensional space with the descriptor values as coordinates.53,54,56 The unsupervised methods are non-parametric analyses and generate models that are independent of the user. The input data, the descriptor matrix X, is presented into the system, which then simplifies and reduces the dimensionality of the data sets, grouping metabolites into different clusters with no loss of information. The supervised models, on the other hand, are mathematical transformations that correctly relate the descriptor matrix X with the response matrix γ.46,53,54,56
In many metabolomic studies, principal component analysis (PCA) - an unsupervised multivariate linear model - and orthogonal projection to latent structures-discriminant analysis (OPLS-DA) - a supervised model - are often used for data analysis. In all unsupervised chemometric methods, PCA remains the workhorse and gold standard model to deal with high-dimensional and complex data sets.46,53 PCA is a projection-based method and a mathematically rigorous process that provides a global and qualitative visual representation of similarity or dissimilarity between and within samples (without using class information; e.g. treatment vs. control).46
In PCA modelling, the variance in a data set is algebraically described in terms of underlying orthogonal variables, also called principal components (PCs). The original variables are thus expressed as linear combinations of these PCs (latent variables), each consisting of two parts - a score (ti) and loading (pi). All PCs are mutually linearly orthogonal to each other and each PC counts for a portion of the total variance in the data set, the first two or three PCs accounting for the largest part of the total variance. The descriptor matrix X is thus mathematically projected into a low-dimensional space, providing interpretable visualisation of the original complex data set thereby highlighting similarities or differences. The score plot gives information about relationships between objects (e.g. trends, groupings and outliers). The Y- and X-axes (e.g. PC1 vs. PC2) of a score plot illustrate the variation within and between groups, respectively. The loading plot illustrates the putative discriminating variables responsible for sample clustering and also explains the variation in scores.46,53,54 Figure 4a and 4b illustrate typical PCA-derived score and loading plots, respectively.
OPLS-DA is a linear regression method, which has been successfully used for prediction modelling in metabolomics and biochemical applications.52,53,55 It is a supervised classification model that differs from PCA by the addition of grouping variables that indicate in which class the samples belong. Where PCA modelling is a descriptive method, OPLS-DA method is an explicative or predictive analysis. The latter facilitates the identification of the metabolite ions responsible for the discrimination between groups.57,58
OPLS-DA is a modification of the PLS-DA (projection to latent structures-discriminant analysis) method, with an integral orthogonal signal correction filter. The OPLS-DA modelling aims at finding predictive components that simultaneously maximise the covariance and correlation between X and Y matrices.57 Algebraically, the model uses information in the response matrix Y to decompose the descriptor matrix X into correlated, orthogonal and residual structures of information, respectively. The power of this regression model lies in its ability to separate modelling of Y-predictive (response-related)- and systematic Y-orthogonal (response-orthogonal) variations in data, while simultaneously maximising the covariance between X and Y. The Y-orthogonal variation can be described as systematic effects needed to characterise the system but are unrelated to the model predictions.52,55,57
OPLS-DA methods therefore model data according to a priori class information (such as treated vs. non-treated) assigned to samples before the analysis. This separation of Y-predictive (discriminating) variation and Y-orthogonal variation (that which does not contribute to the class separation) greatly facilitates the data interpretation. As such, the OPLS-DA model is a suitable tool to extract information on changes or differences in the molecular composition of samples (Figure 4c). While the OPLS-DA loading S-plot (Figure 4d) enables the extraction of statistically and potentially biochemically significant metabolites or biomarkers in the samples, the more advanced shared-and-unique-structures plot (not shown) enables the identification of metabolites that are shared between groups or that are unique to a group.53,57,59
Compound identification
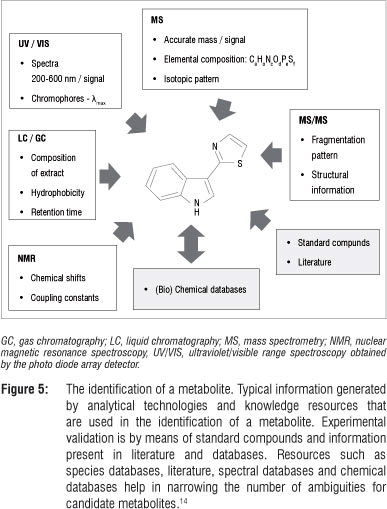
Compound identification, the last step in metabolomic analyses, is of great importance because biochemical interpretation of metabolomic data relies heavily on the availability of well-structured databases for the identification of metabolites. In putative identification some molecular properties (such as experimentally determined accurate mass) and mass spectral patterns are used to define molecular and empirical formulae from which metabolites can be derived or identified by comparative searches of available spectral, compound and metabolic pathway databases.15,34 In such identification procedures, chemical standards are normally not used and the putatively identified metabolites are usually reported with a defined degree of certainty.14,15,57 Definitive identification, on the other hand, involves the use of more than two molecular properties (retention time, retention index, mass spectral fragmentation, NMR-spectral shifts), comparative searches of libraries (mass spectral, NMR-spectral, retention index), confirmation with authentic chemical standards and the use of in vivo labelling methods.15,18,60 In some instances, analytically detected entities of biological significance are reported as unknown with no structural identification.10,15,18,31 Figure 5 schematically illustrates typical information generated from different analytical methods, aiding the identification of compounds in a metabolomic analysis.
Applications of metabolomics in plant research
Despite present limitations, metabolomics has proved to be an indispensable tool for characterisation of post-genomic processes in plants with a broader perspective. The uniqueness of metabolomics, firstly, is that it is a data-driven approach with mathematically rigorous data analysis methods and, secondly, is that it has the ability to provide a (relatively) holistic analysis of the actual cellular dynamisms of a biological system under consideration. Metabolomic analyses offer ways of elucidating relationships that occur primarily through regulation at the metabolic level and reveal a direct link between a gene sequence and the function of the metabolic network.1,6,8,54,61
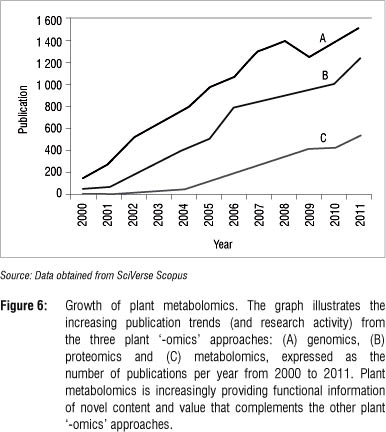
Plant metabolomics is still a relatively young field. Figure 6 shows the increase in publications in plant metabolomics relative to those related to genomics and proteomics. Metabolomic strategies have much to offer and are increasingly being applied in various areas of the plant sciences.62 This increase in publications is the result of a divergence in the use of the new technology where different metabolomic approaches (Table 1) is combined with one or more analytical platforms (Table 2).
Broad research areas where metabolomics are applied include the interpretation of metabolic pathways and networks, biomarker discovery that can assist in the identification of novel molecular targets and bioactive metabolites,59,63-65 genotyping,1,8,16 gene function elucidation,66-68 plant breeding and crop quality assessment,18,20,69-71 the discovery of metabolites involved in environmental adaptations, abiotic and biotic stress responses, host-pathogen interactions,72-79 molecular biotechnology, and recombinant DNA technology, including risk assessment of genetically modified crops.34
Metabolomics can be an effective approach for the comprehensive evaluation of the qualities of medicinal plants.80 The combination of NMR spectroscopy and MVDA was used in a chemotaxonomic study of Ilex paraguariensis (a tonic and medicinal plant) and other Ilex species.81 Distinct discrimination of species was observed, based on a large number of metabolites present in organic and aqueous fractions. The major metabolites that contributed to the discrimination were identified as arbutin, caffeine, phenylpropanoids and theobromine. Among those metabolites, arbutin, which had not been reported as a constituent of Ilex species, was found to be a biomarker in 8 of the 11 species investigated. With regards to the mining of medicinal plants for the discovery of bioactive metabolites, metabolomics has so far been a valuable tool for high-throughput screening of bioactive substances in order to discover new phytotherapeutic agents with high selectivity, unique modes of action and acceptable toxicological profiles.80
In the development of novel herbicides and pesticides, metabolomics is an invaluable tool because of its non-targeted nature. Modes of action of herbicides determine how plants respond to these chemicals and can be used to predict the suitability of new lead compounds. Here, applications of metabolomics in agroecosystems also include the investigation of ecotoxicological risk assessment of these bioactive compounds.82,83
Ecometabolomic studies were the subject of a recent review 83 concerning investigation into the responses of some metabolic pathways in plants to changes in abiotic factors (such as temperature, water, nutrient availability and pollution) and the biotic interactions between two or more species, which provided new biochemical insights that can be useful for systems biology and metabolic or genetic engineering.
NMR-based and MS-based metabolic fingerprints allowed the investigation of a range of chemistries, adding insight into the metabolic changes associated with establishment of disease in Arabidopsis thaliana leaves infected with Pseudomonas syringaeJ6 Significant alterations in the levels of amino acids and other nitrogenous compounds, as well as specific classes of glucosinolates, disaccharides and molecules that influence the prevalence of reactive oxygen species involved in defence signalling were identified. The findings suggest that, superimposed on defence suppression, pathogens reconfigure host metabolism to provide the sustenance required to support exponentially growing populations of apoplastically localised bacteria.
To obtain further insight into the interaction between plants and herbivores, the interaction between cabbage (Brassica oleracea) and small cabbage white caterpillars (Pieris rapae) was analysed by LC-MS.69 This study revealed a high correlation in levels of three structurally related coumaroylquinic acids in both plants and caterpillars, which suggests that these compounds represent a 'metabolic interface' in the interaction between the plant and the caterpillars.
Another NMR-based metabolomic analysis of the metabolome of tobacco plants treated with salt contributed to the understanding of the dosage and duration dependence of salinity effects on plant metabolism.73 The results showed that salinity causes alterations in widespread metabolic networks involving, inter alia, transamination, the tricarboxylic acid cycle, glutamate-mediated proline biosynthesis and shikimate-mediated secondary metabolism. These results evidenced the valuable insights provided by metabolomic approaches in understanding the osmotic effects on plant biochemistry.
The composition of secondary metabolites greatly influences the quality and health potential of food and food products, in particular, flavonoids as a result of their antioxidant properties. Bovy and co-workers84 highlighted the potential of GC-MS and LC-MS based metabolomics in profiling the metabolic changes in the flavonoid biosynthetic pathway of genetically engineered tomatoes and in monitoring the flux into newly introduced branches of the flavonoid pathway, such as stilbenes, aurones, chalcones, anthocyanins and flavones.
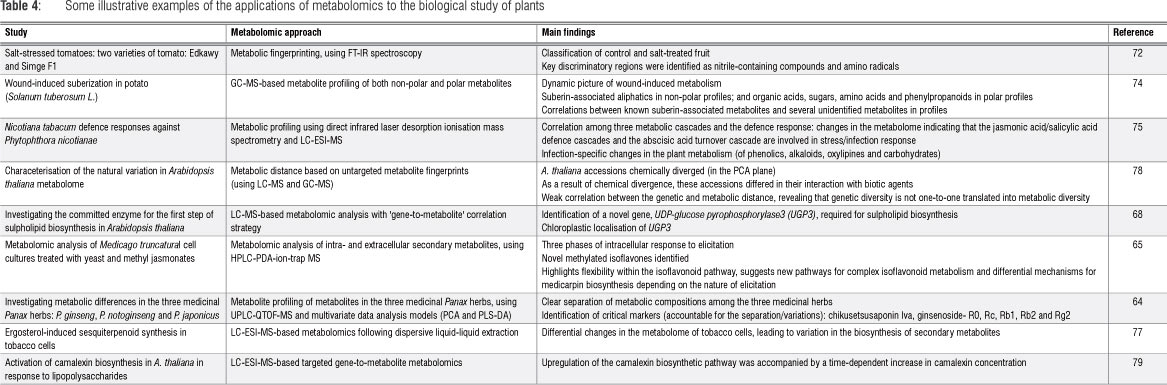
Further selected examples (Table 4) illustrate the wide and divergent range of applications of metabolomics and metabolomic approaches in modern plant sciences.
Current limitations of metabolomics
One of the main challenges of plant metabolomic studies is the enormous complexity and diversity of the plant metabolome and the incomplete knowledge of plant metabolic pathways. Plant primary and secondary metabolites constitute a more heterogeneous group of molecules than the biomacromolecules in terms of physical and chemical properties.1,3,5,9,10,19 An analysis of the metabolome, with its divergent physicochemical properties and wide variation in concentration ranges, would thus require a wide spectrum of chemistries and instrumentation with wide dynamic ranges. Hence, it is currently technologically impossible to extract and analyse all metabolites in a cell or organism in a single analysis, and the currently characterised plant metabolites represent a very small fraction of the- whole metabolome. A second challenging task is the identification and/ or structural elucidation of molecules from analytical detector signals. The lack of universal metabolite-specific libraries and known reference compounds currently represents a major limitation to the definitive identification of metabolites.15,18,60 Fortunately, a number of strategies, such as advancement in and complementary use of technology (LC-NMR-MS, GCxGC-TOF-MS, highly improved MS instrumentation, etc.) and metabolomic databases,12,85 are increasingly being brought forward to assist in metabolite annotations and compound identification.14,15,36
Conclusion and outlook
The combination of the capabilities of different analytical instrumentation for the analyses of multicomplex samples and the integration of metabolomics with other '-omics' approaches in the context of a high-dimensional biological approach, is able to provide new insights into cellular function and regulation of metabolic networks. The ultimate aim of '-omics' technologies is to understand and predict the behaviour of complex systems such as plants, through the use of results obtained from data mining tools for subsequent modelling and simulation. Plant metabolomics has developed to the point where it can be applied alone and/or in combination with other technologies of functional genomics. Even with its current limitations, plant metabolomics is an informative tool that is revolutionising plant biology.
Acknowledgements
The National Research Foundation and the University of Johannesburg are acknowledged for support.
Authors' contributions
F.T., L.P. and I.A.D. contributed to and wrote the manuscript. I.A.D. was the project leader.
References
1. Sumner LW, Mendes P Dixon RA. Plant metabolomics: Large-scale phytochemistry in the functional genomics era. Phytochemistry. 2003;62:817-836. http://dx.doi.org/10.1016/S0031-9422(02)00708-2
2. Fernie AR. The future of metabolic phytochemistry: Larger numbers of metabolites, higher resolution, greater understanding. Phytochemistry. 2007;68:2861-2880. http://dx.doi.org/10.1016/j.phytochem.2007.07.010
3. Verpoorte R, Choi YH, Kim HK. NMR-based metabolomics at work in phytochemistry. Phytochemistry. 2007;6:3-14. http://dx.doi.org/10.1007/s11101-006-9031-3
4. Fiehn O. Metabolomics - the link between genotypes and phenotypes. Plant Molec Biol. 2002;48:155-171. http://dx.doi.org/10.1023/A:1013713905833
5. Kim HK, Choi YH, Verpoorte R. NMR-based plant metabolomics: Where do we stand, where do we go? Trends Biotechnol. 2011;29:267-275. http://dx.doi.org/10.1016/j.tibtech.2011.02.001
6. Bino RJ, Hall RD, Fiehn O, Kopka J, Saito K, Draper J, et al. Potential of metabolomics as a functional genomics tool. Trends Plant Sci. 2004;9:418-425. http://dx.doi.org/10.1016/j.tplants.2004.07.004 [ Links ]
7. Hartmann T. From waste products to ecochemicals: Fifty years research of plant secondary metabolism. Phytochemistry. 2007;68:2831-2846. http://dx.doi.org/10.1016/j.phytochem.2007.09.017
8. Fiehn O, Kopka J, Dõrmann P Altmann T, Trethewey RN, Willmitzer L. Metabolite profiling for plant functional genomics. Nature Biotechnol. 2000;18:1157-1161. http://dx.doi.org/10.1038/81137 [ Links ]
9. Allwood JW, Ellis DI, Goodacre R. Metabolomic technologies and their application to the study of plants and plant-host interactions. Physiol Plant. 2008;132:117-135.
10. Verpoorte R, Choi YH, Mustafa NR, Kim HK. Metabolomics: Back to basics. Phytochem Rev. 2008;7:525-537. http://dx.doi.org/10.1007/s11101-008-9091-7 [ Links ]
11. Fernie AR, Stitt M. On the discordance of metabolomics with proteomics and transcriptomics: Coping with increasing complexity in logic, chemistry and network interactions. Plant Physiol. 2012;158:1139-1145. http://dx.doi. org/10.1104/pp.112.193235
12. Sumner LW. Recent advances in plant metabolomics and greener pastures. F1000 Biol Rep. 2010;2:5-9.
13. Schilmiller AL, Pichersky E, Last RL. Taming the hydra of specialized metabolism: How systems biology and comparative approaches are revolutionizing plant biochemistry. Curr Opin Plant Biol. 2012;15:338-344. http://dx.doi.org/10.1016/j.pbi.2011.12.005 [ Links ]
14. Moco S, Vervoort J, Bino R, Devos R. Metabolomics technologies and metabolite identification. Trends Anal Chem. 2007;26:855-866. http://dx.doi.org/10.1016/j.trac.2007.08.003 [ Links ]
15. Brown M, Dunn WB, Dobson P Patel Y Winder CL, Francis-McIntyre S, et al. Mass spectrometry tools and metabolite-specific databases for molecular identification in metabolomics. The Analyst. 2009;134:1322-1332. http:// dx.doi.org/10.1039/b901179 [ Links ]
16. Bhalla R, Narasimhan K, Swarup S. Metabolomics and its role in understanding cellular responses in plants. Plant Cell Rep. 2005;24:562-571. http://dx.doi.org/10.1007/s00299-005-0054-9
17. Camacho D, Fuente AD, Mendes P. The origin of correlations in metabolomics data. Metabolomics. 2005;1:53-63. http://dx.doi.org/10.1007/s11306-005-1107-3 [ Links ]
18. Hall RD. Plant metabolomics: From holistic hope, to hype, to hot topic. New Phytol. 2006;169:453-468. http://dx.doi.org/10.1111/j.1469-8137.2005.01632.x
19. Dunn WB, Ellis DI. Metabolomics: Current analytical platforms and methodologies. Trends Anal Chem. 2005;24:285-294. http://dx.doi.org/10.1016/j.trac.2004.11.021
20. Fukusaki E, Kobayashi A. Plant metabolomics: Potential for practical operation. J Biosci Bioeng.. 2005;100:347-354. http://dx.doi.org/10.1263/jbb.100.347
21. t' Kindt R, Morreel K, Deforce D, Boerjan W, Bocxlaer JV. Joint GC-MS and LC-MS platforms for comprehensive plant metabolomics: Repeatability and sample pre-treatment. J Chromatogr B. 2009;877:3572-3580. http://dx.doi. org/10.1016/j.jchromb.2009.08.041 [ Links ]
22. Kim HK, Verpoorte R. Sample preparation for plant metabolomics. Phytochem Anal. 2010;21:4-13. http://dx.doi.org/10.1002/pca.1188
23. Alvarez-Sánchez B, Priego-Capote F, Luque de Castro MD. Metabolomics analysis II. Preparation of biological samples prior to detection. Trends Anal Chem. 2010;29:120-127. http://dx.doi.org/10.1016/j.trac.2009.12.004 [ Links ]
24. Xu F, Zou L, Ong CN. Experiment-originated variations, and multi-peak and multi-origination phenomena in derivatization-based GC-MS metabolomics. Trends Anal Chem. 2010;29:269-280. http://dx.doi.org/10.1016/j. trac.2009.12.007
25. Gachon CMM, Langlois-Meurinne M, Saindrenan P. Plant secondary metabolism glycosyltransferases: The emerging functional analysis. Trends Plant Sci. 2005;10:542-549. http://dx.doi.org/10.1016/j.tplants.2005.09.007 [ Links ]
26. Yazaki K, Sasaki K, Tsurumaru Y Prenylation of aromatic compounds, a key diversification of plant secondary metabolites. Phytochemistry. 2009;70:1739-1745. http://dx.doi.org/10.1016/j.phytochem.2009.08.023 [ Links ]
27. Vogt T. Phenylpropanoid biosynthesis. Molecular Plant. 2010;3:2-20. http://dx.doi.org/10.1093/mp/ssp106
28. Giddings JC. Sample dimensionality: A predictor of order-disorder in component peak distribution in multidimensional separation. J Chromatogr A. 1995;703:3-15. http://dx.doi.org/10.1016/0021-9673(95)00249-M
29. Schure MR. The dimensionality of chromatographic separations. J Chromatogr A. 2011;1218:293-302. http://dx.doi.org/10.1016/j.chroma.2010.11.016
30. Kim HK, Choi YH, Verpoorte R. NMR-based metabolomic analysis of plants. Nat Protocols. 2010;5:536-549. http://dx.doi.org/10.1038/nprot.2009.237
31. Allwood JW, Goodacre R. An introduction to liquid chromatography-mass spectrometry instrumentation applied in plant metabolomic analyses. Phytochem Anal. 2010;21:33-47. http://dx.doi.org/10.1002/pca.1187
32. Weckwerth W, Morgenthal K. Metabolomics: from pattern recognition to biological interpretation. Drug Discov Today. 2005;10:1551-1558. http://dx.doi.org/10.1016/S1359-6446(05)03609-3
33. Weljie AM, Newton J, Mercier P Carlson E, Slupsky CM. Targeted profiling: quantitative analysis of 1H NMR metabolomics data. Anal Chem. 2006;78:4430-4442. http://dx.doi.org/10.1021/ac060209g [ Links ]
34. Okazaki Y Saito K. Recent advances of metabolomics in plant biotechnology. Plant Biotechnol Rep. 2012;6:1-15. http://dx.doi.org/10.1007/s11816-011-0191-2
35. Guiochon G, Marchetti N, Mriziq K, Shalliker RA. Implementations of two-dimensional liquid chromatography. J Chromatogr A. 2008;1189:109-168. http://dx.doi.org/10.1016/j.chroma.2008.01.086 [ Links ]
36. Ralston-Hooper K, Hopf A, Oh C, Zhang X, Adamec J, Sepúlveda MS. Development of GCxGC/TOF-MS metabolomics for use in ecotoxicological studies with invertebrates. Aquat Toxicol. 2008;88:48-52. http://dx.doi. org/10.1016/j.aquatox.2008.03.002 [ Links ]
37. Gu H, Huang Y Carr PW. Peak capacity optimization in comprehensive two dimensional liquid chromatography: A practical approach. J Chromatogr A. 2011;1218:64-73. http://dx.doi.org/10.1016/j.chroma.2010.10.096 [ Links ]
38. Jandera P. Programmed elution in comprehensive two-dimensional liquid chromatography - A review. J Chromatogr A. 2012;1255:112-129. http://dx.doi.org/10.1016/j.chroma.2012.02.071
39. Dunn WB. Current trends and future requirements for the mass spectrometric investigation of microbial, mammalian and plant metabolomes. Phys Biol. 2008;5:1-24. http://dx.doi.org/10.1088/1478-3975/5/1/011001
40. Hao C, March RE. A survey of recent research activity in quadrupole ion trap mass spectrometry. Int J Mass Spectrom. 2001;212:337-357. http://dx.doi.org/10.1016/S1387-3806(01)00465-1
41. Kim MH, Leskiw BD, Shen L, Suits AG. Velocity map imaging mass spectrometry. Int J Mass Spectrom. 2006;252:73-78. http://dx.doi.org/10.1016/j.ijms.2006.01.030 [ Links ]
42. Tang X, Bruce JE, Hill HH. Characterizing electrospray ionization using atmospheric pressure ion mobility spectrometry. Anal Chem. 2006;78:7751-7760. http://dx.doi.org/10.1021/ac0613380 [ Links ]
43. Brucker GA, Rathbone GJ. Autoresonant trap mass spectrometry (ART MS) for remote sensing applications. Int J Mass Spectrom. 2010;295:133-137. http://dx.doi.org/10.1016/j.ijms.2010.06.028
44. Bateman KP Castro-Perez J, Wrona M, Shockcor JP Yu K, Oballa R, et al.MSE with mass defect filtering for in vitro and in vivo metabolite identification. Rapid Commun Mass Spectrom. 2007;21:1485-1496. http://dx.doi.org/10.1002/rcm.2996 [ Links ]
45. Kind T, Fiehn O. Seven golden rules for heuristic filtering of molecular formulas obtained by accurate mass spectrometry. BMC Bioinformatics. 2007;8:1-20. http://dx.doi.org/10.1186/1471-2105-8-105
46. Boccard J, Grata E, Thiocone A, Gauvrit JY Lantéri P Carrupt PA, et al. Multivariate data analysis of rapid LC-TOF/MS experiments from Arabidopsis thaliana stressed by wounding. Chemometr Intell Lab. 2007;86:189-197. http://dx.doi.org/10.1016/j.chemolab.2006.06.004 [ Links ]
47. Liland KH. Multivariate methods in metabolomics - from pre-processing to dimension reduction and statistical analysis. Trends Anal Chem. 2011;30:827-841. http://dx.doi.org/10.1016/j.trac.2011.02.007
48. Van den Berg RA, Hoefsloot HCJ, Westerhuis JA, Smilde AK, Werf MJVD. Centering, scaling, and transformations: Improving the biological information content of metabolomics data. BMC Genomics. 2006;7:1-15. http://dx.doi. org/10.1186/1471-2164-7-142 [ Links ]
49. Van den Berg RA, Rubingh CM, Westerhuis JA, Van der Werf MJ, Smilde AK. Metabolomics data exploration guided by prior knowledge. Analyt Chim Acta. 2009;651:173-181. http://dx.doi.org/10.1016/j.aca.2009.08.029 [ Links ]
50. Jansen JJ, Smit S, Hoefsloot HCJ, Smilde AK. The photographer and the greenhouse: How to analyse plant metabolomics data. Phytochem Analysis. 2010;21:48-60. http://dx.doi.org/10.1002/pca.1181 [ Links ]
51. Vichi M, Saporta G. Clustering and disjoint principal component analysis. Comput Stat Data An. 2009;53:3194-3208. http://dx.doi.org/10.1016/j.csda.2008.05.028
52. Bylesjõ M, Rantalainen M, Nicholson JK, Holmes E, Trygg J. K-OPLS package: Kernel-based orthogonal projections to latent structures for prediction and interpretation in feature space. BMC Bioinformatics. 2008;9:1-7. http:// dx.doi.org/10.1186/1471-2105-9-106 [ Links ]
53. Trygg J, Holmes E, Lundstedt T. Chemometrics in metabonomics. J Proteom Res. 2007;6:469-479. http://dx.doi.org/10.1021/pr060594q
54. Goodacre R, Vaidyanathan S, Dunn WB, Harrigan GG, Kell DB. Metabolomics by numbers: Acquiring and understanding global metabolite data. Trends Biotechnol. 2004;22:245-252. http://dx.doi.org/10.1016/j.tibtech.2004.03.007 [ Links ]
55. Fonville JM, Bylesjo M, Coen M, Nicholson JK, Holmes E, Lindon JC, et al. Nonlinear modeling of 1H NMR metabonomic data using kernel-based orthogonal projections to latent structures optimized by simulated annealing. Analyt Chim Acta. 2011;705:72-80. http://dx.doi.org/10.1016/j.aca.2011.04.016 [ Links ]
56. Goodacre R, York EV Heald JK, Scott IM. Chemometric discrimination of unfractionated plant extracts analyzed by electrospray mass spectrometry. Phytochemistry. 2003;62:859-863. http://dx.doi.org/10.1016/S0031-9422(02)00718-5 [ Links ]
57. Wiklund S, Johanson E, Sjõstrõm L, Mellerowicz EJ, Edlund U, Shockcor JP, et al. Visualization of GC/TOF-MS-based metabolomics data for identification of biochemically interesting compounds using OPLS class models. Anal Chem. 2008;80:115-122. http://dx.doi.org/10.1021/ac0713510 [ Links ]
58. Roux A, Lison D, Junot C, Heilier J-F. Applications of liquid chromatography coupled to mass spectrometry-based metabolomics in clinical chemistry and toxicology: A review. Clin Biochem. 2011;44:119-135. http://dx.doi. org/10.1016/j.clinbiochem.2010.08.016 [ Links ]
59. Sieber M, Wagner S, Rached E, Amberg A, Mally A, Dekant W. Metabonomic study of ochratoxin a toxicity in rats after repeated administration: Phenotypic anchoring enhances the ability for biomarker discovery. Chem Res Toxicol. 2009;22:1221-1231. http://dx.doi.org/10.1021/tx800459q [ Links ]
60. Schauer N, Fernie AR. Plant metabolomics: towards biological function and mechanism. Trends Plant Sci. 2006;11:508-516. http://dx.doi.org/10.1016/j.tplants.2006.08.007
61. Kell DB. Metabolomics and systems biology: Making sense of the soup. Curr Opin Microbiol. 2004;7:296-307. http://dx.doi.org/10.1016/j.mib.2004.04.012
62. Fukushima A, Kusano M, Redestig H, Arita M, Saito K. Integrated omics approaches in plant systems biology. Curr Opin Chem Biol. 2009;13:532-538. http://dx.doi.org/10.1016/j.cbpa.2009.09.022 [ Links ]
63. Kottowska A, Sworczak K, Stepnowski P Urine metabolomics analysis for adrenal incidentaloma activity detection and biomarker discovery. J Chromatogr B. 2011;879:359-363. http://dx.doi.org/10.1016/j.jchromb.2010.12.021
64. Xie GX, Ni Y, Su MM, Zhang YY, Zhao AH, Gao XF, et al. Application of ultra-performance LC-TOF MS metabolite profiling techniques to the analysis of medicinal Panax herbs. Metabolomics. 2008;4:248-260. http://dx.doi. org/10.1007/s11306-008-0115-5 [ Links ]
65. Farag MA, Huhman DV, Dixon RA, Sumner LW, Foundation N. Metabolomics reveals novel pathways and differential mechanistic and elicitor-specific responses in phenylpropanoid and isoflavonoid biosynthesis in Medicago truncatula cell cultures. Plant Physiol. 2008;146:387-402. http://dx.doi.org/10.1104/pp.107.108431 [ Links ]
66. Saito K, Hirai MY Yonekura-Sakakibara K. Decoding genes with coexpression networks and metabolomics - "majority report by precogs". Trends Plant Sci. 2008;13:36-43. http://dx.doi.org/10.1016/j.tplants.2007.10.006
67. Fontaine J-X, Molinié R, Tercé-Laforgue T, Cailleu D, Hirel B, Dubois F, et al. Use of 1H-NMR metabolomics to precise the function of the third glutamate dehydrogenase gene in Arabidopsis thaliana. Compt Rend Chim. 2010;13:453-458. http://dx.doi.org/10.1016/j.crci.2009.08.003 [ Links ]
68. Okazaki Y, Shimojima M, Sawada Y, Toyooka K, Narisawa T, Mochida K, et al. A chloroplastic UDP-glucose pyrophosphorylase from Arabidopsis is the committed enzyme for the first step of sulfolipid biosynthesis. Plant Cell. 2009;21:892-909. http://dx.doi.org/10.1105/tpc.108.063925 [ Links ]
69. Jansen JJ, Allwood JW, Marsden-Edwards E, Putten WH, Goodacre R, Dam NM. Metabolomic analysis of the interaction between plants and herbivores. Metabolomics. 2009;5:150-161. http://dx.doi.org/10.1007/s11306-008-0124-4 [ Links ]
70. Wink M. Plant breeding: Importance of plant secondary metabolites for protection against pathogens and herbivores. Theor Appl Genet. 1988;75:225-233. http://dx.doi.org/10.1007/BF00303957
71. Allwood JW, Clarke A, Goodacre R, Mur LJ. Dual metabolomics: A novel approach to understanding plant-pathogen interactions. Phytochemistry. 2010;71:590-597. http://dx.doi.org/10.1016/j.phytochem.2010.01.006 [ Links ]
72. Johnson HE, Broadhurst D, Goodacre R, Smith AR. Metabolic fingerprinting of salt-stressed tomatoes. Phytochemistry. 2003;62:919-928. http://dx.doi.org/10.1016/S0031-9422(02)00722-7 [ Links ]
73. Zhang J, Zhang Y Du Y Chen S, Tang H. Dynamic metabonomic responses of tobacco (Nicotiana tabacum) plants to salt stress. J Proteom Res. 2011;10:1904-1914. http://dx.doi.org/10.1021/pr101140n [ Links ]
74. Yang W-L, Bernards MA. Metabolite profiling of potato (Solanum tuberosum L.) tubers during wound-induced suberization. Metabolomics. 2007;3:147-159. http://dx.doi.org/10.1007/s11306-007-0053-7
75. Ibáñez AJ, Scharte J, Bones P Pirkl A, Meldau S, Baldwin IT, et al. Rapid metabolic profiling of Nicotiana tabacum defence responses against Phytophthora nicotianae using direct infrared laser desorption ionization mass spectrometry and principal component analysis. Plant Methods. 2010;6:1-16. [ Links ]
76. Ward JL, Forcat S, Beckmann M, Bennett M, Miller SJ, Baker JM, et al. The metabolic transition during disease following infection of Arabidopsis thaliana by Pseudomonas syringae pv. tomato. Plant J. 2010;63:443-457. http:// dx.doi.org/10.1111/j.1365-313X.2010.04254.x [ Links ]
77. Tugizimana F, Steenkamp PA, Piater LA, Dubery IA. Ergosterol-induced sesquiterpenoid synthesis in tobacco cells. Molecules. 2012;17:1698-1715. http://dx.doi.org/10.3390/molecules17021698 [ Links ]
78. Houshyani B, Kabouw P Muth D, De Vos RCH, Bino RJ, Bouwmeester HJ. Characterization of the natural variation in Arabidopsis thaliana metabolome by the analysis of metabolic distance. Metabolomics. 2012;8:131-145. http://dx.doi.org/10.1007/s11306-011-0375-3 [ Links ]
79. Beets CA, Huang J-C, Madala NE, Dubery IA. Activation of camalexin biosynthesis in Arabidopsis thaliana in response to perception of bacterial lipopolysaccharides: A gene-to-metabolite study. Planta. 2012;236:261-272. http://dx.doi.org/10.1007/s00425-012-1606-1
80. Okada T, Afendi FM, Altaf-Ul-Amin M, Takahasi H, Nakamura K, Kanaya S. Metabolomics of medicinal plants:the importance of multivariate analysis of analytical chemistry data. Curr Comput Aided Drug Design. 2010;6:179-196. http://dx.doi.org/10.2174/157340910791760055 [ Links ]
81. Choi YH, Sertic S, Kim HK, Wilson EG, Michopoulos F, Lefeber AWM, et al. Classification of Ilex species based on metabolomic fingerprinting using NMR and multivariate data analysis. J Agric Food Chem. 2005;53:1237-1245. http://dx.doi.org/10.1021/jf0486141
82. Aliferis KA, Jabaji S. Metabolomics - A robust bioanalytical approach for the discovery of the modes-of-action of pesticides: A review. Pest Biochem Physiol. 2011;100:105-117. http://dx.doi.org/10.1016/j.pestbp.2011.03.004
83. Sardans J, Penuelas J, Rivas-Ubach A. Ecological metabolomics: Overview of current developments and future challenges. Chemoecology. 2011;21:191-225. http://dx.doi.org/10.1007/s00049-011-0083-5
84. Bovy A, Schijlen E, Hall RD. Metabolic engineering of flavonoids in tomato (Solanum lycopersicum): The potential for metabolomics. Metabolomics. 2007;3:399-412. http://dx.doi.org/10.1007/s11306-007-0074-2
85. Bais P Moon-Quanbeck SM, Nikolau BJ, Dickerson JA. Plantmetabolomics. org: Mass spectrometry-based Arabidopsis metabolomics - database and tools update. Nucleic Acids Res. 2012;40:D1216-D1220. http://dx.doi. org/10.1093/nar/gkr969
 Correspondence:
Ian Dubery
Department of Biochemistry, University of Johannesburg
PO Box 524, Auckland Park 2006, South Africa
Email:idubery@uj.ac.za
Received: 12 Apr. 2012
Revised: 10 Sep. 2012
Accepted: 01 Nov. 2012

