


Servicios Personalizados
Articulo
 Inglés (pdf)
 Articulo en XML
 Referencias del artículo
Indicadores

Links relacionados
-
 Citado por Google
 -
 Similares en Google
Compartir

 Permalink
South African Journal of Science
versión On-line ISSN 1996-7489
versión impresa ISSN 0038-2353
S. Afr. j. sci. vol.109 no.5-6 Pretoria ene. 2013
SCIENTIFIC CORRESPONDENCE
An equity index for South Africa
Kesh S. GovinderI; Malegapuru W. MakgobaII
ISchool of Mathematics, Statistics and Computer Science, University of KwaZulu-Natal, Durban, South Africa
IIVice-Chancellor, University of KwaZulu-Natal, Durban, South Africa
ABSTRACT
We have introduced the concept of an EI to determine the equity profile of an organisation. This index is based on the straightforward Euclidean distance formula. It can be used to gauge the change in equity profile of an organisation over a defined period. Here, we used UKZN staff data for 2009 in order to illustrate the concept.
We note that the formula must be used with caution when dealing with small numbers of staff. The need for this caveat was apparent when trying to analyse the profile of UKZN's top and senior management. The EI is best used when the data set is large enough that a small change in actual number causes a small change in percentage. We suggest a threshold of an overall population of 100 be adopted.
This formula can be used in a number of different categories to determine the appropriate equity profile. For example, it can be used for student data to determine EIs for enrollment as well as graduation rates. Within an organisation, it can be used to monitor demographic transformation at different levels. In higher education, in particular, one can evaluate the composition of Council, the Institutional Forum, Senate, etc. Indeed, the EI can be used as a national ranking system for all companies, organisations and institutions.
We are currently working on an analysis of the higher education sector in order to rank institutions based on their EIs as well as their equity weighted research productivity. We envisage that such an analysis will be quite insightful in interrogating the development of the sector. Similar analyses can be undertaken for other sectors.
Finally, we note that the EI can be used as one (important) component to gauge the progress of an organisation's transformation. We acknowledge that transformation is a much broader concept with many nuances. Our EI is the first unbiased measure to determine the progress made with regard to organisational demographic transformation.
Keywords: transformation; demographics; equity profile; Euclidean distance formula; University of Kwazulu-Natal
In the ongoing struggle to ingrain transformation throughout South Africa, one of the aspects that still needs attention is the demographic (or equity) profile of institutions. While demographics are not the only aspect of transformation, it remains one of the most important factors.
It is particularly difficult to gauge the improvement in equity profile over a defined period. As an example, consider a hypothetical organisation X. We assume that X's racial profile constituted 70% Black African, 2% Coloured, 4% Indian and 24% White staff in 2004. We further assume that the racial profile changed to 72% Black African, 1% Coloured, 2% Indian and 25% White staff in 2009. While the percentage of Black African staff increased, so did the percentage of White staff. By simply looking at the percentage change in each category, we cannot determine whether the racial profile of X improved or worsened from 2004 to 2009.
In the above example we were concerned with the improvement in racial profile for a single organisation. However, one could also consider the relative racial or gender profiles of different organisations (either in a particular sector or nationally). A similar difficulty would be encountered in answering this latter question.
We show how a single numerical quantity - the Equity Index - will be able to answer these questions unambiguously.
The Equity Index
In mathematics, a simple way to determine how far a particular data point is from another is to calculate the distance between the two points. If the components of the first point are given by x1(j = 1.....n), and those of the second by y(i = 1.....n), then the distance between the two points is calculated as follows1:
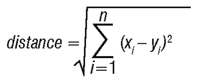
The advantage of this formula is that one can gauge exactly how far away different data points are. If our reference data point is the origin (say (0,0,0,0)), then the data point (1,2,1,3) is V15 units away, while the data point (1,0,1,1) is V3 units away from the origin (as is the data point (1,0,-1,1)). We conclude that the latter two points are equally far from the origin and that both are closer to the origin than the first point.
The same idea can be applied to racial and gender demographics for an organisation. If we take the national (or regional, as appropriate) demographic profile as a single point, we can determine how far from that point a particular organisation is in terms of its own demographics. The smaller the value, the better the organisational profile approximates the national or regional profile.
We define the Equity Index (EI) as:
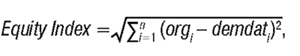
where orgj refers to the organisation's demographic percentage for the i-th category (eg. African females) and demdatj refers to the national or regional (as appropriate) demographic percentage for the same category.
The categories chosen must be consistent with the national or regional data against which the profile is being measured. For example, if the national data available are for Black African, Coloured, Indian and White individuals, then the organisation's data must be combined into those four categories. On the other hand, if data are available (nationally) for Black African males, Coloured males, Indian males, White males, Black African females, Coloured females, Indian females and White females, then the organisational data must also be grouped into these eight categories. Importantly, different EIs will be calculated depending on the number of categories. As a result, it is vital to ensure that the same categories are being used for a correct relative comparison of indices.
Application of the Equity Index
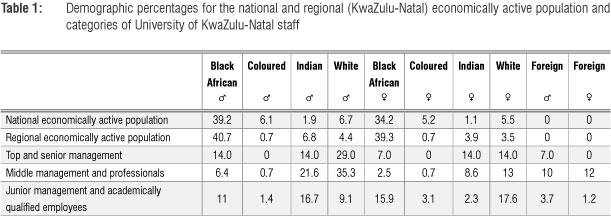
In order to illustrate the application of the EI, we use the data for the University of KwaZulu-Natal (UKZN) for 2009.2 In Table 1 we indicate the demographic breakdown for various staff categories as well as the national and regional (KZN) economically active population.
The EI for UKZN's senior and top management employees will be determined as follows:
National EI = [(14-39.2)2 + (0-6.1)2 + (14-1.9)2 + (29-6.7)2 + (7-34.2)2 + (0-5.2)2 + (14-1.1)2 + (14-5.5)2 + (7-0)2 + (0-0)2]1/2 = 48.7
Regional EI = [(14-40.7)2 + (0-0.7)2 + (14-6.8)2 + (29-4.4)2 + (7-39.3)2 + (0-0.7)2 + (14-3.9)2 + (14-3.5)2 + (7-0)2 + (0-0)2]1'2 = 51.7
We can conclude that the profile of UKZN's senior and top management employees better matches the national demographics than the regional demographics. The EI for the other categories of staff are given in Table 2.
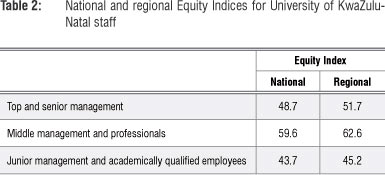
From Table 2, we can conclude that, in 2009, UKZN's junior management had the closest profile match to the national demographics followed by senior management and then middle management. The same ranking holds for the regional profile. The national and regional indices for junior management are the best of the indices, while those for middle management are the worst. (Incidentally, if we use the national data in Table 1 for our hypothetical organisation X, the EI increases and so the equity profile has worsened from 2004 to 2009.)
For these demographics, the maximum (or worst) national EI is 113.4 and regional EI is 115.3 (with the best EI obviously being zero in both cases). These values can be used to normalise the data if so required. However, the raw data can be used just as effectively to determine relative positions.
The EI can also be used to determine appropriate targets. Let us consider the 'top and senior management' profile. As a result of the small numbers in the category, each person corresponds to 7%. Let us assume that one person is about to resign or retire. In decreasing order of preference, the national equity profile would be improved if: (1) one White male is replaced by one Black female (EI=42.1), (2) one White male is replaced by one Black male (EI=42.5), (3) one Indian male is replaced by one Black female (EI=43.8), and (4) one Indian male is replaced by one Black male (EI=44.1). Additionally, one can set targets with respect to the EI - for example, a target of a 10% improvement in EI could form part of an organisation's set of indicators.
Acknowledgements
We thank colleagues in the School of Mathematics, Statistics and Computer Science for reading and validating the approach. K.S.G. thanks the National Research Foundation of South Africa and UKZN for ongoing support.
References
1. Weisstein EW. Distance. MathWorld - A Wolfram web resource [database on the Internet]. No date [cited 2013 Apr 5]. Available from: http://mathworld.wolfram.com/Distance.html [ Links ]
2. University of KwaZulu-Natal (UKZN). Employment equity plan and report of UKZN: October 2010 - September 2014. Durban: UKZN; 2010. [ Links ]
 Correspondence:
Kesh Govinder
School of Mathematics, Statistics and Computer Science
University of KwaZulu-Natal
Private Bag X54001, Durban 4000, South Africa
Email:Govinder@ukzn.ac.za

