


Services on Demand
Article
 English (pdf)
 Article in xml format
 Article references
Indicators

Related links
-
 Cited by Google
 -
 Similars in Google
Share

 Permalink
South African Journal of Science
On-line version ISSN 1996-7489
Print version ISSN 0038-2353
S. Afr. j. sci. vol.109 n.3-4 Pretoria Jan. 2013
RESEARCH ARTICLE
Sea level variability in South African estuaries
Eckart H. Schumann
Department of Geosciences, Nelson Mandela Metropolitan University, Port Elizabeth, South Africa
ABSTRACT
Sea level variability in the coastal ocean affects water levels in adjacent estuaries over a wide range of periods and to varying distances landward. An assessment is given here of the responses of a number of South African estuaries, focusing on tidal and subtidal periods where the dominant effects are found and the necessary data are available. Shorter period inputs tend to be limited to mouth regions and require more detailed, higher frequency data. Subtidal fluctuations, in particular those caused by coastal trapped waves, play an important part in the dynamics of estuaries in the Western Cape and Eastern Cape. In many cases their influence dominates tidal oscillations farther upstream, and it is apparent that such fluctuations must be considered in any assessment of estuarine characteristics, and indeed their upstream extent. Nonetheless, it should be emphasised that each estuary has unique properties, and must be assessed individually. Sea level variability changes dramatically north of the Kei Estuary, and particularly off the coast of KwaZulu-Natal. Unfortunately, few measurements were available from these estuaries, but the mouth conditions of the estuaries and the build-up of river flow appear to be important factors in resulting estuary water levels. These results show that using only tidal variations in the sea can result in very misleading conclusions about concurrent water levels in estuaries.
Keywords: South Africa; estuary; water level; subtidal fluctuations
Introduction
Water level variations in an estuary originate primarily from sources located at either end of the estuary. On the landward side, rivers bring in fresh water resulting from precipitation in catchment areas, with increased water levels at the head of the estuary resulting from greater river inflows. Flood spates can cause dramatic changes, but generally the water levels vary on time scales of days.
At the sea, water level variability is transferred to an estuary through the mouth. As such, the estuary responds to a whole range of sea level variability, from surface gravity waves at periods of seconds, to tides and longer-period fluctuations driven by weather, and at even longer periods associated with seasonal characteristics. Episodic events, such as tsunamis, add an unknown dimension and are not addressed here.
For water to flow, a pressure gradient needs to be established, with the resulting flow occurring from the higher level to the lower level. On the other hand, waves on the surface represent a means of energy propagating from one point to another, and do not necessarily result in the direct transfer of water over time.
Mouth characteristics such as sills and sandbanks affect the manner in which an estuary responds to these changes in sea level. The pressure gradients will dictate whether water flows into or out of an estuary, and the period of the fluctuation will determine the nature of the flow and the landward extent. In most cases equilibrium conditions are not established. The morphology of the estuary itself, in particular channel width and depth, also plays a part in the estuary's response to sea level change. The slope of the estuary channel finally determines the inland extent of sea level variations - and the extent of the estuary, with the limit found where the inflowing river level rises above the propagated sea level. However, because higher frequency signals do not propagate very far into estuaries, and because of the nature of the data available, the emphasis in this paper will be on tidal and subtidal fluctuations in sea level.
Data
Data on water levels at South African ports and in various estuaries were obtained from a number of sources. As discussed in the next section, apart from the mouth region, the major impact on these estuaries derives from fluctuations at tidal and longer periods, and thus measurements taken at hourly intervals are generally appropriate. In any case, investigations at shorter periods require more sophisticated and intense measurements, concentrating on specific estuaries, and thus fall out of the scope of a general assessment.
Figure 1 shows the positions of the various estuaries and ports mentioned in the text where water level measurements were available, and which have been used in this paper. Table 1 gives further details of all these sites, as well as the respective authorities or organisations which provided data or the funding to obtain the data.
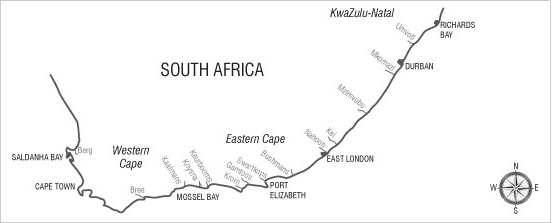
Figure 1: Map of South Africa depicting the positions of the various ports and estuaries discussed in the text.
The South African Naval Hydrographer maintains tide gauges at various ports, and the edited hourly data were made available for use in this analysis. Similarly, the Department of Water Affairs provided data from water level recorders maintained in the mouth regions of many South African estuaries. Estuaries selected were only those where there was a free exchange with the ocean; approximate positions are indicated in Table 1.
Other water level data was derived from projects undertaken in several estuaries with recordings taken at 15-min intervals. The measurements made for the Nelson Mandela Bay Municipality at three sites on the Swartkops Estuary in 1993 used a number of meters established earlier, but there were a variety of problems with the equipment, and valid data were obtained only for a short period. The measurements made for the Water Research Commission in the Bushmans Estuary formed part of a programme investigating sediment management,1 and only covered a short period in 2000. The measurements sponsored by Africoast Engineers SA in the Kaaimans Estuary formed part of a contract.
To provide consistency with the South African Naval Hydrographer and Department of Water Affairs data, the 15-min measurements were filtered to hourly values using a symmetrical cosine-Lanczos filter with 25 weights and a quarter-power point at 0.53496 cycles per hour. In the analyses of subtidal fluctuations, periods less than about 30 h were removed by a further symmetrical cosine-Lanczos filter with 97 weights and a quarter-power point at 0.031 cycles per hour.
Sea level variability at the coast
Sea level at the coast varies over a very wide range of periods. At short periods the most obvious changes in sea level are caused by surface gravity waves, with periods typically ranging from less than 1 s to 20 s and more.2 Wave heights in excess of 5 m are not uncommon offshore, but shoaling bathymetry means that the waves break in shallower water, dissipating much of this energy.
The extent to which these waves enter an estuary depends on local conditions such as sandbanks and mouth morphology, which can cause further breaking and loss of energy. The state of the tide is also important - the flow of an ebb tide opposes the incoming waves, causing breaking and limiting their ingress, whereas the flow of a flood tide assists the waves, and deeper water means that longer waves can penetrate farther inland. Analysis of wave propagation into the Altamaha River Estuary3 showed that both ebb and current induced wave breaking occurred during ebb to low water, while during flood and high tide waves penetrated much farther.
Given the shallow and narrow mouths of many estuaries in South Africa, surface gravity waves seldom reach more than a few hundred metres into such estuaries. Changes in channel direction further inhibit landward wave propagation. Nonetheless, when such waves do enter estuaries they can cause damage, such as the erosion of the banks of the Gamtoos River by high waves which entered the estuary during an elevated sea level event in 1992.4
Surface gravity waves also affect the longer-term coastal sea level, with the direct effect of wave momentum causing a set-up of sea level at the coast. Such a 'wave set-up' is dependent on the offshore wave height and is sensitive to tidal fluctuations and the foreshore slope.5 A wave set-up can typically range to more than 10-20 cm, although this height can extend to 1-2 m with very high waves. Such wave set-ups continue for the duration of the high wave event.
The most regular variation in sea level at the coast occurs as a result of the tides. The movements of the moon and the sun around the earth are known precisely, and consequently more than 390 resulting components or partial tides have been accurately identified.6 For the most part, the lunar M2 tide (with a period of 12.42 h) and the lunisolar K1 tide (with a period of 24 h) dominate. In South Africa, propagation of the tides generally occurs as barotropic Kelvin waves in a west to east direction, with an amphidromic point situated in the Southern Ocean.7 Such waves have their crests lying perpendicular to the coast, with maximum amplitudes at the coast, decreasing offshore according to the local Rossby radius of deformation.8
At longer periods in the weather band, a number of different effects come into play. When there is a change in air pressure at one point over the ocean it causes a response in sea level termed the inverse barometer effect.8 Theoretically, an increase in air pressure of 1 millibar results in the surface of the ocean being lowered by 1 cm, but this level of change is seldom fully achieved because of the movement of the air pressure systems and the fact that water movement is required to accomplish the change.
Small coastal low pressure systems form on the coastal side of the interior escarpment of South Africa, propagating anti-clockwise around South Africa.9 Such coastal lows have associated winds which tend to blow dominantly along the line of the coast, and as such can be responsible for the generation of storm surges. Thus, a westerly wind along the south coast sets up an Ekman drift in the upper layers of the ocean towards the coast, which takes approximately an inertial period to set up8 (about 21 h for the south coast). Gale-force winds can cause substantial increases in sea level at the coast, which then propagate along the coast as forced Kelvin waves with a moving wind system; this effect is enhanced in shallow water.
Barotropic coastal trapped waves (CTWs) are also generated by the longshore component of the wind.8 Along the South African west and south coasts, the small low pressure systems that propagate eastwards are known to generate such CTWs,10,11 which reach substantial amplitudes along the south and southeast coast because of a resonance situation where the coastal lows travel at approximately the same speed as the natural speed of the CTWs.
Figure 2 shows a comparison of wind, air pressure and sea level variability at Port Elizabeth for a 30-day period in 2009. At times a small, delayed inverse visual correlation is evident between air pressure and sea level, while, as expected, peaks in sea level are associated with westerly component winds. However, the extent of the sea level variability -almost 1 m between 17 and 21 May - indicates that the dominant effect is as a result of CTWs, as the winds are not strong enough to cause such changes directly. The sea level fluctuations accompanying CTWs are irregular, and the periodicities fall within the weather band of several days. However, the CTWs seldom reach the KwaZulu-Natal coast,10,12 and it is probable that they dissipate in the Agulhas Current flowing south-westwards along the east coast of South Africa.13
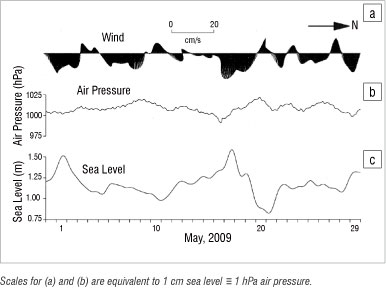
Figure 2: Time series of (a) winds (in the oceanographic sense, i.e. the vector points in the direction to which the wind is blowing), (b) air pressure and (c) sea level from Port Elizabeth.
Typical sea level variations, obtained from measurements made at the Port Elizabeth harbour in 2000, are shown in Figure 3. Figure 3a shows the actual measurements, and it is clear that considerable variability exists. In particular, the longer-period sea level variations discussed above can cause substantial departures from the tidal oscillations. In Figure 3b, the longer-period variations have been removed, leaving only the tidal oscillations. As expected, the semi-diurnal M2 tide dominates, but there is clear evidence of a diurnal oscillation, with every second tidal peak being slightly higher. Moreover, the fortnightly spring/neap variation is also apparent: neap tide variations can be less than 0.5 m whereas corresponding spring tides can be over 2 m at times.
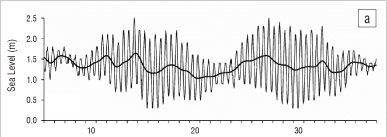
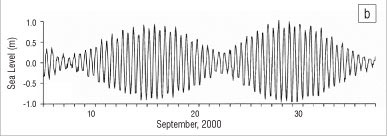
Figure 3: Sea level measured at Port Elizabeth in 2000. The upper figure (a) shows the original hourly data (light line) with the superimposed long-period variability (dark line). The bottom figure (b) shows the tidal oscillations with the long-period variability removed.
The estuarine response
The estuarine response to changes in adjacent sea level can be complex, and varies with the different periods involved; as already indicated, the emphasis here will be on tidal and longer periods. The discussion is divided into two parts: the first dealing with sea level variability near the mouth of the estuaries and the second the manner in which the different signals from the sea propagate landward into the estuaries.
The estuary mouth
Most South African estuaries have a sub-aerial sandy barrier in the form of a wave-built sandy ridge that lies parallel to the prevailing wave fronts and extends across the seaward section of the estuary, separating it from the sea.14 These shallow barriers play an important part in the way estuaries exchange water with the sea. The process has been described elsewhere,15,16 and demonstrates the fact that water only flows when a pressure gradient is established. Ebb flow draining from an estuary is reversed when the water level in the sea starts exceeding that in the estuary, with the flood flow accelerating over time under an increasing pressure gradient until the friction in the shallow mouth balances the pressure gradient. However, the pressure gradient decreases as high tide is reached in the sea and the estuary level rises until the water level in the estuary exceeds that in the sea and the next ebb flow starts.
As water flows out of the estuary, the flow over the sill becomes shallower and shallower, increasing friction and slowing the velocity. Consequently, the water level in the estuary does not drop as quickly as the rise in the flood tide and, in extreme cases, cannot drop below the level of the sill. The low tide in the sea therefore occurs before the end of the ebb flow, and the whole cycle starts again.
Because of the shallow nature of most South African estuaries, the tidal exchanges tend to be flood dominant, i.e. the flood flow is shorter but more intense than the ebb flow. Mathematically, this process can be described as the generation of an M4 overtide, with a period of 6.21 h.17 Ebb dominance requires relatively deep mouth channels. As the flood-tidal currents flow for a shorter time, they are generally stronger than ebb-tidal currents. These flood-dominant currents play an important part in the ingress of sediments1; examples of such asymmetry have been reported for various South African estuaries.17-19
An extreme case of the effect of a sill is shown in Figure 4 for the Kaaimans Estuary. Kaaimans is a very short estuary, and measurements were taken at 15-min intervals at a site about 1 km from the sea. Simultaneous tide gauge data at 3-min intervals from Mossel Bay are shown to represent sea level in the adjacent ocean. In May 2006, the sand delta at the mouth had grown to such an extent that the sea level at low tide was considerably lower than the level of the sand in the narrow entrance channel. As a consequence, no water exchange could take place whenever sea level dropped below this level, and the tidal variation at the measurement site in the estuary was essentially rectified, following sea level only in the upper part of the tidal variation.
The tailing off of the ebb flow, as frictional effects in the shallow entrance channel became more important as the water level dropped, is clearly evident in Figure 4. On the other hand, the change to flood flow was very rapid, with the increasing depth allowing commensurably more water into the estuary. Also evident are the shorter period fluctuations - of the order of minutes - in both the sea and the estuary; in the latter case these fluctuations could be a result of seiching.
As already indicated, it can be expected that longer-period fluctuations travel farther into an estuary. The measurement sites of the Department of Water Affairs given in Table 1 are situated at different distances from the mouths (up to 6 km upstream), but in fact closely follow the subtidal variability in the adjacent sea. This relationship is shown in Figure 5 for a 30-day period in 2009, where both the filtered estuarine and oceanic water levels are depicted. It is clear that substantial water level variations occurred during this period, with total changes well in excess of 50 cm in the sea, particularly along the south coast; this change is greater than the M2 neap tidal variation. The variability in the estuaries was more muted, but still approached 50 cm at times. Figure 5 demonstrates the importance of CTWs in this variability, with the propagation of these waves occurring anti-clockwise from the Berg Estuary, along the south and southeast coasts and past the Kei Estuary on the southeast coast. As already discussed, CTWs appear to dissipate in the Agulhas Current north of East London, which leads to a markedly different regime north of the Kei Estuary and into KwaZulu-Natal.
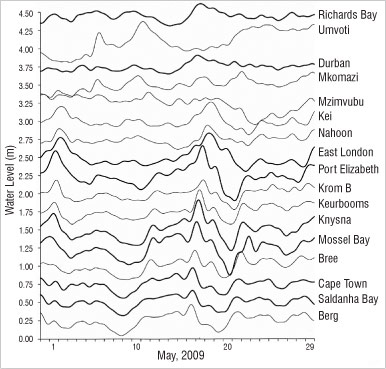
Figure 5: Water level measurements at ports around South Africa (dark lines) and at selected estuaries (light lines) for a 30-day period in 2009. The water level series have been displaced vertically to ensure visibility.
In particular, sea level at Durban and Richards Bay does not exhibit the large variations seen at the southern sites, although on 16 May there is evidence of a northward propagating event with a total amplitude of about 25 cm. However, the Mzimvubu, Mkomazi and Umvoti Estuaries do not follow the same fluctuations.
From the beginning of May to about 19 May, the water level variability in the Mzimvubu Estuary was minor, being less than 10 cm; thereafter there was a drop of some 30 cm before a recovery is evident at the end of May. With no obvious input from the sea, rain records were consulted, and it was found that there were scattered heavy showers in the area, with Port St Johns at the mouth recording 80 mm on 20 April, followed by 15.5 mm on 26 April. On 03 May, 57 mm was recorded, followed by 6.5 mm on 10 May and nothing thereafter. It is therefore possible that there were elevated water levels in the estuary in the first half of May as a result of river inflow, although it is not clear why the level increased again at the end of May.
Begg20 reports that the Mkomazi Estuary 'may close completely in the dry season, but this is a rare occurrence', and it has been confirmed that the mouth was open in May 2009 (Forbes NT, email communication, 2012 June 15). The fact that the mouth was open makes the variability confusing, with an increasing water level trend over the whole period, particularly because the measuring site is at the mouth and there is no visual correlation with sea level variability. There is some correlation with rainfall reports, which show that there were falls every few days in April and May, with a heavy fall of 40.4 mm on 20 May.
Similarly, Begg20 states that the Umvoti Estuary 'very seldom closes', and again it was confirmed that the estuary was open in May 2009 (Forbes NT email communication, 2012 June 15). This estuary also exhibits an increasing water level trend, with some response to the reported rainfalls, particularly after 20 May.
It is clear that more information is required on these estuaries to determine reasons for the longer-period variability. One of the causes of the variability seen in Figure 5 may be the impressive sandspits that can develop at the mouths of both estuaries.20 Such spits would inhibit water exchanges, and, in particular, a river inflow of fresh water would take time to flow out; in the meanwhile water levels would rise in the estuary. It is only when particularly heavy rainfall occurs that the spit could be washed away with free exchange then occurring through the mouth of the estuary.
Sea level variations higher in the estuary
The Berg Estuary on the west coast of South Africa has a canalised mouth without the typical sill, leading to relatively unconstricted water exchanges with the sea and propagation of tidal and subtidal signals upstream for some 60 km.19,21 While it is commonly accepted that long waves in channels propagate at the shallow water wave speed c = (gh),/!, where g is the gravitational acceleration and h is the water depth,22 it was found that time lags differed for different frequencies. Schumann and Brink21 developed a simple model involving friction to explain these results, in particular showing that the amplitude of a 10-day wave remained relatively undiminished at the upper end of the estuary, while the semi-diurnal and diurnal tidal fluctuations decreased with distance upstream. This situation is depicted in Figure 6 for a 20-day period in 2004. Measurements at three tide gauge sites in the estuary are compared to those at the port of Saldanha Bay, some 60 km from the mouth of the Berg River.
It is apparent that there is a marked amplification of the long-period signal at Laaiplek, immediately within the estuary, but with little effect on the tidal oscillations; this effect may be because of the position of the oceanic measurements at Saldanha Bay. Schumann and Brink21 found that some asymmetry develops in the tides with distance upstream, probably as a result of the extensive tidal flats in some areas (Figure 6). Moreover, they tracked the propagation of the tidal signals, with delays of over 3 h at Kliphoek and more than 6 h at Jantjiesfontein, in agreement with earlier estimates by Slinger and Taljaard19.
The decrease in the tidal amplitude with distance upstream is particularly marked, whereas the longer-period signals show little attenuation (Figure 6). This pattern accords with the simple model of Schumann and Brink21; note that the spring-neap tidal variation is a result of 'beating' between the M2 and K1 periods, and, as the fundamental period amplitudes are diminished, so too is the spring-neap cycle. As can be seen in Figure 6, the net result at Jantjiesfontein is that the water level changes over periods of days are considerably greater than the tidal oscillations.
Measurements are also available from three sites in the Swartkops Estuary in Port Elizabeth, and the subtidal fluctuations are shown in Figure 7 for a 30-day period in 1993. As expected, the variability in the estuary followed that in the nearby ocean, and there is some indication of an amplification of the signals in the estuary. While there does not appear to be a definite consistency in the way a particular wave will propagate in the estuary, fluctuations lasting about 1 day seem to have been amplified to a greater extent than the longer-period fluctuations. This pattern is the case on 07, 08, 09, 13, 18 and 23 February, while the large change in sea level on 16 February resulted in smaller variations in the estuary. Reasons for such ambiguity can probably be found in the estuarine morphology.
On the other hand, from about 05-07 February there was a general increase in water level in the estuary at all three sites, which is not reflected in the Port Elizabeth harbour record. To try and explain this increase, rain records were consulted, but no rain was reported over the whole catchment for the first 8 days in February 1993.
Wave reports from voluntary observing ships were then acquired from a sector south of Africa. These wave heights are shown in Figure 7, although unfortunately such wave reports tend to be sporadic, and on many days there were no reports. Although there was no report on 05 February, it is significant that on 06 February a swell height of 6 m was reported. However, there were no reports on the following 2 days. It is very likely that such high waves would have caused a significant wave set-up at the Swartkops coast, which would have propagated into the estuary. However, the Port Elizabeth harbour is in the lee of the nearby Cape Recife, and the tide gauge within the harbour would not have recorded the wave set-up.
Finally, data are shown in Figure 8 from the Bushmans Estuary in the Eastern Cape. This measuring site is only about 1.5 km from the mouth, but there are extensive flood tidal deltas and a constrictive road bridge which serve to inhibit free exchange with the ocean. The period considered is the same as that presented in Figure 1 for Port Elizabeth, with substantial CTW activity and longer-term variations of about 0.6 m. Figure 8 shows that this variability was amplified substantially in the Bushmans Estuary, with an overall long-period variation over the 30 days of about 0.86 m. At the same time it can be seen that there was a considerable reduction in the M2 tidal amplitude, with a total variation of 1.08 m in the Bushmans Estuary compared with 1.96 m at Port Elizabeth; nonetheless, with the long-period variations included, the total excursions exceeded 1.5 m. Consequently, even this close to the mouth, the tidal range at spring tide was only slightly greater than that due to the longer-period variations - 1.08 m compared with 0.86 m. Anomalously, at neap tide on 07 September, the low tide level was higher than the high tide level on the following day.
Discussion and conclusion
A commonly accepted definition of an estuary is 'a semi-enclosed body of water which has a free connection to the open sea, extending into the river as far as the limit of tidal influence, and within which sea water is measurably diluted with fresh water derived from land drainage'22. The primary input from the sea is the daily tidal action, and because the input of fresh water is often small in South African estuaries, tidal action is the pre-determinant of the estuary limit. Generally such tidal oscillations decrease in amplitude to the estuary limit, although there may be upstream modifications of tidal amplitudes in estuaries with varying geometries.
However, the results presented here show that longer-period fluctuations must also be considered in any assessment of the dynamics of these estuaries, and indeed in the definition of the upstream extent. This is particularly the case for the south and southeast coasts, where CTWs generated by local wind systems can cause marked changes in sea level at coastal sites. Such CTWs are a ubiquitous feature of this coastal ocean, generated by the longshore winds associated with small-scale coastal lows propagating in resonance along the coast.
Moreover, it is apparent that the amplitudes of these longer-period fluctuations can increase with distance up the estuary, and can eventually exceed that of the tidal amplitudes. Dias and Fernandes23 also found that subtidal energy is stronger and propagates further than the tidal energy in the Patos Lagoon in Brazil. While tidal oscillations will continue, their upstream extent will be carried farther on the peak of such a long-period wave, and pulled back on a trough. The eventual upstream limit will be dictated by the topography rise inland.
Farther north, and particularly into KwaZulu-Natal, the longer-period oceanic fluctuations are much lower, and, correspondingly, the estuarine responses are also more muted. It appears that river inflow and mouth spits may play an important part in estuarine levels. Unfortunately there were few data available to allow the analysis to continue into this region.
While specific estuaries have been considered here, the results are general, and give an indication of the kind of variability that occurs on the South African coast and associated estuaries. Nonetheless, every estuary presents different dynamics, which themselves change with time and the movement of sediment. Thus, it is important to note that there are a range of processes to consider in analysing an estuary and different sections of an estuary present different challenges.
Moreover, it must be recognised that the results presented here have been specifically concerned with water level variability, and have concentrated on those estuaries with permanently open mouths; seasonal effects such as flooding have not been considered, but may affect transmission of the CTW signal. The mouth condition has also not been discussed in detail, primarily because of its complexity, and the requirement for different measurements, specifically at higher frequencies to incorporate higher frequency processes. However, it is generally true that longer-period variability influences shorter-period variability to a much greater extent than vice versa. As an example, penetration of surface gravity waves into an estuary is accentuated at spring high tide, and, if this event coincides with a peak of a CTW, then damage can ensue.
Consequences for human habitation along the borders of estuaries will come from higher or lower than expected water levels, particularly in the upper reaches of estuaries. In particular, consulting predicted tide levels will not necessarily give a correct value for the water levels that will be experienced. Each estuary has its own characteristics, requiring an understanding of the manner in which tidal and subtidal signals propagate.
Acknowledgements
The provision of relevant data by the following authorities is gratefully acknowledged: the South African Naval Hydrographer for sea level data at the various ports; the Department of Water Affairs for water levels in the various estuaries; the South African Weather Service for air pressure, wind and rainfall data, and the South African Data Centre for Oceanography for voluntary observing ship data. The Water Research Commission, Nelson Mandela Bay Municipality and Africoast Engineers SA (Pty) Ltd provided the facilities for the collection of water level in specific estuaries.
References
1. Schumann EH, editor. Towards the management of marine sedimentation in South African estuaries with special reference to the Eastern Cape. WRC Report No.: 1109/1/03. Pretoria: Water Research Commission; 2003. [ Links ]
2. Shillington FA. Low frequency 0.045-Hz swell from the Southern Ocean. Nature. 1981;290:123-125. http://dx.doi.org/10.1038/290123a0
3. Kang K, Iorio DD. Depth- and current-induced effects on wave propagation into the Altamaha River Estuary, Georgia. Estuar Coast Shelf S. 2006;66(3-4):395-408. http://dx.doi.org/10.1016/j.ecss.2005.09.008
4. Zhang P, Schumann EH, Shone RW. Effects of a storm surge coincident with a high spring tide in the Gamtoos Estuary, May 1992. S Afr J Sci. 1995;91:412-414.
5. Raubenheimer B, Guza RT, Elgar S. Field observations of wave-driven setdown and setup. J Geophys Res-Oceans. 2001;106:4629-4638. http://dx.doi.org/10.1029/2000JC000572
6. Open University. Waves, tides and shallow-water processes. Oxford: Pergamon Press; 1989. [ Links ]
7. Pond S, Pickard GL. Introductory dynamical oceanography. 2nd ed. Oxford: Pergamon Press; 1983. [ Links ]
8. Gill AE. Atmosphere-ocean dynamics. London: Academic Press; 1982. [ Links ]
9. Preston-Whyte RA, Tyson PD. The atmosphere and weather of southern Africa. Cape Town: Oxford University Press; 1988. [ Links ]
10. Schumann EH, Brink KH. Coastal trapped waves off the coast of South Africa: Generation, propagation and current structures. J Phys Oceanogr. 1990;20:1206-1218. http://dx.doi.org/10.1175/1520-0485(1990)020< 1206:CTWOTC>2.0.CO;2
11. Jury MR, MacArthur C, Reason C. Observations of trapped waves in the atmosphere and ocean along the coast of South Africa. S Afr Geogr J. 1990;72:33-46. http://dx.doi.org/10.1080/03736245.1990.10586373
12. Schumann EH. Long-period coastal trapped waves off the southeast coast of South Africa. Cont Shelf Res. 1983;2(2/3):97-107. http://dx.doi.org/10.1016/0278-4343(83)90010-9
13. Brink KH. On the damping of free coastal trapped waves. J Phys Oceanogr. 1990;20(8):1219-1225. http://dx.doi.org/10.1175/1520-0485(1990)020<1219:OTDOFC>2.0.CO;2
14. Reddering JSV Schumann EH. Sedimentation: Causes and processes. In: Schumann EH, editor. Towards the management of marine sedimentation in South African estuaries with special reference to the Eastern Cape. WRC Report No.: 1109/1/03. Pretoria: Water Research Commission; 2003. [ Links ]
15. Schumann EH, Largier JL, Slinger JH. Estuarine hydrodynamics. In: Allanson BR, Baird D, editors. Estuaries of South Africa. Cambridge: Cambridge University Press; 1999. p. 27-52. http://dx.doi.org/10.1017/CBO9780511525490.003 [ Links ]
16. Friedrichs CT, Aubrey DG. Non-linear tidal distortion in shallow well-mixed estuaries: A synthesis. Estuar Coast Shelf S. 1988;27:521-545. http://dx.doi.org/10.1016/0272-7714(88)90082-0
17. MacKay HM, Schumann EH. Tidal and long-period water level variations in the Sundays River estuary, South Africa. S Afr J Sci. 1991;87:597-600.
18. Schumann EH, Pearce MW. Freshwater inflow and estuarine variability in the Gamtoos Estuary, South Africa. Estuaries. 1997;20(1):124-133. http://dx.doi.org/10.2307/1352726
19. Slinger JH, Taljaard S. Preliminary investigation of seasonality in the Great Berg Estuary. Water SA. 1994;20:279-288.
20. Begg G. The estuaries of Natal. Natal Town and Regional Planning Report Vol. 41; 1978. [ Links ]
21. Schumann EH, Brink KH. Tidal and subtidal water level fluctuations in the Berg Estuary. Trans Roy Soc S Afr. 2009;64(2):181-189. http://dx.doi.org/10.1080/00359190909519251
22. Dyer KR. Estuaries: A physical introduction. Chichester: John Wiley and Sons; 1997. [ Links ]
23. Dias JM, Fernandes EH. Tidal and subtidal propagation in two Atlantic estuaries: Patos Lagoon (Brazil) and Ria de Aveiro Lagoon (Portugal). J Coastal Res. 2006;39:1422-1426.
 Correspondence:
Eckart Schumann
26 Marine Gardens, Glengarry Crescent, Humewood
Port Elizabeth 6001, South Africa
Email: eckarts@mweb.co.za">eckarts@mweb.co.za
Received: 15 June 2012
Revised: 03 Sep. 2012
Accepted: 10 Sep. 2012
© 2013. The Authors. Published under a Creative Commons Attribution Licence.

