


Serviços Personalizados
Artigo
 Inglês (pdf)
 Artigo em XML
 Referências do artigo
Indicadores

Links relacionados
-
 Citado por Google
 -
 Similares em Google
Compartilhar

 Permalink
South African Journal of Science
versão On-line ISSN 1996-7489
versão impressa ISSN 0038-2353
S. Afr. j. sci. vol.109 no.3-4 Pretoria Jan. 2013
RESEARCH ARTICLE
Application of geospatial technology for gap analysis in tourism planning for the Western Cape
Johannes H. van der Merwe; Adriaan van Niekerk
Department of Geography and Environmental Studies, Stellenbosch University, Stellenbosch, South Africa
ABSTRACT
We report on the use of modern spatial computing technology in the development of spatial tourism policy and planning in the context of a bounded resource base. We refer briefly to provincial tourism development policy, expand on the tourism marketing framework and use the express tourist preferences to determine suitability indicators or attraction features for a spatial tourism resource base, paying special attention to the conceptual foundations of attraction and the mapping of tourism potential variables. We applied the methodology to a combination of tourism products in the Western Cape Province of South Africa in an approach that involved applying the spatial multiple criteria evaluation through the weighted linear combination of spatial factor layers as images in a geographical information system. We performed an analysis of the gap between tourism potential and tourism resource provision at a spatial resolution of individual towns' spheres of influence, as represented by Thiessen polygons. The outcome in map format demonstrates the applicability of the technique to the Western Cape. The fine-scale spatial result was analysed for its strategic planning implications. Our results are useful for entrepreneurial and regulatory planning and can be replicated in different spatial locations if the appropriate database can be constructed.
Keywords: geographical information system; multiple criteria evaluation; tourism planning; spatial planning; Western Cape
A spatial planning approach to tourism development
Tourism, as a leading economic sector, uses spatial landscapes and features - naturally occurring and human-made - to exploit tangible and intangible environmental resources as attractions for generating income from the tourism market. The Western Cape Province of South Africa is a premier tourism destination; its development potential is entrenched in a rich natural and cultural resource base and a well-developed tourism infrastructure. Yet provincial space is unevenly endowed with natural and human resources - ranging from verdant coastal plains and mountain valleys studded with substantial urban concentrations to seemingly barren inland plains. The geographic complexity and diversity of situated resources1 as products of their biophysical properties and the political, social, and economic framework in which they are produced, provide the province with a suitable resource base for the further development of tourism. Globally, coordinated regional planning approaches promote tourism as a strategy for the growth of individual businesses or communities.2,3 Moreover, the tourism market has evolved from single-product offerings to multiple-region or space-based markets with diversified character.4 Developing such markets raises key decision-making questions such as where government and private industry should target tourism development in the Western Cape Province and where, spatially and product-wise, tourism can and should help to sustainably diversify its total tourism product.
Tourism development policy for the Western Cape's provincial space has been addressed by consultants who developed an integrated tourism development framework (ITDF) according to the policy foundations of the provincial White Paper on tourism.5,6 This framework reviewed tourism potential through an assessment of tourism product; plant (built superstructure) and infrastructure; supply patterns; possible portfolios; and theme routes, and matched these with the demand from primary and secondary international and domestic markets that may potentially use the destination. This approach led to the identification of a formal, coarse-resolution hierarchy of foci for spatial tourism development, namely gateways, distribution points, routes and destinations.6 The plan identified 11 coarse-resolution, generalised nodes and corridors (tourism development areas) worthy of further development.
A geographical information system (GIS) is a key tool for analysing the tourism resource base spatially and providing insights into planning challenges. We previously7,8 performed a spatial gap analysis and audit of tourism for the Western Cape Province to match domestic and international market trends with tourism opportunities (the plant-market match) and demonstrated the efficacy of GIS in spatial analysis. As an operational and analytical tool, GIS has not been extensively used for higher-level applications like modelling of spatial phenomena, but it has been institutionalised for the one-dimensional management of the inventorisation and display of spatial features like utility networks (e.g. roads, pipelines, power lines) and natural resources (e.g. vegetation, mineral and water resources). GIS applications for modelling complex human, natural and economic processes and systems have lagged behind. In this paper, we demonstrate the application of multicriteria evaluation (MCE) in GIS to support decision-making regarding the development of and investment in tourism ventures and infrastructure in provincial space with an unequal resource endowment. The principles of MCE are explained, gap analysis in tourism planning is described, and both are applied on a GIS platform to locate tourism development opportunities in the Western Cape Province. The methodology is adaptable for application elsewhere.
Research design and methods
Figure 1 shows that the 13-step spatial MCE and gap analysis approach followed in the research can be broadly divided into two separate parts: the mapping of individual product potentials and an all-product gap analysis.
MCE application for mapping tourism product potential
Previously,8 the first eight sequential steps were performed for each of the seven separate tourism products listed in Supplementary table 1 (see online supplementary material), culminating in seven product-potential GIS images (maps). These steps encapsulate the generic MCE procedure which entailed:
- Interpretation of spatial development policies to culminate in the provincial ITDF (Step 1)
- Use of market survey information about visitor patterns and trends and product preferences to perform market segmentation and determine spatial attraction factors for each segment (Steps 2 to 4)
- Selection and mapping of spatial variables in a digital and score-standardised GIS database of tourism attractions, plant and supporting resources and services (Step 5)
- Calculation of the potential of seven tourism products following a weighting of factors and an application of MCE in GIS to map each product at a detailed, high-resolution (1 km2) scale (Steps 6 to 8).
In the first part of the paper we overview the results of these exercises.
Gap analysis
Understanding the tourism landscape means knowing where strength of product is located and what the existing and future market requirements are. Gap analysis, as an analytical method, has been conceptualised and defined by Gauteng Tourism9 as:
Analysis [that] compares tourism trends and market requirements with the prevailing situation at a particular destination. The gap analysis Identifies where tourism supply may not match tourism demand and...should also indicate gaps in the spatial distribution of the tourism products and...untapped resources (human, natural and cultural) that could be converted into tourism products.
The gap analysis for this study was designed as a classical resource-base-plant-market-match10,11 to inform the envisaged ITDF as the basis for the development of tourism products and marketing strategies in the Western Cape. The gap analysis process followed these sequential steps:
- Combining the seven individual product opportunity images into a single tourism product potential image by repeating the MCE procedure of Steps 6 and 7 in Steps 9 and 10
- Applying Steps 11 and 12 to collapse detailed spatial indication (1-km2 cells) to 131 urban centres as spatial units through Thiessen polygonisation of plant provision (tourism accommodation) and development potential (combined products) images
- Concluding with Step 13 by subtraction in GIS to show where over-and underprovision (the gap) of tourism development is evident.
In the sections of the paper that follow, we elaborate on the method and results of applying the final five steps.
Multicriteria evaluation in GIS
Malczewski12 aptly describes GIS-MCE as 'a procedure that transforms and combines geographic data (input maps) and the decision-maker's (expert's or agent's) preferences into a decision (output) map'. It is necessary to briefly review trends in the field of MCE application and to explore the technical elements essential to understanding the spatial MCE procedure and evaluating its application.
Recent applications of MCE in GIS
Malczewski12 has exhaustively reviewed more than 300 articles published between 1990 and 2004 on a wide variety of aspects of MCE application in GIS. Some trends in MCE application in GIS since then are summarised here. By 2000, this methodology had earned the reputation as 'perhaps the most fundamental of decision support operations in geographical information systems'13 - a fact borne out by the wide reach of reported applications. Concerning application domains and decision problems, Malczewski12 reported that 70% of the articles covered environmental and ecological planning and management, transportation analysis, urban and regional planning, waste management, hydrology and water resource analysis and planning, and agricultural and forestry land suitability and allocation. The other 30% treated natural hazard (mostly floods and fire) management, but also recreation and tourism management, housing and real estate management, geological and geomorphological analysis for site suitability determination, industrial facility management and pure cartography.
These foci have shifted little since 2004 so that locating suitable land for various types of land use analysis and management,14 especially in selecting suitable sites for general development uses,15,16 specifically housing17 in urban planning and crop types18 in rural planning, still dominate. Interest has emerged in 'cyberplanning',19 the efficient location of recreational and general8 nature-based20 and ecotourism21 opportunities, activities and facilities like trails.22 Environmental and ecological planning and management have remained major interests with applications to locate potential habitat sites,23 and zone parks and nature areas for conservation,24 protection25 and recreational use.26
Servicing the needs of municipal services has remained high on research agendas, with applications to locate sites suitable for urban waste landfill27-30 as well as rural waste management31 being prominent. A significant shift towards servicing the needs of urban operational markets through harnessing spatial technology has become apparent in the development of models for simulating and guiding the urban property buyers' searches32-34 for suitable properties to purchase. Esoteric, yet innovative, solutions have been developed for modelling groundwater contamination,35 monitoring deforestation and erosion,36 mapping indicators of urban quality of life,37 demarcating airport noise zones38 and determining the military trafficability of terrain and routes.39 These convincingly demonstrate the versatility of the technology.
It is evident that MCE application has reached an advanced stage of sophistication and widely recognised usefulness. Assuming that the cited examples are regionally representative, it is noteworthy that 60% of the studies originated in high-income countries, 25% in those classified as middle-income (among which is South Africa) and 15% in low-income countries. Certainly this finding warrants attention in expanding the implementation of the technology into the management of areas with the greatest need for it.
Calculations in MCE
Ideally, human decision-making should weigh up many influencing factors to reach objective, balanced and logical conclusions. This principle is realised in spatial decision-making through overlaying spatial variables (mapped phenomena) and analysing their cumulative superposed influence. The cumulative or clustering effect in the attraction value of proximate tourism resources40 can be harnessed in this manner. This combination of the spatial manifestations of classical complex human and natural systems41 refashions different landscapes into a categorisation scheme comprising related resources. This method has been greatly refined and simplified in geoinformatics as a MCE for application in GIS.42 The modelling methodology is intended for application in a raster-modelling format (as opposed to the vector format of geographical feature data captured as points, lines or polygons in GIS). The procedure combines criterion values (in each raster image cell across all layers) mathematically in the GIS MCE module to form single potential images via a weighted linear combination formula:

where W. is the weight of factor i, and Xi is the criterion score or cell value of factor i.
Weighting of factors
Combining the coded georeferenced themes in GIS requires standard procedures of uncomplicated overlaying and the use of map algebra. All variable images entered into the equation carry the same weight and contribute equally to the result. This process contradicts the normal course of decision-making where factors variously exert influence to sway a decision. Consequently, Steps 6 and 9 of the MCE process (Figure 1) call for variables to be differentially rated and weighted. The prescribed weighting process for MCE applications demands that all proportional weights assigned to participating factors sum to 1 (or, if percentages, to 100%). The weights are calculated according to Saaty's43 reciprocal matrix method in which each variable is compared to and scaled for importance relative to all other variables in the equation on a scale of 1 to 9 (positive and negative). The procedure calculates the weights from the values provided and performs a consistency check. The consistency value must be less than 0.1.
The propagation of spatial feature influence in GIS
The criteria used in a MCE are based on spatial relationships or situation characteristics. Situation factors measure the exposure that each raster cell has to resources or land uses that generate spatial externalities for the activity being sited.23 During Step 2 (Figure 1) the distance from target features to each cell in the factor image is calculated in metres by a standard GIS procedure. This calculation enables the logical object-based influence, or potential-generating effect of features in the landscape,44 to extend beyond its immediate physical presence or footprint in that landscape. By letting individual layers of resource elements propagate their relative influence over tourism-potential space, both the numerical value of a feature type (denoting intensity of the phenomenon's occurrence) and the nature of the location it refers to must be factored in. Influence distance is thus made dependent on the relative intensity (e.g. size, quality, rating) value of the target feature.45 When feature values denote mere presence or absence (as in Boolean values) the feature class exercises a linear distance effect radiating in constantly diminishing quantity away from the feature. However, when features or various members thereof (e.g. point features like towns) are rated along a value range (i.e. ordinal or scale variables) the distance effect for higher-valued features or their parts must extend farther according to the segment value - examples are roads of different classes or facilities with different quality or size ratings. The rate of influence decay of a feature with increasing distance from that feature need not be constant (a linear function) as it may be a logarithmic or similar function. This presupposes some empirical knowledge or measurement to calibrate the function. In this particular application all distance influence propagation was linearly calculated and classified into equal-interval, potential-generating class values.
Allocating tourism development space in the Western Cape
Given the principles of spatial modelling and its application, the drivers - identified by market intelligence of the provincial tourism market - that inform the calibration of MCE modelling are outlined next.
7ourism types and their product preferences
The spatial resource base for tourism is multifaceted as it encompasses a variety of phenomena and features that attract tourists as spectators, as activity participants or for environmental education.46 Tourism is a broad term covering a host of narrower niche products and definitions47 not fully explored here. Market intelligence about attraction preferences, originally collected in empirical surveys of tourists' preferences in the Western Cape,48,49 was gleaned from standard national statistical sources50-54 and was augmented by international perspectives.55-57 These sources confirmed the prominent position of the Western Cape in the international tourism market and identified the Province's competitor destinations regarding natural beauty, wildlife and culture.6,58 Consumer preferences or linking-product-to-market analyses show that most product development occurs around the natural resource base, the cultural product, the family product and affordable attractions.
Market segmentation
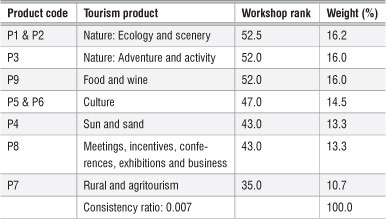
Eleven tourism experts (named in a workshop report8) were selected to identify and prioritise the tourism product for the Western Cape. They reached consensus on the 16 prioritised products listed in Table 1. This range concurs with the tourism industry's opinion51 that new areas for tourism beyond the traditional tourism routes and nodes must be developed if tourism is to significantly affect poverty and unemployment - two major motivators of tourism development in developing countries. Ranking of products was done on a five-point Likert scale (ranging from very important to very unimportant) to yield the weighted response frequencies and bracketed rank numbers (Table 1). Count values ranged between 11 and 55. The method resulted in several products obtaining equal ranking with even the lowly ranked items receiving strongly significant (>60%) support from participants. As expected, the nature-, culture- and cuisine-based products were given precedence. The product listing follows rank order, but according to the logic of GIS methodology the spatial potential for the development of only some products must be evaluated by GIS with product selection based on items' likelihood of overall provincial relevance and availability of data to populate model applications.
Consequently, the nine products emboldened in Table 1 were subjected to potential mapping (Step 7). For the final application, and because they have similar attraction resources, products 1 and 3 were combined to form one nature-based product and products 5 and 6 combined as one culture-based product; therefore seven product potential maps were generated.
Selection of spatial variables per tourism product
The selection of variables (Step 5) was based on the assumption that the tourism potential of a spatial entity (place, location or area) is determined by the range of activities, facilities or resources available at the site and in its vicinity; the site's accessibility; and the presence of support services. These manifest as resource factors that collate the contributory effects of the individual variables57 and they are used beneficially for tourism in a given area. Spatial factors possess, and in tourism space express, a specific sphere of influence23 gauging the distance from which prospective tourists will be attracted to a destination and the distance to which the local attraction influence extends to cumulatively enhance other local resources or products. Each factor is expressed as an attraction-factor value in terms of its quality (a closer resource of higher quality attracts a tourist more strongly). In GIS, proximity is typically measured by the Euclidian distance from all locations in the experimental space to some target feature (e.g. the distance from each image grid cell to a road of a given class).
The 56 variables selected from a databank of 80 mapped variables7 to measure the potential for the seven priority products are listed in Supplementary table 1 online. In functional combinations they form the criteria (or factors in MCE) for which to measure potential for each product. Some factors were operationalised as single variables (indicated by bullets in the table), and others were combined as coherent indexes measuring some aspect of the tourism potential (variables are numbered to indicate membership of an indexed variable). Combining some of the variables removed some redundancy while retaining the influence of the individual variables59 and made MCE execution less cumbersome. From 12 to 15 factors were combined to map the potential of various products. The selected variables captured unique spatially variable characteristics of the provincial landscape as indicator sets to gauge natural environmental aesthetics and interests, climatic comfort, cultural attraction diversity represented by human heritage resources, transportation connectivity, human population and settlement development levels, and endowment of tourism support services (especially travel comfort and security).
After differentially weighting the factors for each product, Step 7 of the MCE procedure was performed for each tourism product and seven maps of tourism potential were produced.
Location of the Western Cape combined tourism product
Following the successful rating of the potential of seven individual products according to the methodology shown in Figure 1, Steps 9 and 10 - which combined the individual product images as an indicator of the relative importance of all products at locations and in regions - were performed. The seven products' images listed in Table 2 were used in an MCE application, each product being weighted according to indications given by workshop experts (see Table 1). The high consistency value was achieved by applying the weighting procedure available from the Canadian Conservation Institute's online facility (http://www.cci-icc.gc.ca/tools/ahp/index_e.asp) that allows the values to be entered in a matrix or a line-by-line mode. The subsequent MCE run produced a map of the combined tourism products for the Western Cape (Figure 2). The clearly discernible patterns contain locational strands from all combined images, i.e. urban cores, and coastal and mountain-range natural-area clusters with sinuous fingers of higher potential snaking up river valleys and along major transportation routes. The dominant southwestern cluster bounded by the tourism nodes Hermanus, Swellendam, Ceres-Tulbagh and Cape Town is the Province's core area of tourism potential. Another major concentration core stretches from Stilbaai via Oudtshoorn-De Rust to the Garden Route.
Table 2: Spatial factor weights for the calculation of all products’ potential
Apart from the major clusters, there are many lower-ranked rural and corridor-linked concentrations with significant medium-high and even medium attraction levels, all emphasising the excellent potential of tourism products throughout the Province. Town-centred clusters along the West Coast, Overberg, Little Karoo and islands like Beaufort West are notable. The potential tourism hotspots have been successfully demarcated, offering a high-resolution (1 km2) spatial indication for selecting local areas where specific initiatives can be launched or sponsored subsequent to fine-scale analysis.
Determining the gap
Once the potential for the combined tourism products had been spatially established, demarcated and mapped, it remained to determine the opportunities for the development of plant and product marketing in provincial space. This section introduces the methodology developed for this task and presents the results of the gap identification exercise.
Principles and methodology
After the two basic elements of a spatial gap analysis, namely the location of tourism product potential and the distribution of the salient elements of tourism plant7,8 (accommodation facilities and restaurants), had been established and captured, a method was devised to perform the key analysis of plant-market match. In principle, this method involved comparing the Province's current pattern of spatial tourism production (development and investment) with the spatial distribution of the tourism potential or opportunity. The gap is the difference between the proportion of total investment in a product in a demarcated area and the tourism potential of that area.
The nature of available tourism data dictated that accommodation facilities were the most useful for calculating the gap. Even so the database7 lacked some quantitative variables (e.g. number of beds and accommodation units) for a significant number of facilities, so the number of establishments per town was the only useful determinant of plant supply. This variable could be compared to the combined product potential collated to a grid with a 1-km resolution. This required aggregation to town level, for which several aggregation principles were formulated. Firstly, to be of value, the gap identification and possible recommendations had to be strategically enabled at some local level. It was deemed logical and practical to not merely point to broad patterns, but to couple spatial units at a resolution where investment action would be enabled - at either municipality or town level. The individual town was selected as the unit for gap analysis, because it directly addresses the local community and its potential entrepreneurship, still allowing aggregation to be valid at a higher municipal level. This approach met the basic motivations of a provincial gap analysis, namely that opportunity should be spread to the relatively undeveloped parts of the province where tourism might most benefit development initiatives or where human development needs and inherent tourism potential might be optimally serviced.
Secondly, this approach meant that tourism potential had to be aggregated to each of the 131 officially recognised towns in the Province in a five-step procedure:
1. A spatially exhaustive network of equidistant Thiessen polygons expressing the extent of spatial influence was constructed in GIS around the town set to cover the whole Province, as shown in Figure 3. While population numbers may have given more realistic demarcations of spheres of influence, they were not used because the potential growth stimulus of tourism had to be actively directed, even at small towns with more pressing development needs.
2. Tourism potential calculated per square kilometre (Figure 2) was collated to the level of a town's Thiessen polygon for the combined tourism potential product.
3. Based on the area in each potential class (values between 1 and 5), an average potential value per polygon was calculated from the square-kilometre grids. Average potential classes were distinguished by Jenks'60 natural breaks method and mapped in Figure 3 (only four populated here because of the particular value range). The effect of this manipulation to generalise and collate the local occurrence value of tourism potential is quite clear when comparing the spatial intensity patterns of Figures 2 and 3.
4. A similar calculation was done for the accommodation (tourism plant) facilities per town and expressed as the density of establishments per square kilometre per town catchment and classified into five intensity classes by natural breaks. The mapped result is displayed in Figure 4 which shows high concentrations of plant in core tourism areas (Plettenberg Bay, Knysna, Cape Town, Stellenbosch and Hermanus).
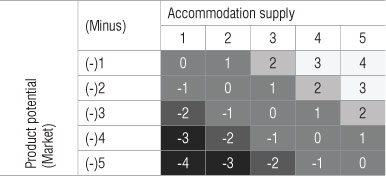
5. Finally, GIS was used to match the tourism product pattern (market) with the establishment (plant) image by subtracting product potential (market) values from plant (accommodation facilities) provision values according to the scheme shown in Figure 5. The result is a set of values ranging between -4 (undersupply) and +4 (oversupply of facilities). The resulting gap image displays this shading range to indicate towns with relative under- or overprovision.
Figure 5: Calculation methodology for the gap between tourism potential and tourism resource provision.
Results of the gap analysis
The results of the gap analysis shown in Figure 6 must be interpreted - given the mode of analysis - in relative terms and not as absolutes. The spatial pattern reveals few places with a relative overprovision (the medium-low (2) and the low (>2) gap values) of tourism infrastructure for the combined tourism product and thus limited gap for further development. While additional potential for tourism may indeed exist locally (it was not tested in absolute terms in this research), users familiar with the provincial geography will note that plant and market are currently mismatched to the point of relative overdevelopment of infrastructure around the following places:
• On the southeast coast, particularly Knysna and Plettenberg Bay, but also Stilbaai - these are established coastal holiday centres
• Hermanus and Stellenbosch - both are well-established tourism centres
• A string of central West Coast towns from Yzerfontein to Velddrif, Aurora and Redelinghuys
• The northwestern horn of the Province - where spring flowering (rather ephemeral and seasonal) and rare succulent vegetation constitute the main tourist attraction
• Vredendal in the Olifants River valley and towns on the dry Knersvlakte
• Merweville - a lonely outlier in the Great Karoo.
These places and areas are either fairly sparsely populated and dry with relatively low cultural tourism potential or those with existing good tourism development (mostly high potential for products like sun, sea and sand).
Most of the central interior from the West Coast through the Great Karoo to Murraysburg in the northeast and along a south-trending central corridor through Swellendam to the southern Cape at Agulhas show medium development opportunity (gap values between -1 and 1). Similar poorly defined clusters of opportunity are observable around Cape Town and in the southern Cape - regions with well-endowed tourism potential and established infrastructure or regions less well-endowed with poorly developed infrastructure, which thus possess some development potential.
Notable development opportunities (medium-high (-2) and high (<-2) gap values) for all tourism development exist around these core areas:
• The northwestern group which comprises Clanwilliam and Citrusdal (the Cederberg core) and the mountainous extension to Elandsbaai on the coast.
• A string of towns from Hopefield in the Swartland, bulging to cover most of the Boland and upper Breede River valley districts, and extending to the southwestern coastal belt. Notable among this group with its well-endowed natural and cultural resource base are the premier mountain-centred regions of De Doorns, Franschhoek, Villiersdorp, Grabouw, Botrivier and Hawston.
• An extensive eastward-trending belt of districts includes coastal towns like Witsand and Gouritsmond and most of the towns on the Garden Route coastal bench. Here peak potential manifests in the Outeniqua Mountain-centred Friemersheim (inland from the Little and Great Brak River complex) and the Rheenendal-Buffelsbaai (bordering on Knysna) vicinities.
• A clutch of districts centred on the Swartberg range and some smaller mountain complexes form a contiguous zone of medium-high gap potential in most of the Little Karoo from Barrydale in the west via Ladismith, Calitzdorp, Oudtshoorn and De Rust to the Langkloof towns of Uniondale and Haarlem. This famed Route 62 corridor offers some tourism pearls in a part of the Province where human need is great and the potential for investment in tourism is high.
The results of this study clearly confirmed the validity of the coarsely defined core tourism areas captured as gateways, distribution points, routes and destinations proposed as tourism development areas by the DEDTA.6 These areas were delimited as the established 'core areas' and associated 'gateways' of the Cape Metropolitan Area, Stellenbosch-Paarl-Franschhoek, Overstrand, Mossel Bay-George-Oudtshoorn and Wilderness-Knysna-Plettenberg Bay (Eastern Gateway). Potential growth areas were identified at Beaufort West (Northern Gateway), Van Rhynsdorp-Cederberg (Cederberg Gateway), Cape Agulhas and Langebaan-Velddrif. The value of the study lies in its ability to demarcate micro locations within these areas as realistic development targets.
Conclusion and recommendations
We met our aim to collate, map and interpret the spatial patterns of existing tourism product and experiences in the Western Cape and to perform a gap analysis and audit to spatially match domestic and international market requirements (product) to the plant inventory. The opportunities for developing tourism product and experiences were identified through a spatial search and modelling by advanced GIS functionalities. The concrete deliverables from the market research and gap analysis in GIS consist of five areas of interest:
1. Nine market segments were selected and prioritised.
2. Destination attraction definitions were translated into spatial operational format for the tourism product.
3. A spatial database of phenomena representing tourism potential (natural resources as well as superstructure in the form of human-made plant) was captured to express indices of tourism potential.
4. Spatial models were built in GIS to perform the spatial search, collation and demarcation of potential destination areas for the tourism product at a spatial resolution of 1 km. The provincial demarcation scale of a 1-km2 grid delivered accurate and insightful spatial results to serve as a development template for tourism planning in the province.
5. A spatial model was designed to identify gaps in tourism development at the detailed spatial resolution of individual towns and their service hinterlands. The gap analysis identified and demarcated target areas, towns and districts at a suitable scale on which to base policy and investment decisions. This optimistic pronouncement does, however, bear the caveat that users of these results must understand the methodology followed and cautiously interpret the determining effects in deriving the results.
Growth in the Western Cape's tourism industry cannot merely be about plant expansion, but must be about sustained investment behind clear choices about how to differentiate the region into important target markets for the development of destinations. In the minds of foreign consumers, the South African product remains mainly an adventure-filled wildlife destination with striking natural beauty, but with the cultural assets largely unclear and undifferentiated from those of the rest of the continent. A successful strategic development strategy for the tourism industry must involve early identification of stale products and constant redefining, upgrading and refreshing of products and services to deliver on the promises made by the marketing message.51 The outcome of this gap analysis can play a major role in filling some of the product and service gaps. This analysis contributes to the larger picture of the Western Cape's tourism resource potential and can inform the planning of tourism destinations in the Province, especially the reviewing of the ITDF6 for the Western Cape Province. Ultimately, the results should alert landowners to the unrealised value of their land for exploitation by tourism, stressing their need to practice proper and environmentally beneficial land management.
Acknowledgements
The expert participants are gratefully thanked for their insights during the tourism workshop and the reviewers for their valuable comments.
Authors' contributions
J.H.v.d.M. was the project leader, coordinated the research and wrote the paper. A.v.N. performed the computerised MCE procedure and computer mapping and reviewed the text.
References
1. Olson BA. Paper trails: The Outdoor Recreation Resource Review Commission and the rationalization of recreational resources. Geoforum. 2010;41(3):447-456. http://dx.doi.org/10.1016/j.geoforum.2009.11.014 [ Links ]
2. Ecker S, Clarke R, Cartwright S, Kancans R, Please P Binks B. Drivers of regional agritourism and food tourism in Australia. Canberra: Australian Bureau of Agricultural and Resource Economics - Bureau of Rural Sciences; 2010. [ Links ]
3. Kiper T. Land use planning regarding sustainable development through agritourism: §arkõy example. J Agric Biotechnol Sustainable Dev. 2011;3(8):171-181.
4. Ohe Y Ciani A. Hedonic pricing evaluation on agritourism activity in Italy: Local culture-based or facility-based? 116th EAAE seminar on Spatial Dynamics in Agri-food Systems: Implications for Sustainability and Consumer Welfare,; 2010 October 27-30; Parma, Italy. [ Links ]
5. DEAAT. White paper on sustainable tourism development and promotion in the Western Cape. Cape Town: Department of Economic Affairs, Agriculture and Tourism; 2001. [ Links ]
6. DEDTA. An integrated tourism development framework. Cape Town: Department of Economic Development, Tourism and Agriculture; 2002. [ Links ]
7. Van der Merwe JH, Ferreira SLA, Van Niekerk A. A GIS database of tourism infrastructure in the Western Cape Province. Centre for Geographical Analysis Report No 01/2007. Stellenbosch: Stellenbosch University; 2007. [ Links ]
8. Van der Merwe JH, Ferreira SLA, Van Niekerk A. A spatial gap-analysis of tourism development opportunity in the Western Cape Province. Centre for Geographical Analysis. Report No 01/2008. Stellenbosch: Stellenbosch University; 2008. [ Links ]
9. Gauteng Tourism. Responsible-tourism manual: Final draft. Johannesburg: International Centre for Responsible Tourism and the Gauteng Tourism Authority; 2006. [ Links ]
10. Darbyshire J, Devitt J, Krenz A, Meier B, Mercer A, Meyer J, et al. Chase tourism inventory and gap analysis. Kamloops, Canada: Thompson Rivers University; 2005. [ Links ]
11. Laird D, Graham H. Tourism audit and gap analysis [homepage on the Internet]. c2007 [cited 2008 May 18]. Available from: http://merritmarkettinggroup.com/index.php?option=com_content&task=view.html [ Links ]
12. Malczewski J. GIS-based multicriteria decision analysis: A survey of the literature. Int J Geogr Inf Sci. 2006;20(7):703-726. http://dx.doi.org/10.1080/13658810600661508 [ Links ]
13. Jiang H, Eastman JR. Application of fuzzy measures in multi-criteria evaluation in GIS. Int J Geogr Inf Sci. 2000;14(2):173-184. http://dx.doi.org/10.1080/136588100240903 [ Links ]
14. Trung NH, Tri LQ, Van Mensvoort MEF, Bregt K. Application of GIS in land-use planning: A case study in the coastal Mekong Delta of Vietnam. International Symposium on Geoinformatics for Spatial Infrastructure Development in Earth and Allied Sciences [document on the Internet]. c2006 [cited 2012 Jan 22]. Available from: http://library.wur.nl/file/wurpubs/LUWPUBRD_00350553_A502_001.pdf [ Links ]
15. Boroushaki S, Malczewski J. Measuring consensus for collaborative decisionmaking: A GIS-based approach. Comput Environ Urban. 2010;34(4):322-332. http://dx.doi.org/10.1016/j.compenvurbsys.2010.02.006 [ Links ]
16. Malczewski J. Local weighted linear combination. T GIS. 2011;15(4):439-455. http://dx.doi.org/10.1111/j.1467-9671.2011.01275.x [ Links ]
17. Boroushaki S, Malczewski J. Implementing an extension of the analytical hierarchy process using ordered weighted averaging operators with fuzzy quantifiers in ArcGIS. Comput Geosci Arch. 2008;34(4):399-410. http://dx.doi.org/10.1016/j.cageo.2007.04.003 [ Links ]
18. Van Niekerk A. CLUES: A web-based land use expert system for the Western Cape [dissertation]. Stellenbosch: Stellenbosch University; 2008. [ Links ]
19. De Montis A, Nijkamp P. Tourism development and collaborative evaluation: A multicriteria web based planning support system. Int J Environ Technol Manage. 2006;6(1/2):40-64. http://dx.doi.org/10.1504/IJETM.2006.008289 [ Links ]
20. Chhetri P, Arrowsmith C. GIS-based modelling of recreational potential of nature-based tourist destinations. Tourism Geogr. 2008;10(2):233-257. http://dx.doi.org/10.1080/14616680802000089 [ Links ]
21. Sepasi Y Danehkar A, Alizadeh A, Darvishsefat AA, Sharifipoor R. Environmental management planning of Hengam Island for conservation and tourism using spatial multi criteria evaluation (SMCE). Iran J Nat Resour. 2010;63(2):159-172.
22. Boers B, Cottrell S. Sustainable tourism infrastructure planning: A GIS-supported approach. Tourism Geogr. 2007;9(1):1-21. http://dx.doi.org/10.1080/14616680601092824 [ Links ]
23. Cromley RG, Huffman FT. Modelling situation factors used in MCE procedures for raster GIS. T GIS. 2006;10(2):239-251. http://dx.doi.org/10.1111/j.1467-9671.2006.00255.x [ Links ]
24. Geneletti D, Van Duren I. Protected area zoning for conservation and use: A combination of spatial multicriteria and multiobjective evaluation. Landscape Urban Plan. 2008;85:97-110. http://dx.doi.org/10.1016/j.landurbplan.2007.10.004 [ Links ]
25. Wood LJ, Dragicevic S. GIS-based multicriteria evaluation and fuzzy sets to identify priority sites for marine protection. Biodivers Conserv. 2007;16(9):2539-2558. http://dx.doi.org/10.1007/s10531-006-9035-8 [ Links ]
26. Hajehforooshnia S, Soffianian A, Mahiny AS, Fakheran S. Multi objective land allocation (MOLA) for zoning Ghamishloo Wildlife Sanctuary in Iran. J Nat Conserv. 2011;19(4):254-262. http://dx.doi.org/10.1016/j.jnc.2011.03.001 [ Links ]
27. Melo ALO, Calijuri ML, Duarte ICD, Azevedo RF, Lorentz JF. Strategic decision analysis for selection of landfill sites. J Surv Eng. 2006;132(2):83-92. http://dx.doi.org/10.1061/(ASCE)0733-9453(2006)132:2(83) [ Links ]
28. Berktay A. Selection of MSW landfill site for Konya, Turkey using GIS and multi-criteria evaluation. Environ Monit Assess. 2010;160(1):491-500. http://dx.doi.org/10.1007/s10661-008-0713-8 [ Links ]
29. Geneletti D. Combining stakeholder analysis and spatial multicriteria evaluation to select and rank inert landfill sites. Waste Manage. 2010;30:328-337. http://dx.doi.org/10.1016/j.wasman.2009.09.039 [ Links ]
30. Higgs G. Integrating multi-criteria techniques with geographical information systemsin waste facility location to enhance public participation. Waste Manage Res. 2006;24:105-117. http://dx.doi.org/10.1177/0734242X06063817 [ Links ]
31. Van der Merwe JH, Steyl I. Rural solid waste management: A planning strategy for higher density agricultural regions. J Publ Adm. 2005;40(3):295-313.
32. Rinner C, Heppleston A. The spatial dimensions of multicriteria evaluation - case study of a home buyer's spatial decision support system. Proceedings of the 4th International Conference on GIScience; 2006 Sep 20-23; Münster, Germany. New York: The Guilford Press; 2006. p. 1-10. [ Links ]
33. Albacete X, Pasanen K, Kolehmainen M. Spatial multi-criteria analysis for home buyers. Urban Dynamics & Housing Change - Crossing into the 2nd Decade of the 3rd Millennium, 22nd International Housing Research Conference; 2010 July 4-7; Istanbul, Turkey. Istanbul: ENHR; 2010. p. 1-12. [ Links ]
34. Ligmann-Zielinska A, Jankowski P Impact of proximity-adjusted preferences on rankorder stability in geographical multicriteria decision analysis. J Geogr Syst. 2010;14(2);167-187. http://dx.doi.org/10.1007/s10109-010-0140-6 [ Links ]
35. Lilburne L, Tarantola S. Sensitivity analysis of spatial models. Int J Geogr Inf Sci. 2009;23(2):151-168. http://dx.doi.org/10.1080/13658810802094995 [ Links ]
36. Bruno R, Follador M, Paegelow M, Renno F, Villa N. Integrating remote sensing, GIS and prediction models to monitor the deforestation and erosion in Peten Reserve, Guatemala. Society for Mathematical Geology XIth International Congress; 2006 Sep 3-8; Université de Liège, Belgium. Liege: SMG; 2010. p. 1-6. [ Links ]
37. Rinner C. A geographic visualization approach to multicriteria evaluation of urban quality of life. Working Paper, Department of Geography. Toronto: Ryerson University; 2006. [ Links ]
38. Van der Merwe JH, Von Holdt DS. Environmental footprint of aircraft noise exposure at Cape Town International Airport. S Afr Geogr J. 2006;88(2):177-193. http://dx.doi.org/10.1080/03736245.2006.9713860 [ Links ]
39. Gebreslasie G. A comparison of expert systems and weighted overlay analysis for military planning [thesis]. Addis Ababa: Addis Ababa University; 2009. [ Links ]
40. Weidenfeld A, Butler RW, Williams AM. Clustering and compatibility between tourism attractions. Int J Tourism Res. 2010;12:1-16.
41. Proctor W, Qureshi E. Multi-criteria evaluation revisited [document on the Internet]. c2005 [cited 2012 Jan 18]; Available from: http://www.anzsee.org/anzsee2005papers/Proctor_Multi-criteria_evaluation.pdf [ Links ]
42. Ascough JC, Rector HD, Hoag DL, McMaster GS, Vandenberg BC, Shaffer MJ, et al. Multicriteria spatial decision support systems: Overview, applications, and future research directions [document on the Internet]. c2002 [cited 2012 Jan 18]; Available from: http://www.iemss.org/iemss2002/proceedings/pdf/volume%20tre/290_ascough%202.pdf [ Links ]
43. Saaty TL. Decision making for leaders. The analytical hierarchy process for decisions in a complex world. Pittsburgh, PA: RWS Publications; 1988. [ Links ]
44. Aplin P, Smith GM. Introduction to object-based landscape analysis. Int J Geogr Inf Sci. 2011;25(6):869-875. http://dx.doi.org/10.1080/13658816.2011.566570 [ Links ]
45. Kanga S, Sharma L, Pandey PC, Nathawat MS, Sinha S. Geospatial approach for allocation of potential tourism gradient sites in a part of Shimla District in Himachal Pradesh, India. J GIS Trends. 2011;2(1):1-6.
46. Tangeland T. Why do people purchase nature-based tourism activity products? A Norwegian case study of outdoor recreation. Scand J Hosp Tour. 2011;11(4):435-456. http://dx.doi.org/10.1080/15022250.2011.619843 [ Links ]
47. Shor N, Mansfeld Y Between wine consumption and wine tourism: Consumer and spatial behavior of Israeli wine tourists. Tourism. 2009;57(4):381-403.
48. Linde A. A spatially integrated approach for tourism planning and marketing in rural mountainous areas: The Montagu region [thesis]. Stellenbosch: Stellenbosch University; 2001. [ Links ]
49. Donaldson SE. Spring visitor survey and summary of four surveys 2006/2007. Report to Cape Town Routes Unlimited. Cape Town: University of the Western Cape; 2007. [ Links ]
50. Department of Environmental Affairs and Tourism (DEAT), Department of Trade and Industry (DTI) and South African Tourism (SAT). South African tourism gearing up to be globally competitive. Pretoria: DEAT, DTI and SAT; 2005. Available from: www.southafrica.net. [ Links ]
51. South African Tourism (SAT). Tourism growth strategy (TGS) 2008-2010. 3rd ed. Pretoria: South African Tourism; 2007. Available from: www.southafrica.net. [ Links ]
52. South African Tourism (SAT). Marketing South Africa in the United Kingdom. 2nd ed. Pretoria: South African Tourism; 2007. Available from: www.southafrica.net. [ Links ]
53. South African Tourism Strategic Research Unit (SATSRU). 2006 Annual tourism report. Pretoria: South African Tourism Strategic Research Unit; 2007. Available from: www.southafrica.net. [ Links ]
54. WTTC and ACCENTURE. South Africa travel and tourism: Navigating the path ahead [document on the Internet]. c2007 [cited 2008 Mar 18]; Available from: www.southafrica.net/satourism/downloads/AR2007_Part3.pdf [ Links ]
55. Rogerson CM. Tourism and uneven local economic development: The experience of route tourism in South Africa. In Rogerson CM, Visser G, editors. Tourism and development issues in contemporary South Africa. Pretoria: Africa Institute of South Africa; 2004. p. 339-419. [ Links ]
56. Rogerson CM. Tourism routes as vehicles for local economic development in South Africa: The example of the Magaliesberg Meander. Urban Forum. 2007;18:49-68. http://dx.doi.org/10.1007/s12132-007-9006-5 [ Links ]
57. Brown G, Raymond C. Mapping spatial attributes for conservation and tourism planning in the Otways region Victoria: Survey of residents and visitors. Sydney: Sustainable Tourism Cooperative Research Centre; 2006. [ Links ]
58. DEAT. Strategic plan 2004/05 to 2006/07. Pretoria: Department of Environmental Affairs and Tourism; 2007. [ Links ]
59. Kumari S, Behera MD, Tewari HR. Identification of potential ecotourism sites in West District, Sikkim using geospatial tools. Trop Ecol. 2010;51(1):75-85.
60. Jenks GF. The data model concept in statistical mapping. Int Yearb Cartogr. 1967;7:186-190.
 Correspondence:
Johannes van der Merwe
Department of Geography and Environmental Studies, Stellenbosch University
Private Bag X1, Matieland 7602, South Africa
Email: jhvdm@sun.ac.za
Received: 17 Apr. 2012
Revised: 20 Aug. 2012
Accepted: 09 Oct. 2012
© 2013. The Authors. Published under a Creative Commons Attribution Licence.

