


Servicios Personalizados
Articulo
 Inglés (pdf)
 Articulo en XML
 Referencias del artículo
Indicadores

Links relacionados
-
 Citado por Google
 -
 Similares en Google
Compartir

 Permalink
South African Journal of Science
versión On-line ISSN 1996-7489
versión impresa ISSN 0038-2353
S. Afr. j. sci. vol.109 no.1-2 Pretoria ene. 2013
RESEARCH ARTICLE
Climate trends in southern Africa
Mark R. JuryI, II
IGeography Department, University of Zululand, KwaDlangezwa, South Africa
IIPhysics Department, University of Puerto Rico Mayaguez, Mayaguez, Puerto Rico
ABSTRACT
The observed and projected changes in the climate of southern Africa in the period 1900-2100 were analysed. Ten observed, reanalysed and model-simulated climate data sets were explored for changes in surface air temperature, rainfall, air pressure, winds, ocean currents and sea surface height. The analysis of spatial and temporal climate trends from historical observations provided a context to assess two coupled model simulations (IPSL, MIROC) based on the A1B emission scenario. Temperatures in the satellite era exhibited upward trends greater than +0.4 °C/year in the MIROC and IPSL A1B model simulations; between +0.02 °C/year and +0.03 °C/year in NCDC, HADCRU, CFS-R and NCEPe data sets; +0.01 °C/year in NCEPr and GHCN observations; and +0.002 °C/year in the ECMWF data set. Although rainfall trends in the satellite era were minimal in many data sets because of drought in the early 1980s, there was a significant downtrend in the IPSL simulation of -0.013 mm/day per year. When averaging the longer data sets together over the 20th century, the southern African rainfall trend was -0.003 mm/day per year. Other key features of the analyses include a poleward drift of the sub-tropical anticyclones and a +1.5 mm/year rise in sea surface height along the coast.
Keywords: climate change models; surface air temperature; rainfall; air pressure; sea surface height
Introduction
The fluctuating climate of Africa is governed by marine and continental interactions1 that impact economic development, especially through agriculture and water resources. Observed surface air temperatures have shown an accelerating warming trend since 1960, reaching +0.03 °C/year in places.2-4 Consequently, there has been an increase in the number of warm spells.5 In East Africa, the observed temperature trends are relatively flat.6
The trends in precipitation over Africa are less coherent, with large spatial and temporal variability.7 Multi-decadal variability prevails in the Sahel8 while central Africa has seen a small decline in rainfall.4 In southern Africa, long-term trends are weak but interannual rainfall variability has increased since 1970.9-11 The intra-decadal oscillations are recognised to be influenced by the Pacific El Nino Southern Oscillation (ENSO) and by interactions with Atlantic and Indian Ocean climates.12-14
Alongside the influence of global ocean variability, several studies have highlighted the importance of land cover and dynamic feedbacks on climate.1 An increase in vegetation cover has been linked to a cooling in the order of 1 °C in tropical Africa.15 Deforestation and atmospheric dust loadings play a role in African climate change16-20 and generate uncertainty in radiative forcing of coupled general circulation model (cGCM) simulations.21
One-third of people in Africa live in an arid climatic regime vulnerable to fluctuations9,22 and the consequent health impacts.23-26 Understanding and predicting trends in climate is a challenge that scientists face. While seasonal forecasting has helped mitigate drought cycles in South Africa, crop yields have declined in other nations.27 The marine environment has experienced climatic stresses that have contributed to changes in fishery resources.28,29 Our knowledge of multi-decadal climate forcing has matured and trends have been documented30,31 in the context of our understanding of anthropogenic influences. The effects of increasing greenhouse gas concentrations are manifest at regional scales,32 which for southern Africa include desertification.33
Southern Africa experiences large swings in rainfall over the annual cycle arising from changes in solar insolation and north-south displacement of the Hadley cell. Zonal circulations also play a key role: in summer easterly winds draw moisture from the Southwest Indian Ocean and warm Agulhas Current, whereas in winter, westerly winds bring dry air from the South Atlantic Ocean and cool Benguela Current. Year-to-year climate variability is modulated by ENSO, amongst other factors, and so the regional climate may exhibit an 'extended summer or winter'. Global climate observations, reanalysis and coupled numerical models34 are constantly improving, and regular explorations into the past and projected trends of regional climate are instructive, to determine the magnitude and extent of climate signals. Questions of concern here include: What rate and pattern of climate change is found over southern African? Are past and future trends in various data sets consistent? Such questions have also been considered in earlier work.30,35
Data and methods
The southern African region is well endowed with historical data from over 300 rainfall and more than 100 temperature stations from national meteorological services, as well as marine data sets fed by a busy shipping lane. Observed climate trends around southern Africa were analysed from gridded data sets of the Global Precipitation Climatology Center36 and Global Precipitation Climatology Project (GPCP)37 for rainfall; the Hadley-Climate Research Unit (HADCRU), the National Climate Data Center (NCDC)38 and the Global Historical Climate Network (GHCN) for surface air temperature; the Hadley Center for sea level pressure (SLP); and the University of Hawaii Sea Level Center (http://ilikai.soest.hawaii.edu/uhslc/) for coastal sea surface height. The reanalysis data sets used were the National Center for Environmental Prediction's longer ensemble version (NCEPe)39 and conventional version (NCEPr)40 (both at 2.5° resolution); the European Centre for Medium-range Weather Forecasts (ECMWF; resolution of 1.8°) 41,42; Simple Ocean Data Assimilation (SODA; resolution of 0.5°)43 for sea surface height and currents; and the Coupled Forecast Model (CFS-R, 0.5°).44
The cGCMs considered here were the Institut Pierre Simon Laplace (IPSL) and the Model for Interdisciplinary Research on Climate (MIROC) which simulate the mean patterns of climate in diverse ways (Figure 1). These two models were chosen from the Intergovernmental Panel for Climate Change (IPCC) Coupled Model Intercomparison Project Three (CMIP3) data set because they exhibit low differences between simulated and observed boundary conditions. The IPSL model developed in France is described by Hourdin45 and Krinner46, and has a dynamic global vegetation scheme with biosphere feedback via surface energy exchanges. Its horizontal resolution is ~2.5°, consistent with the NCEP data sets. The MIROC model from Japan47 utilises a higher resolution similar to the CFS-R and GPCP data sets. The MIROC boundary layer and surface flux schemes are shared with the Geophysical Fluid Dynamics model. The A1B emission scenario was used,48,49 which assumes a linear increase to a doubled CO2 by 2100. A1B is considered a 'middle of the road' scenario among the Special Report Emission Scenario choices. In hindcast, the A1B simulation is close to the 20th-century replication (20C3M) experiment, and has the advantage of forward projection data.
Climatic trends were analysed from various data sets in the 20th century, and from the cGCM simulations in the 21st century. A useful review of data sets is given in Bromwich50. Trends were calculated in the Climate Explorer website (http://climexp.knmi.nl/) by first averaging the monthly data into annual blocks. To determine the spatial pattern, a temporal linear regression was calculated per grid point and maps were contoured according to the slope. For winds and currents, the trends of scalar components were combined into vectors. Trends were highlighted at three points - (1) the southern tip of Africa, (2) the South African maize belt, and (3) the Zambezi River valley - by fitting first- or second-order regression lines to anomaly time series. Trends were intercompared for all data sets over the southern Africa plateau (20-30°S, 20-30°E) in the satellite era. In addition to atmospheric variables, analyses were performed of trends in sea surface height and the Agulhas Current using SODA and MIROC fields and coastal station data.
The observed trends 'evolved' because of multi-decadal fluctuations, rising greenhouse gases and changes in observations such as more satellites and fewer stations.51 The analysis of climate trends is complicated by small signal-to-noise ratios for variables such as rainfall,32 parameterised convection in reanalysis, inadequate cGCM simulation of surface feedback and aerosol forcing, and differing time periods. The results presented here are divided into (1) a 30-year climatology, (2) patterns of trend for temperature, rainfall and SLP (3) temporal trends at key points, (4) historical trends in atmospheric circulation, (5) sea level trend maps and trend maps at key points, and (6) trends in the Agulhas Current south of Africa.
Results
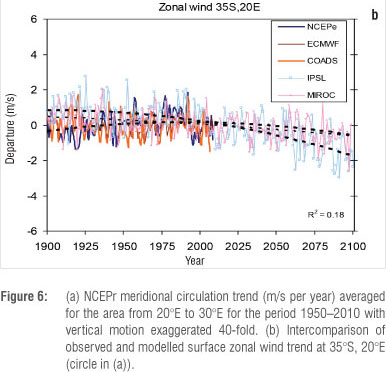
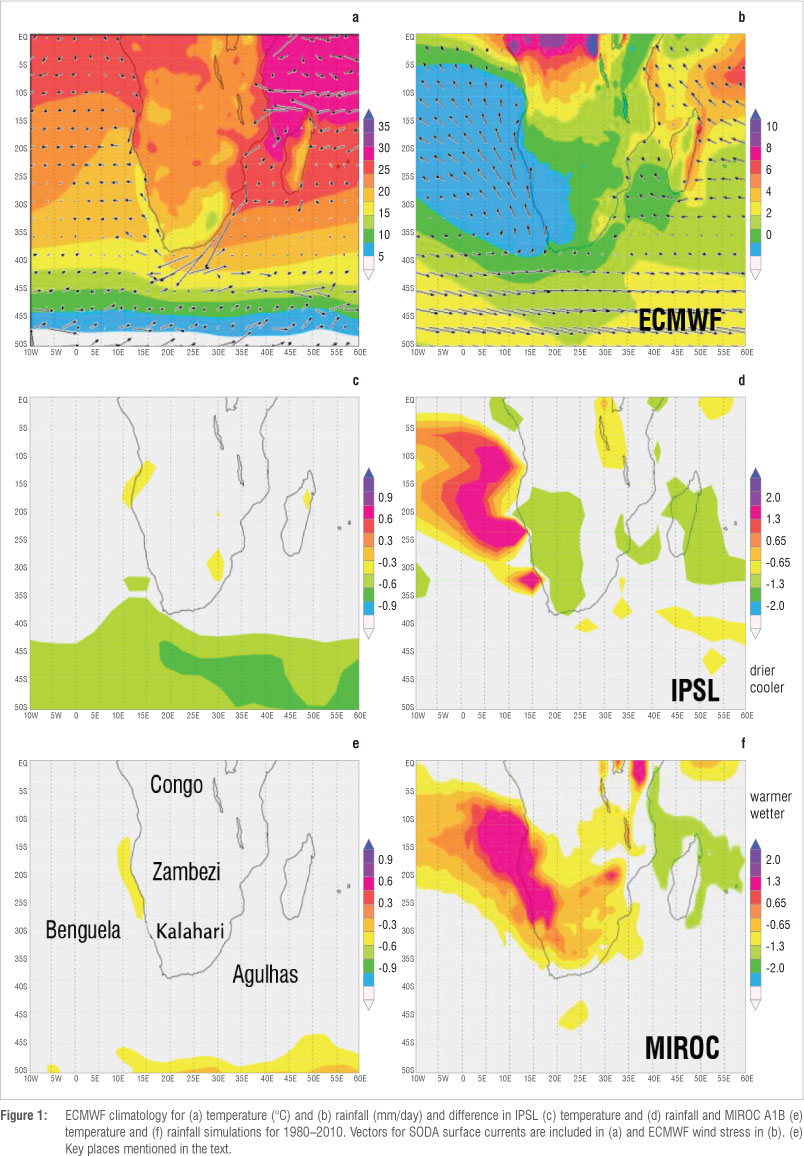
The 30-year climatology for surface air temperature and rainfall provided by the ECMWF (interim) reanalysis is in Figure 1. This reanalysis was used as a reference and to compare with model simulations as a result of its consistent data assimilation and incorporation of both observations and remotely sensed information. The tropical-temperate gradient, effects of cool (west) and warm (east) ocean currents and highlands was evident in the temperature field. The IPSL simulation had a cool bias (-0.4 °C) across the ocean south of Africa, indicative of weak penetration by the Agulhas Current. Over terrestrial southern Africa there was no temperature bias in either simulation. The MIROC climatology had a slight warm bias in the northern Benguela and across the ocean southeast of Africa (+0.4°C). The ECMWF rainfall climatology exhibited a dry zone across the Benguela and Kalahari (15-35°S, 10°W-25°E). Heavier tropical rainfall was located over the Congo Basin and in the west Indian Ocean. Both IPSL and MIROC simulations exhibited a wet bias over the northern Benguela, which, for MIROC, extended inland across the Kalahari, whereas the IPSL rainfall simulation had a weak dry bias (-0.6 mm/day) over the Kalahari with respect to ECMWF. Both models adequately reflected the pattern of air temperature over southern African, despite differences in resolution and parameterisation schemes.
Pattern of trends Temperature
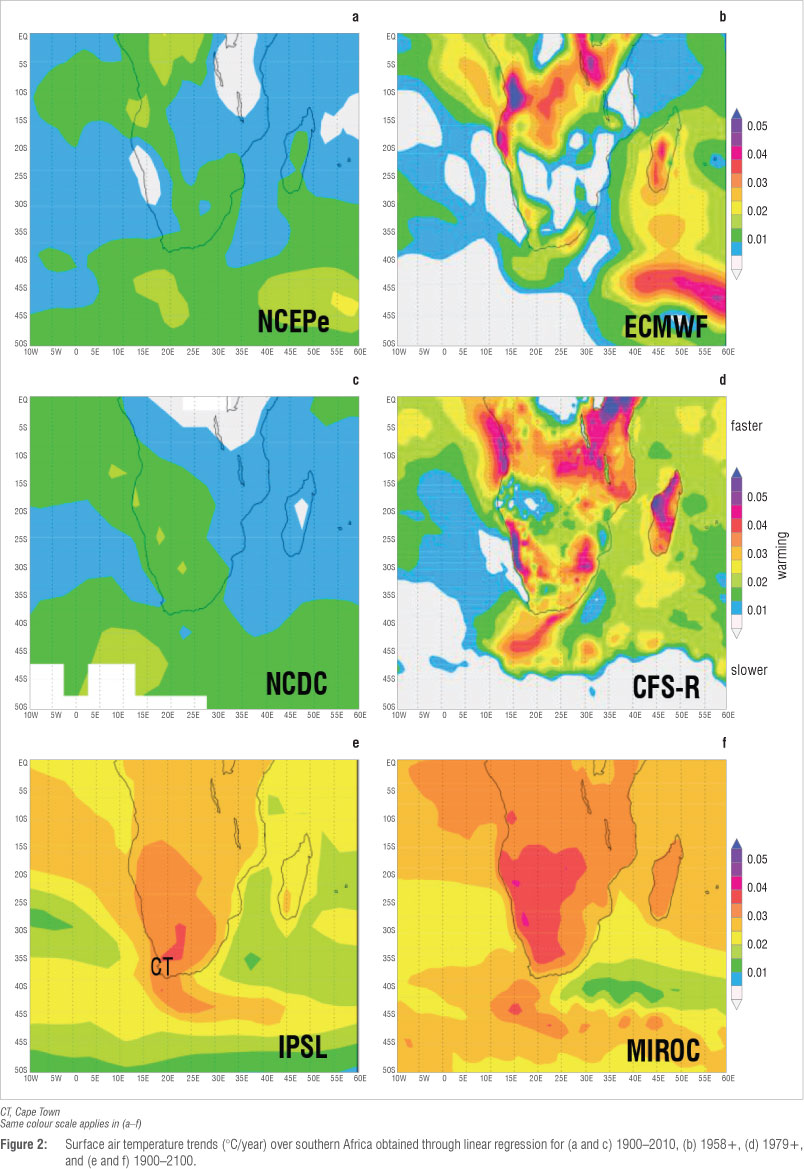
Surface air temperature trends were positive among the data sets (Figure 2) and larger in recent periods. The NCEPe and NCDC warming trends were +0.01 °C/year over the 20th century (similar to HADCRU) and tended to be greatest over the lowlands and marine environment. Both ECMWF and CFS-R data sets exhibited faster warming in the sub-tropical Indian Ocean, southern Congo and coastal plains (+0.03 °C/year) in the second half of the 20th century, and weaker trends in the South Atlantic mid-latitudes. The IPSL and MIROC model A1B simulations in the period 1900-2100 exhibited faster warming over the southern plateau and Kalahari, with an extension south of Cape Town. The shortest data set (CFS-R) indicated rapid warming in the Agulhas outflow region, likely caused by changes in regional currents29,52 and upstream warming in the West Indian Ocean.31 Unlike the model simulations, none of the observed temperature trends were greatest over the interior highlands and plateau.
Rainfall
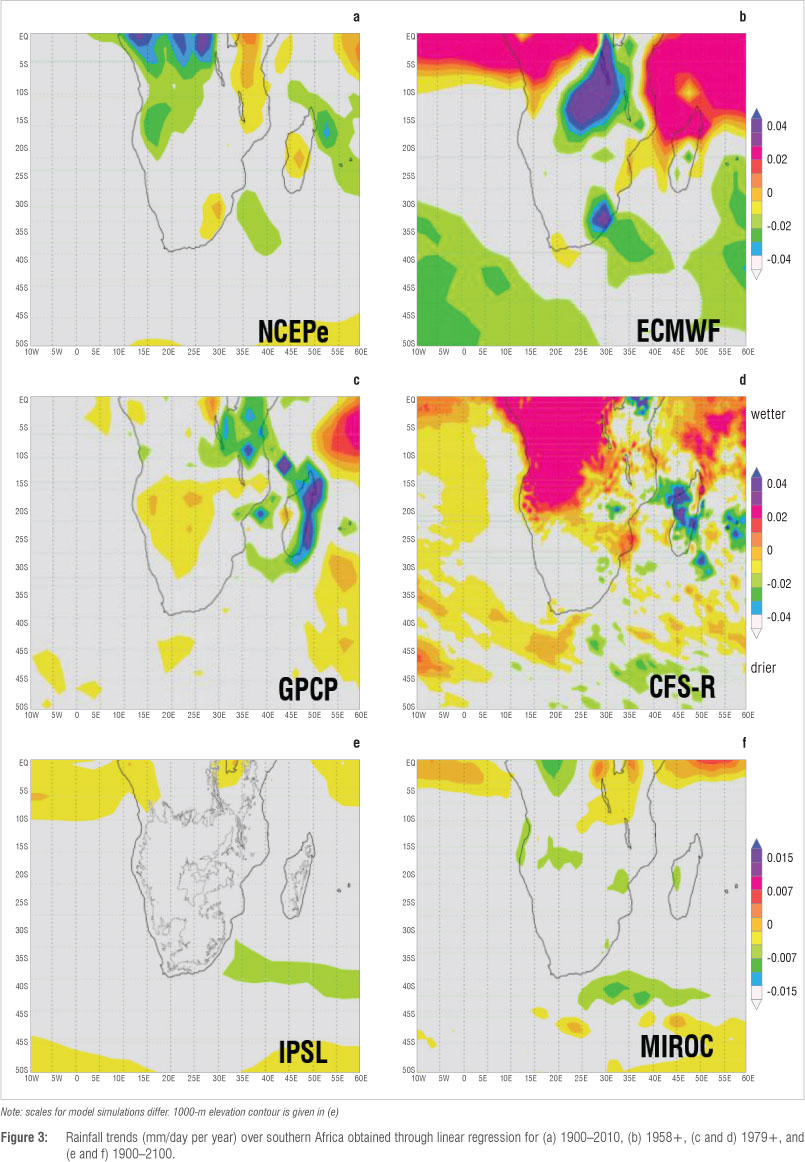
Rainfall trends were mixed (Figure 3) and generally negative across marine latitudes (35-40°S) south of Africa, particularly in the ECMWF, GPCP and model data sets. The NCEPe and GPCP trends were downward over the Congo, while ECMWF and CFS-R trends were upward over the Congo. All data sets exhibited upward trends in the equatorial West Indian Ocean, while NCEPe and the model simulations indicated rising rainfall in the mid-latitudes. The ECMWF and CFS-R rain trends were upward over the tropical Atlantic Ocean, a feature also found in IPSL and MIROC A1B simulations. There was a declining trend over Madagascar in the GPCP data set that is supported by the CFS-R data, while ECMWF showed a declining rainfall trend in eastern South Africa. Except for the wet (north) and dry (south) trend pattern, there was limited consensus among the various data sets with regard to rainfall.
Air pressure
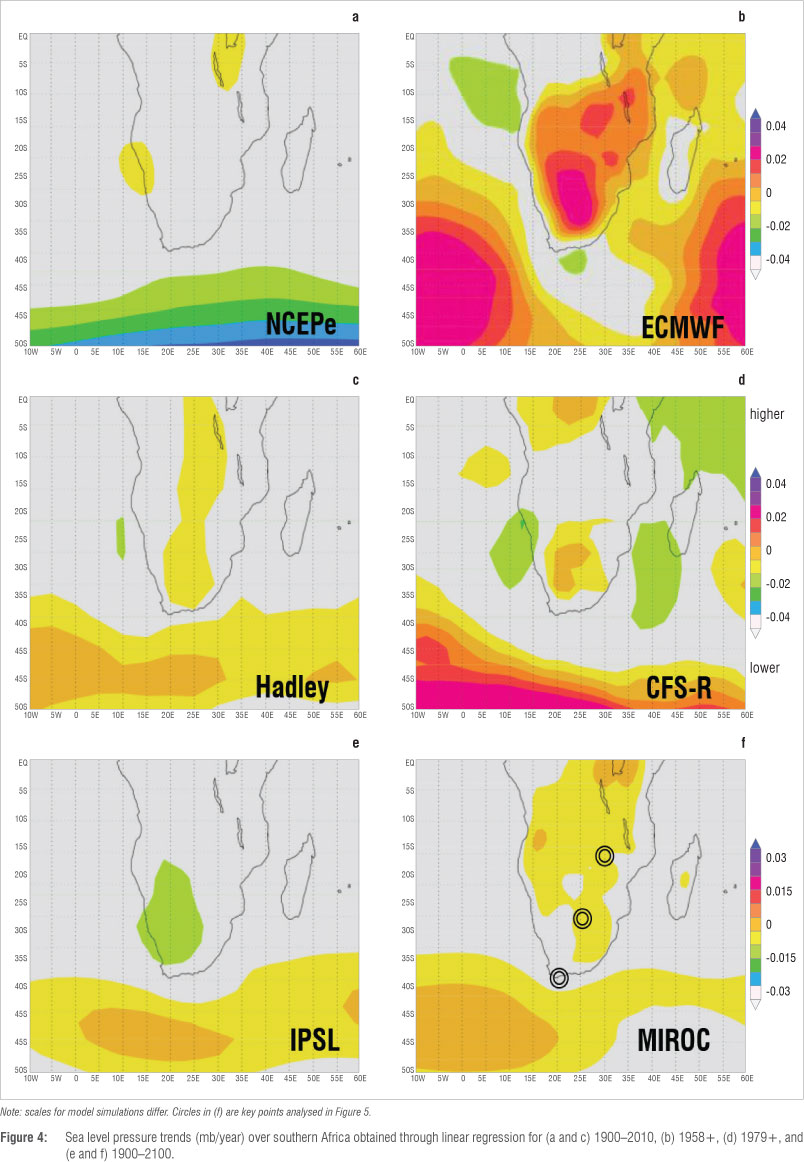
Trends of SLP in Figure 4 showed rising pressure over southern Africa, particularly in the ECMWF data set and to some extent in others, but not in the IPSL data. Over the adjacent sub-tropics where the marine anticyclones reside, all data sets (except NCEPe) indicated rising pressure. The CFS-R and MIROC data sets suggested an intensification of the South Atlantic anticyclone, while the Hadley observations and IPSL simulation indicated equal strengthening of the South Indian anticyclone. The IPSL SLP trend reflected a trough over southern Africa. Although the signals were somewhat mixed, there was agreement in that the subtropical anticyclones are migrating poleward.
Temporal trends Key areas
Southern African key area trends for temperature and rainfall anomalies are given in Figure 5 (cf. Figure. 4f) which intercompares observations, reanalysis and cGCM outputs. Model outputs were consistent with observations in terms of trend and variance, with the exception of ECMWF having a flatter trend and greater variance. Rainfall variance increased from south to north, but temperature variance was more uniform (Figure 5g and 5h). The IPSL surface air temperature trend exceeded that of MIROC (Figure 5c). Temperature trends for the period 1900-2100 were second order with a ~90% fit, leading to a +2 °C anomaly by the end of the 21st century. Rainfall trends were linear downward, with fit and trend decreasing from south to north. cGCM projections of rain deficits by the end of the 21st century were -0.3 mm/day (a decrease of 15% in total). Effects on the water budget could be compounded by rising evaporation.
Intercomparison
Table 1 shows an intercomparison of the trends for temperature and rainfall over the plateau of southern Africa (20-30°S, 20-30°E) in the various data sets over a common period, 1979-2010. This period is rather short for climate change analysis, but may facilitate understanding.
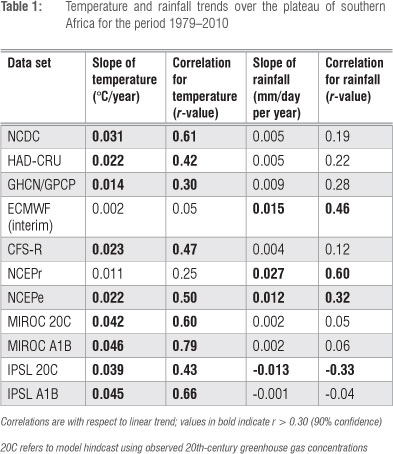
Although drought prevailed in the early 1980s, temperatures show upward trends of more than +0.4 °C/year in the MIROC and IPSL model simulations; between +0.02 °C/year and +0.03 °C/year in the NCDC, HADCRU, CFS-R and NCEPe data sets; +0.01 °C/year in the NCEPr and GHCN observations; and ECMWF data showed no change. Temperature increases were most significant (r > +0.6) in the model simulations and NCDC observations. Rainfall trends were minimal during that period, but significantly upward of +0.01 mm/day per year for NCEPr and ECMWF reanalysis, and downward for IPSL.
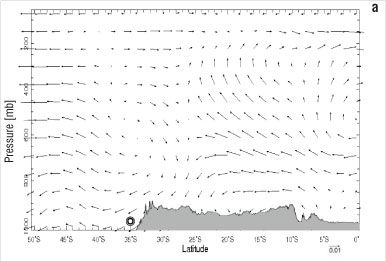
Atmospheric circulation
Many data sets exhibit a wetter tropics and drier sub-tropics pattern that suggests changes in the meridional override circulation, consistent with expansion of the Hadley cell.53 This pattern is shown in Figure 6a. There is a trend of poleward, rising motions over 0-20°S and divergent sinking motions over the coast (30-35°S) in the NCEPr data set, consistent with the rainfall dipole pattern seen in most data sets (cf. Figure 3). While surface zonal wind observations showed little trend over the 20th century (Figure 6b), the IPSL and MIROC projections suggest more easterly flow along the south coast consistent with the poleward migration of sub- tropical anticyclones and changes in the Southern Annular Mode54 that could shift the pelagic fishery.28
Sea surface height and currents
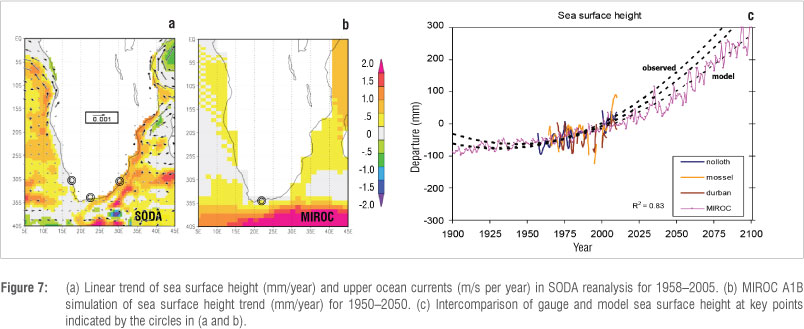
A critical impact of climate change is the rise of sea surface height. Sea surface height was studied using SODA reanalysis, coastal gauges and the MIROC A1B simulation (Figure 7). The rate of rise of sea surface height in SODA since 1958 is consistent with the global average of + 1.5 mm/year,55 and is faster along the east coast, probably as a result of warming of the Agulhas Current and associated shifts in the zonal wind belts.56 Upper ocean currents showed a distinct equatorward trend near Africa over 0-20°S, yet trends to the south were minimal. Beal57 found that waters inshore of the Agulhas Current derive from East Africa, hence this source is diminished. In the MIROC simulation, the rate of sea surface rise on the south coast accelerated with time, generating a second-order trend (0.017t2) with a 83% fit. There was also a growth in year-to-year variance that may be associated with increased 'storminess'. To the southeast of Africa, sea surface height rose faster in the 21st century, corresponding with a faster Agulhas Current. While model-simulated trends generally exceeded observed trends (cf. Figure 5c), for sea surface height the historical record for South Africa exceeded the A1B projection (Figure 7c). The linear trend averaged over four stations was +1.5 mm/year with a mean correlation fit of 0.68 over the period 1970-2008.
Discussion
The climate of southern Africa has undergone a significant warming which may accelerate from +0.01 °C/year to +0.02 °C/year.58 While the IPCC Assessment Report Four (AR4) consensus was for rapid warming over the Kalahari plateau, here the results suggest warming will be faster over the coastal plains. Table 1 shows an intercomparison of trends over southern Africa in the satellite era. Temperatures exhibited upward trends of more than +0.4 °C/year in the MIROC and IPSL A1B model simulations; between +0.02 °C/year and +0.03 °C/year in NCDC, HADCRU, CFS-R and NCEPe data sets; +0.01 °C/year in NCEPr and GHCN observations; and near zero in the ECMWF data set. Temperature increases were most significant (r > + 0.6) in the model simulations and NCDC observations.
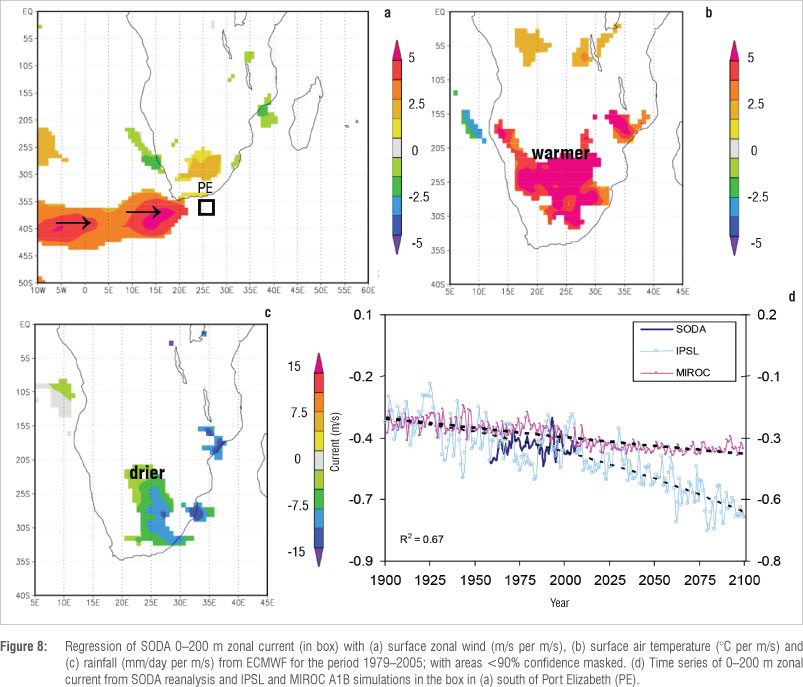
The SLP analysis exhibited a poleward shift of the sub-tropical anticyclones (cf. Figure 4) which will affect ocean-atmosphere coupling. This aspect was considered by regression with zonal currents south of Port Elizabeth (Figure 8a-8c), wherein spells of slower Agulhas Current coincide with westerly winds in the 35-45°S band and warmer drier conditions over the adjacent land. While the SODA currents show little trend in the 20th century (Figure 8d), both IPSL and MIROC models predict an acceleration of the Agulhas Current in the 21st century (U<-0.5 m/s) - a factor which could mitigate some of the regional impacts of climate change. CMIP3 model performance is known to be scale dependent,59 and further work with CMIP5 models would be useful.
Considering model simulated and projected rainfall over southern Africa (Figure 5 and Table 1), there was a total decline of -0.6 mm/day and even larger interannual variations. Although rainfall trends were minimal in many data sets during the satellite era because of a drought in the early 1980s, there was a significant downtrend in the IPSL simulation of 0.013 mm/day per year. There will be additional stress on water resources, so adaptation and conservation strategies are needed, such as shifting agriculture to higher ground and improving water use and recycling, as has been suggested in earlier research.60,61 A key finding reported here is that observed trends are consistently below model projections, except for coastal sea level which translates into impacts from beach recession.
Acknowledgements
Nicolas Fauchereau of the Council for Scientific and Industrial Research (South Africa) provided useful comments on the manuscript. Many data analyses were made in the Climate Explorer website (http://climexp.knmi.nl).
References
1. Christensen JH, Hewitson B, Busuioc A, Chen A, Gao X, Held I, et al. Regional climate projections. In: Solomon S, Qin D, Manning M, Chen Z, Marquis M, Averyt KB, et al., editors. Climate change: The physical science basis. Contribution WG1 to Fourth Assessment Report of the Intergovernmental Panel on Climate Change. New York: Cambridge University Press; 2007. p. 611-627. [ Links ]
2. Conway D, Mould C, Bewket W. Over one century of rainfall and temperature observations in Addis Ababa, Ethiopia. Intl J Climatol. 2004;24:77-91. http://dx.doi.org/10.1002/joc.989 [ Links ]
3. Kruger AC, Shongwe S. Temperature trends in South Africa: 1960-2003. Intl J Climatol. 2004;24:1929-1945. http://dx.doi.org/10.1002/joc.1096 [ Links ]
4. Malhi Y Wright J. Spatial patterns and recent trends in the climate of tropical rainforest regions. Phil Trans Roy Soc B. 2004;359:311-329. http://dx.doi.org/10.1098/rstb.2003.1433 [ Links ]
5. New M, Hewitson B, Stephenson DB, Tsiga A, Kruger A, Manhique A, et al. Evidence of trends in daily climate extremes over southern and west Africa. J Geophys Res Atmos. 2006;111:D14102. http://dx.doi.org/10.1029/2005JD006289 [ Links ]
6. Kinguyu SM, Ogallo LA, Anyamba EK. Recent trends of minimum and maximum surface temperatures over Eastern Africa. J Climate. 2000;13:2876-2886. http://dx.doi.org/10.1175/1520-0442(2000)013<2876:RTOMAM>2.0.CO;2 [ Links ]
7. Hulme M, Doherty RM, Ngara T, New M. Global warming and African climate change. In: Low PS, editor. Climate change and Africa. Cambridge: Cambridge University Press; 2005. p. 29-40. http://dx.doi.org/10.1017/CBO9780511535864.013 [ Links ]
8. Chappell A, Agnew CT. Modelling climate change in West African Sahel rainfall (1931-90) as an artifact of changing station locations. Intl J Climatol. 2004;24:547-554. http://dx.doi.org/10.1002/joc.1021 [ Links ]
9. Richard Y, Fauchereau N, Poccard I, Rouault M, Trzaska S. 20th century droughts in southern Africa: Spatial and temporal variability, teleconnections with oceanic and atmospheric conditions. Intl J Climatol. 2001;21:873-895. http://dx.doi.org/10.1002/joc.656 [ Links ]
10. Usman MT, Reason CJC. Dry spell frequencies and their variability over southern Africa. Clim Res. 2004;26:199-211. http://dx.doi.org/10.3354/cr026199 [ Links ]
11. Tadross M, Jack C, Hewitson B. On RCM-based projections of change in southern African summer climate. Geophys Res Lett. 2005;32:L23713. http://dx.doi.org/10.1029/2005GL024460 [ Links ]
12. Nicholson SE, Selato JC. The influence of La Nina on African rainfall. Intl J Climatol. 2000;20:1761-1776. http://dx.doi.org/10.1002/1097-0088(20001130)20:14<1761::AID-JOC580>3.0.CO;2-W [ Links ]
13. Fauchereau N, Trzaska S, Richard Y Roucou P Camberlin P. Sea surface temperature co-variability in the southern Atlantic and Indian Oceans and its connections with the atmospheric circulation in the southern hemisphere. Intl J Climatol. 2003;23:663-677. http://dx.doi.org/10.1002/joc.905 [ Links ]
14. Jury MR, Huang B. The Rossby wave as a key mechanism of Indian Ocean climate variability. Deep Sea Res. 2004;51:2123-2136. http://dx.doi.org/10.1016/j.dsr.2004.06.005 [ Links ]
15. Bounoua L, Collatz GJ, Los SO, Sellers PJ, Dazlich DA, Tucker CJ, et al. Sensitivity of climate to changes in NDVI. J Climate. 2000;13:2277-2292. http://dx.doi.org/10.1175/1520-0442(2000)013<2277:SOCTCI>2.0.CO;2 [ Links ]
16. Wang G, Eltahir EAB. Impact of CO2 concentration changes on the biosphere-atmosphere system of West Africa. Glob Change Biol. 2002;8:1169-1182. http://dx.doi.org/10.1046/j.1365-2486.2002.00542.x [ Links ]
17. Nicholson SE. Climatic and environmental change in Africa during the last two centuries. Clim Res. 2001;17:123-144. http://dx.doi.org/10.3354/cr017123 [ Links ]
18. Semazzi FHM, Song Y A GCM study of climate change induced by deforestation in Africa. Clim Res. 2001;17:169-182. http://dx.doi.org/10.3354/cr017169 [ Links ]
19. Held IM, Delworth TL, Lu J, Findell KL, Knuston TR. Simulation of Sahel drought in the 20th and 21st centuries. Proc Natl Acad Sci USA. 2005;102:17891-17896. http://dx.doi.org/10.1073/pnas.0509057102 [ Links ]
20. Olsson L, Eklundh L, Ardo J. A recent greening of the Sahel: Trend, patterns and potential causes. J Arid Environ. 2005;63:556-566. http://dx.doi.org/10.1016/j.jaridenv.2005.03.008 [ Links ]
21. Washington RM, Kay G, Harrison M, Conway D, Black E, Challinor A, et al. African climate change: Taking the shorter route. Bull Am Meteorol Soc. 2006;87:1355-1366. http://dx.doi.org/10.1175/BAMS-87-10-1355 [ Links ]
22. Trenberth KE, Jones PD, Ambenje P Bojariu R, Easterling D, Klein Tank A, et al. Observations: Surface and atmospheric climate change. In: Solomon S, Qin D, Manning M, Chen Z, Marquis M, Averyt KB, et al., editors. Climate change: The physical science basis. Contribution WG1 to Fourth Assessment Report of the Intergovernmental Panel on Climate Change. Cambridge: Cambridge University Press; 2007. p. 235-336. [ Links ]
23. Mirza MMQ. Climate change and extreme weather events: Can developing countries adapt? Clim Policy. 2003;3:233-248. [ Links ]
24. Tarhule A, Lamb PJ. Climate research and seasonal forecasting for West Africans: Perceptions, dissemination, and use? Bull Am Meteorol Soc. 2003;84:1741-1759. http://dx.doi.org/10.1175/BAMS-84-12-1741 [ Links ]
25. Few R, Ahern M, Matthies F, Kovats S. Floods, health and climate change: A strategic review. Norwich: Tyndall Centre for Climate Change Research, University of East Anglia; 2004. [ Links ]
26. Obasi GOP. The impacts of ENSO in Africa. In: Low PS, editor. Climate change and Africa. Cambridge: Cambridge University Press; 2005. p. 218-230. http://dx.doi.org/10.1017/CBO9780511535864.030 [ Links ]
27. Manatsa D, Unganai L, Gadzirai D, Behera SK. An innovative tailored seasonal rainfall forecasting production in Zimbabwe. Nat Hazards. 2012;64(2):1187-1207. http://dx.doi.org/10.1007/s11069-012-0286-2 [ Links ]
28. Hutchings L, Augustyn CJ, Cockcroft A, Van der Lingen C, Coetzee J, Leslie RW, et al. Marine fisheries monitoring programmes in South Africa. S Afr J Sci. 2009;105(5/6):182-192. [ Links ]
29. Rouault M, Pohl B, Penven P. Coastal oceanic climate change and variability from 1982 to 2009 around South Africa. Afr J Mar Sci. 2010:32,237-246. http://dx.doi.org/10.2989/1814232X.2010.501563 [ Links ]
30. Hulme, M, Doherty RM, Ngara T, New MG, Lister D. African climate change: 1900-2100. Clim Res. 2001;17:145-168. http://dx.doi.org/10.3354/cr017145 [ Links ]
31. Hoerling MP Hurrell JW, Xu T, Bates GT, Phillips AS. Twentieth century North Atlantic climate change. Part II: Understanding the effect of Indian Ocean warming. Clim Dyn. 2004;23:391-105. http://dx.doi.org/10.1007/s00382-004-0433-x [ Links ]
32. Giorgi F, Francisco R. On the predictability of regional climate change. Clim Dyn. 2000;16:169-182. http://dx.doi.org/10.1007/PL00013733 [ Links ]
33. Xue Y. Biosphere feedback on regional climate in tropical North Africa. Q J R Meteorol Soc. 1997;123:1483-1515. http://dx.doi.org/10.1002/qj.49712354203 [ Links ]
34. Meehl GA, Covey C, Delworth T, Latif M, McAvaney B, Mitchell JFB, et al. The WCRP CMIP3 multimodel data set: A new era in climate change research. Bull Am Meteor Soc. 2007;88:1383-1394. http://dx.doi.org/10.1175/BAMS-88-9-1383 [ Links ]
35. Solomon S, Qin D, Manning M, Chen Z, Marquis M, Averyt KB, et al. Regional climate projections. In: Solomon S, Qin D, Manning M, Chen Z, Marquis M, Averyt KB, et al., editors. Climate change: The physical science basis. Fourth Assessment Report of the Intergovernmental Panel on Climate Change. Cambridge: Cambridge University Press; 2007. p. 501-587. [ Links ]
36. Rudolf B, Schneider U. Calculation of gridded precipitation data for the global land-surface using in-situ gauge observations. Proc Intl Precip Working Group. Monterey: EUMETSAT; 2005. p. 517-524. [ Links ]
37. Adler RF, Huffman GJ, Chang A, Ferraro R, Xie P-P Janowiak J, et al. The Version 2 Global Precipitation Climatology Project (GPCP) monthly precipitation analysis (1979-present). J Hydrometeor. 2003;4:1147-1167. http://dx.doi.org/10.1175/1525-7541(2003)004<1147:TVGPCP>2.0. CO;2 [ Links ]
38. Smith TM, Reynolds RW, Peterson TC, Lawrimore J. Improvements to NOAA's historical merged land-ocean surface temperature analysis (1880-2006). J Climate. 2008;21:2283-2296. http://dx.doi.org/10.1175/2007JCLI2100.1 [ Links ]
39. Compo GP, Whitaker JS, Sardeshmukh PD, Matsui N, Allan RJ, Yin X, et al. The twentieth century reanalysis project. Q J R Meteorol Soc. 2011;137:1-28. http://dx.doi.org/10.1002/qj.776 [ Links ]
40. Kalnay E, Kanamitsu M, Kistler R, Collins W, Deaven D, Gandin L, et al. The NCEP/NCAR 40-year reanalysis project. Bull Am Meteor Soc. 1996;77:437-470. http://dx.doi.org/10.1175/1520-0477(1996)077<0437:TNYRP>2.0.CO;2 [ Links ]
41. Uppala SM, KÁllberg PW, Simmons AJ, Andrae U, Da Costa Bechtold V Fiorino M, et al. The ERA-40 reanalysis. Q J R Meteorol Soc. 2005;131:2961-3012. http://dx.doi.org/10.1256/qj.04.176 [ Links ]
42. Dee DP, Uppala SM, Simmons AJ, Berrisford P, Poli P, Kobayashi S, et al. The ERA-interim reanalysis: Configuration and performance of the data assimilation system. Q J R Meteorol Soc. 2011;137:553-597. http://dx.doi.org/10.1002/qj.828 [ Links ]
43. Carton JA, Giese BS. A reanalysis of ocean climate using simple ocean data assimilation (SODA). Mon Wea Rev. 2008;136:2999-3017. http://dx.doi.org/10.1175/2007MWR1978.1 [ Links ]
44. Saha S, Moorthi S, Pan H-L, Wu X, Wang J, Nadiga S, et al. The NCEP climate forecast system reanalysis. Bull Am Meteor Soc. 2010;91:1015-1057. [ Links ]
45. Hourdin FI, Musat I, Bony S, Braconnot P, Codron F, Dufresne J-L, et al. The LMDZ4 general circulation model: Climate performance and sensitivity to parameterized physics with emphasis on tropical convection. Clim Dyn. 2006;27(7-8):787-813. http://dx.doi.org/10.1007/s00382-006-0158-0 [ Links ]
46. Krinner G, Viovy N, De Noblet-Ducoudré N, Ogée J, Polcher J, Friedlingstein P, et al. A dynamic global vegetation model for studies of the atmosphere-biosphere system. Glob Biog Cycles. 2005;19:GB1015. http://dx.doi.org/10.1029/2003GB002199 [ Links ]
47. Hasumi H, Emori S. MIROC model development. Tokyo: Frontier Research Center for Global Change; 2004. [ Links ]
48. Carter TR, La Rovere EL, Jones RN, Leemans R, Mearns LO, Nakicenovic N, et al. Developing and applying scenarios. In: Solomon S, Qin D, Manning M, Chen Z, Marquis M, Averyt KB, et al., editors. Climate change: Impacts, adaptation, and vulnerability. WG2 contribution to AR3 of the Intergovernmental Panel on Climate Change. Cambridge: Cambridge University Press; 2001. p. 145-190. [ Links ]
49. Nakicenovic N, Swart R, editors. Special report on emissions scenarios: A special report of WG3 of the Intergovernmental Panel on Climate Change. Cambridge: Cambridge University Press; 2001. [ Links ]
50. Bromwich DH, Nicolas JP Monaghan AJ. An assessment of precipitation changes over Antarctica and the Southern Ocean since 1989 in contemporary global reanalyses. J Climate. 2011;24:4189-4209. http://dx.doi.org/10.1175/2011JCLI4074.1 [ Links ]
51. Poccard I, Janicot S, Camberlin P Comparison of rainfall structures between NCEP/NCAR reanalyses and observed data over tropical Africa. Clim Dyn. 2000;16:897-915. http://dx.doi.org/10.1007/s003820000087 [ Links ]
52. Broecker WS. The great ocean conveyor. Oceanography. 1991;4:79-89. http://dx.doi.org/10.5670/oceanog.1991.07 [ Links ]
53. Hu Y Fu Q. Observed poleward expansion of the Hadley circulation since 1979. Atmos Chem Phys. 2007;7:5229-5236. http://dx.doi.org/10.5194/acp-7-5229-2007 [ Links ]
54. Gillett NP Kell TD, Jones PD. Regional climate impacts of the southern annular mode. Geophys Res Lett. 2006;33:L23704. http://dx.doi.org/10.1029/2006GL027721 [ Links ]
55. Raper SCB, Warrick RI, Wigley TML. Global sea level rise: Past and future. In: Milliman JD, Haq BU, editors. Sea level rise and coastal subsidence: Causes, consequences and strategies. Amsterdam: Kluwer Academic Publishers; 1996. p. 11-45. http://dx.doi.org/10.1007/978-94-015-8719-8_2 [ Links ]
56. Dijkstra HA, De Ruijter WPM. On the physics of the Agulhas Current: Steady retroflection regimes. J Phys Oceanogr. 2001;31:2971-2985. http://dx.doi.org/10.1175/1520-0485(2001)031 <2971:OTPOTA>2.0.CO;2 [ Links ]
57. Beal LM, Chereskin TK, Lenn YD, Elipot S. The sources and mixing characteristics of the Agulhas Current. J Phys Oceanogr. 2006;36:2060-2074. http://dx.doi.org/10.1175/JPO2964.1 [ Links ]
58. Morishima W, Akasaka I. Seasonal trends of rainfall and surface temperature over southern Africa. African Study Monographs. 2010;40:67-76. [ Links ]
59. Masson D, Knutti R. Spatial-scale dependence of climate model performance in the CMIP3 ensemble. J Climate. 2011;24:2680-2692. http://dx.doi.org/10.1175/2011JCLI3513.1 [ Links ]
60. Dixon RK, Guill S, Mkanda FX, Hlohowskyj I. Vulnerability and adaptation of African ecosystems to global climate change. Clim Res. 1996;6:1-201. [ Links ]
61. Downing TE, Ringius L, Hulme M, Waughray D. Adapting to climate change in Africa. Mitig Adapt Strat Glob Change. 1997;2:19-44. http://dx.doi.org/10.1007/BF02437055 [ Links ]
 Correspondence to:
Mark Jury
Physics Department
University of Puerto Rico Mayaguez
PO Box 9000, Mayaguez PR 006819000, Puerto Rico
Email: mark.jury@upr.edu
Received: 28 Oct. 2011
Revised: 18 May 2012
Accepted: 22 Aug. 2012

