


Services on Demand
Article
 English (pdf)
 Article in xml format
 Article references
Indicators

Related links
-
 Cited by Google
 -
 Similars in Google
Share

 Permalink
South African Journal of Science
On-line version ISSN 1996-7489
Print version ISSN 0038-2353
S. Afr. j. sci. vol.108 n.9-10 Pretoria Jan. 2012
RESEARCH ARTICLE
An air quality assessment in the industrialised western Bushveld Igneous Complex, South Africa
Andrew D. VenterI; Ville VakkariII; Johan P. BeukesI; Pieter G. van ZylI; Heikki LaaksoII; Desmond MabasoIII; Petri TiittaI, IV; Miroslav JosipovicI; Markku KulmalaII; Jacobus J. PienaarI; Lauri LaaksoI, II, V
ISchool of Physical and Chemical Sciences, North-West University, Potchefstroom, South Africa
IIDepartment of Physics, University of Helsinki, Helsinki, Finland
IIIRustenburg Local Municipality, Rustenburg, South Africa
IVDepartment of Applied Physics, University of Eastern Finland, Kuopio, Finland
VFinnish Meteorological Institute, Helsinki, Finland
ABSTRACT
South Africa has the largest industrialised economy in Africa, with significant mining and metallurgical activities. A large fraction of the South African mineral assets is concentrated in the Bushveld Igneous Complex (BIC), with the western limb being the most exploited. Because the majority of the world's platinum is produced in the BIC, this area is also of international interest. There are some indications that the western BIC should be considered an air pollution hotspot; however, inadequate data exist to substantiate these claims scientifically. To partially address this knowledge gap, a comprehensive air quality monitoring station was operated for more than 2 years in this area. Meteorological parameters, trace gas concentrations and total mass concentration of particulate matter up to 10 μm in size (PM10) were measured. Compared with South African and European ambient air quality standards, SO2, NO2 and CO concentrations were generally acceptable. The major sources of SO2 were identified as high-stack industry emissions, while household combustion from semi-formal and informal settlements was identified as the predominant source of NO2 and CO. In contrast, O3 exceeded the 8-h moving average more than 322 times per year. The main contributing factor was identified to be the influx of regional air masses, with high O3 precursor concentrations. PM10 exceeded the current South African 24-h standard 6.6 times per year, the future (2015) standard 42.3 times per year and the European standard more than 120 times per year. The main source of PM10 was identified as household combustion from semi-formal and informal settlements. The findings clearly indicate that atmospheric O3 and PM10 levels in the western BIC need to be addressed to avoid negative environmental and human health impacts.
Introduction
The direct and indirect adverse effects caused by atmospheric pollution on the environment and human health necessitate the measurement and reporting of air quality on local, regional and global scales. The measurement and improvement of air quality in developed countries are considered a priority. In developing countries less emphasis is placed on environmental issues, because resources are mostly utilised for economic growth. South Africa is regarded as a developing country with elements of a developed country. Globally, southern Africa is a significant source region of atmospheric pollutants, for example a prominent NO2 hotspot is seen on global maps of NO2 satellite retrievals over the South African Highveld; based on 1990 statistics South Africa was the ninth highest atmospheric sulphur emitting country and biomass burning emissions from this region are known to have a global effect.1,2,3 In the last decade, South African ambient air quality standards were revised4 and are now similar to ambient air quality standards in developed countries. In addition, South African legislation makes provision for the identification and declaration of national air pollution priority areas. In these areas, South African ambient air quality standards are frequently exceeded, hence improvement is required. Two priority areas have thus far been declared: the Vaal Triangle Airshed Priority Area and the Highveld Priority Area.5,6 Major atmospheric pollutant point sources in these areas are petrochemical and metallurgic industries, as well as coal-fired power stations.
South Africa has the largest industrialised economy in Africa, with significant mining and metallurgical activities. A large fraction of the South African mineral assets is concentrated in the Bushveld Igneous Complex (BIC), which stretches across the North West, Gauteng, Mpumalanga and Limpopo Provinces (Figure 1). The BIC, which covers an area of 66 000 km2, holds more than 70% of the world's viable chrome resources, as well as large deposits of vanadium, cobalt, nickel, tin and copper. The BIC also produces 80% of the platinum group metals (PGMs) of the world.7,8,9 Globally, platinum plays an important role in atmospheric pollutant mitigation, as it is used mainly in catalytic converters of vehicular exhaust systems.
The BIC is geographically subdivided into five limbs, of which the western limb is the most exploited and industrially developed. A recent study has suggested that the western BIC should also be declared an air pollution priority area.10 However, because of a deficiency of past measurements in this area, very little baseline data exist. The abovementioned changes in South African ambient air quality legislation have forced local authorities to initiate measurements of ambient priority pollutants.
Problems associated with the development of these monitoring networks, capacity limitations and the lack of quality assurance procedures make it difficult to evaluate the quality of data. Most of these data sets are also not available in the public domain, nor has much been published in the peer-reviewed realm. Some data are available from air quality management plans that have been compiled by certain municipalities in the western BIC region.11 However, considering the global importance of this area (e.g. as a supplier of PGMs utilised in automotive catalytic converters and as the dominant chromium supplying region), there certainly is a need for more peer-reviewed studies published in the public domain on the air quality of the western BIC. In contrast, numerous studies have been conducted and published for the Vaal Triangle Airshed and Highveld Priority Areas.12,13,14 To at least partially address this knowledge gap, a comprehensive air quality monitoring station was operated for more than 2 years in the western BIC. Here, we present an air quality assessment of criteria pollutants.
Measurement location and methods
Site description
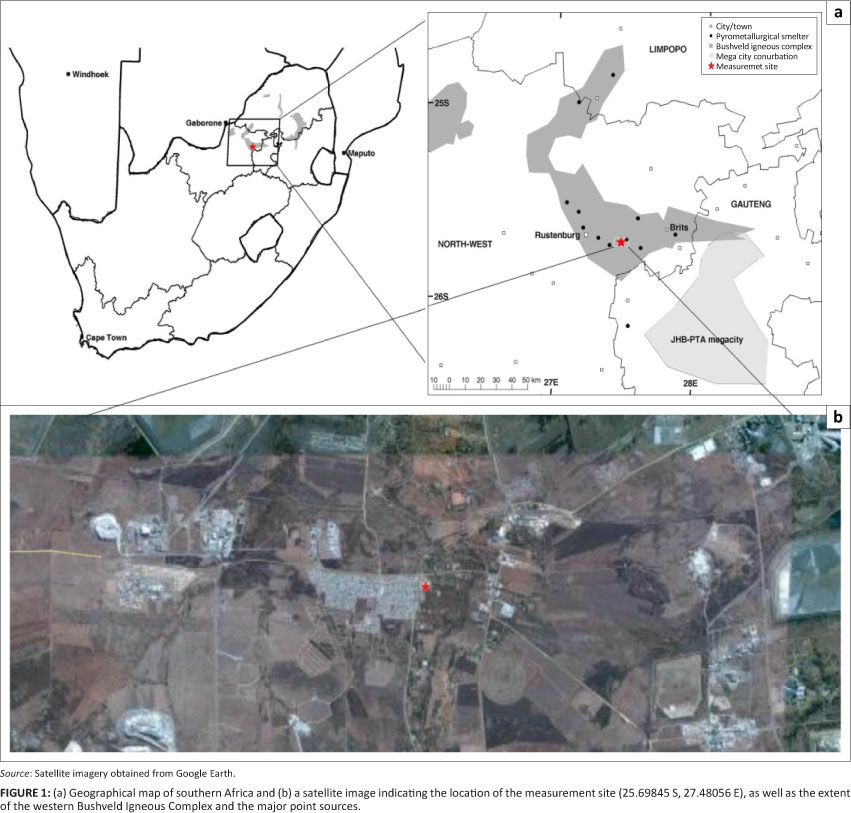
Measurements were conducted at Marikana (25.69845 S, 27.48056 E, 1170 m above mean sea level), which is a small village situated approximately 35 km east of Rustenburg, in the North West Province of South Africa. The site was situated in a residential area on the property of the Marikana Municipal clinic, which provided access to an electrical supply and also ensured the safekeeping of equipment. There were no mining and/or industrial activities within a 1 km radius of the site. The closest surroundings included semi-formal (government-built housing developments, mostly with some form of informal housing additions by the occupants) and informal (self-erected, sometimes unauthorised, mostly without municipal services) settlements, a formal residential area with a service station and shops, as well as tarred and untarred roads serving the communities in this area.
In Figure 1, the location of the sampling site is shown on a geographical map of South Africa, together with a satellite image obtained from Google Earth.
Geographically, Marikana is almost in the centre (east to west) of the southern section of the western BIC, south of the Pilanesberg crater. The western BIC is well known as a highly industrialised area with numerous mining and metallurgical operations. Some of the mining and metallurgical operations in this area include PGM mining and metallurgical operations, associated base metal refineries, chromite mining and ferrochrome smelting operations, as well as ferrovanadium and vanadium pentoxide production. The major point sources, that is, pyrometallurgical smelters, are indicated in Figure 1. The heights of the stacks emitting off-gases into the atmosphere at these industries vary depending on the specific industrial activity.11 Apart from these obvious large point sources, other potential sources of air pollutants from the mining and metallurgical industries include windblown dust from slimes or tailings dams, landfills, haul roads used by mining and large transport vehicles, and fugitive emissions.
Because of the lure of employment in the abovementioned sectors, the western BIC is frequented by residents of formal settlements (larger cities and towns, such as Rustenburg and Brits), as well as semi-formal and informal settlements. Incomplete combustion of coal and wood in ineffective appliances for household heating and cooking are common occurrences in the semi-formal and informal settlement sector. The Johannesburg-Pretoria megacity conurbation (with more than 10 million people) may also influence the area, because the central business districts of Pretoria and Johannesburg are approximately 74 km to the east and 80 km to the south-east, respectively (Figure 1).
Traffic volumes in the area are relatively high, as a consequence of the large amounts of raw materials being transported for mining and metallurgical operations by road. Because of an ineffective public transport system in South Africa, private vehicle use is also high. Various tarred and untarred roads cross the western BIC, and the N4 national highway between Pretoria and Rustenburg passes the measurement site approximately 5.9 km to the south (Figure 1).
In the areas not affected by industrial activities or human settlements, farming activities are still practised. Rainfall in the area is relatively low and it is regarded as a semi-arid region. Most of the farming activities are associated with grazing, cash crop production (e.g. maize) or game farming. Some citrus and vegetable cultivation also takes place, as the area is almost frost free during winter. Although the site is almost completely surrounded by anthropogenic activities, a less anthropogenically affected area occurs towards the south of the N4 highway.
Sampling methods
Measurements were conducted for the sampling period from 08 February 2008 to 17 May 2010 and were only interrupted when power failures occurred and instruments were serviced or calibrated.
The instruments were placed inside a Eurowagon 4500u measurement trailer (length 4.5 m, width 2.1 m, height 2.3 m, weight 2500 kg). More detailed descriptions of the measurement trailer, data analysis and calibration methods were given in other papers.15,16,17
Basic meteorological parameters were measured using a Rotronic MP 101A (Rotronic, New York, USA) for temperature and relative humidity data collection, while a Vector W200P and a Vector A101ML (Vector, Rhyl, UK) were used for wind speed and direction, respectively. A LiCor LI-190SB (Campbell Scientific, Logan, UT, USA) measured the photosynthetic photon flux density, from which global radiation was calculated and a Thies 5.4103.20.041 precipitation monitor (Adolf Thies GmbH & Co., Göttingen, Germany) recorded the precipitation. Trace gases were measured by a Thermo-Electron 43S SO2 analyser (Thermo Fisher Scientific Inc., Yokohama-shi, Japan), a Teledyne 200AU NOx analyser (Advanced Pollution Instrumentation Inc., San Diego, CA, USA), an Environment SA 41M O3 analyser (Environment SA, Poissy, France) and a Horiba APMA-360 CO analyser (Horiba, Kyoto, Japan). The synchronised hybrid ambient real-time particulate monitor (Model 5030, (Thermo Fisher Scientific Inc.) was used to determine the aerosol mass (PM10) from 12 February 2009 when it replaced the tapered element oscillating microbalance (Thermo Fisher Scientific Inc.) used earlier. A multi-angle absorption photometer (Model 5012, (Thermo Fisher Scientific Inc.) was installed on 25 September 2008 to determine the atmospheric black carbon (BC) loading.
The measurement station was visited once a week for maintenance, as well as for other ad-hoc procedures as required. All the instruments were connected to a master PC that was linked to a general packet radio service (GPRS) modem that sent measurement and diagnostic data to a server on a daily basis. The downloaded data were visually inspected a few times per week for quality assurance. If irregularities were found, additional site visits were arranged and corrective actions taken as required. An electronic diary, recording all site visits and actions taken, was also kept.
The measurement data from the site were visualised and corrected with a fit-for-purpose MATLAB18 program set. Based on diary entries, periods of uncertain data quality (e.g. during power failures or recovery periods after power failures and during calibrations or when maintenance was undertaken) were automatically eliminated. The data were then corrected based on calibrations (zero and span), as well as flow checks. Finally, the data were visualised and manually checked. The conversion of measured gaseous mixing ratio (in parts per billion by volume, ppbv) to μg/m3 was conducted at standard temperature and pressure (0 °C and 101.3 kPa). All particle concentrations were also converted to standard temperature and pressure conditions.
Overlay back trajectories
Individual hourly back trajectories with an arrival height of 100 m were calculated with HYSPLIT 4.820.19 The duration of each back trajectory was taken as 96 h. An arrival height of 100 m was chosen because the orography in HYSPLIT is not very well defined, therefore lower arrival heights could result in increased error margins on individual trajectory calculations. Considering the above, 24 hourly back trajectories for each day were obtained for the entire sampling period. Individual back trajectories generated in HYSPLIT (24 x 365 days) were superimposed and further analysed in MATLAB.14 In the overlay back trajectory graph compiled with MATLAB, a colour code indicates the percentage of trajectories passing over 0.2° x 0.2° grid cells, with red being the highest percentage.
Results
Meteorological characterisation
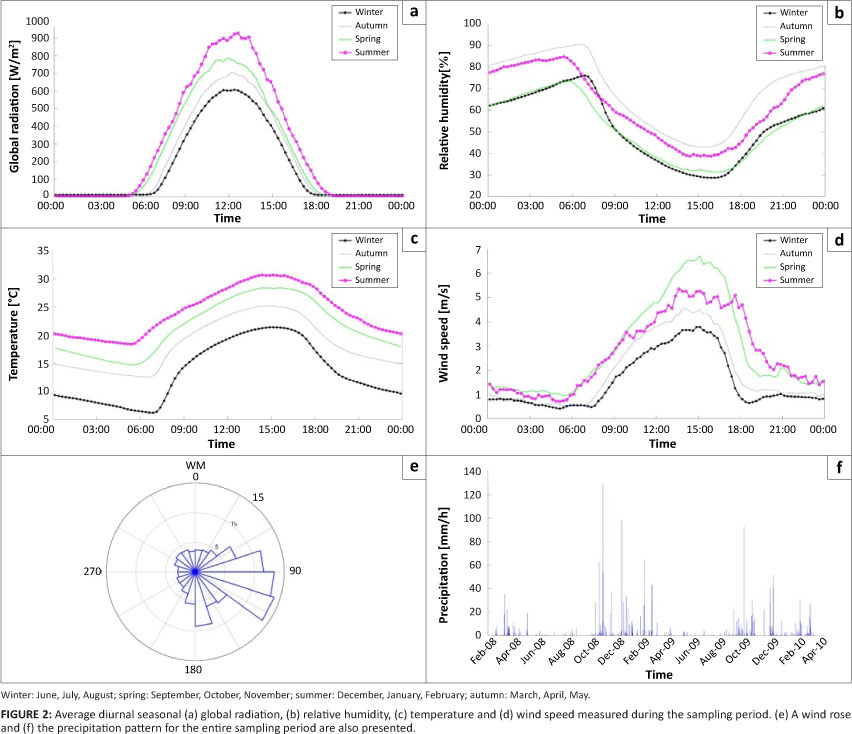
Average diurnal seasonal patterns for the major meteorological parameters - global radiation, relative humidity, temperature, wind speed, wind direction and precipitation - measured during the entire sampling period are presented in Figure 2. Additionally, the overlay back trajectory graph for trajectories arriving at the measurement site for the entire sampling period is presented in Figure 3. In Figure 3, the areas indicated in red have the highest frequency of air mass movement towards the measurement site, while the black lines are contour time lines that indicate the average trajectory position in each direction from the site at a given time. Meteorological parameters, as presented in Figure 2, indicate only the local meteorological influences on the measurements conducted. However, the possible regional influences of meteorological circulation patterns are better indicated by overlay back trajectories, as presented in Figure 3. The significance of both the locally measured meteorological parameters, as well as the regional circulation pattern, will be discussed within the context of the air quality assessment data presented in subsequent paragraphs.

Air quality assessment
In Table 1, the experimental data obtained during the sampling period are compared to current South African and European air quality standards. The South African legislation is the benchmark against which measurements should be compared, while European standards are referenced in order to contextualise the values internationally.
In subsequent paragraphs, each individual pollutant is discussed in terms of legislative implication, observed patterns (e.g. diurnal and seasonal) and possible sources. The exceedances presented in Table 1 are based on the averages for the total measurement period (i.e. 2 years, 3 months and 9 days) instead of the conventional reporting style in calendar years. This somewhat alternative presentation of the data facilitates the use of the complete data set.
SO2 assessment
SO2 had a mean 10-min average concentration of 3.8 ppbv (9.9 μg/m3) during the sampling period. A maximum 10-min concentration of 245.9 ppbv (639.9 μg/m3) was measured. The South African 10-min standard of 191 ppbv (500 μg/m3) was exceeded on average four times per year, which is much lower than the 526 tolerable exceedances. The measured 1-h average concentration for SO2 had a maximum level of 140.3 ppbv (366.4 μg/m3). This maximum was a once-off exceedance of the 1-h South African and European standards of 134 ppbv (350 μg/m3), which was well below the respective 200 and 55 tolerable exceedances allowed. The maximum 24-h average concentration of 20.8 ppbv (54.3 μg/m3) was below the South African and European 24-h standard of 48 ppbv (125 μg/m3). The average annual concentration was 3.8 ppbv (9.9 μg/m3), which is well below the limit of 19 ppbv (50 μg/m3) allowed by South African law.
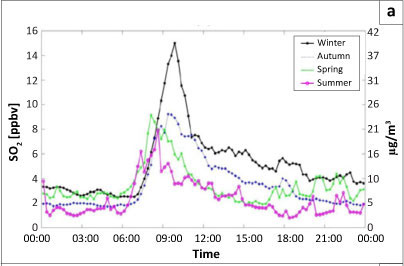
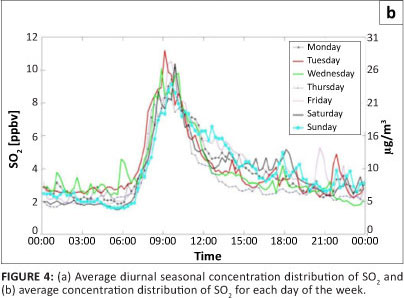
The average diurnal seasonal concentration patterns of SO2 are shown in Figure 4a. It is clear that SO2 concentrations peaked between 07:30 and 10:00, irrespective of the season, with concentrations during winter being the highest. The single, relatively late morning SO2 peak indicates that SO2 is not associated with the cooking and space-heating practices of the semi-formal and informal settlements in the area. If this was the case, two SO2 peaks would have been expected - one in the early morning (e.g. between 06:00 and 08:00) and one in the early evening (e.g. between 18:00 and 20:00). The single SO2 peak in the morning correlates with the break-up of the inversion layers that form quite regularly in the South African Highveld. Several well-developed inversion layers form at different heights, typically during the night and persist until late morning.1,20,21 It is known that the PGM industry in this area has relatively high SO2 emissions because it utilises sulphite ore8 which generates substantial SO2 emissions. High-stack SO2 emissions can accumulate between two inversion layers during the night; the SO2 is then released after the break-up of the inversion layers in the morning, resulting in an SO2 peak at ground level. The higher SO2 concentration peak observed during winter can be ascribed to the formation and persistence of the inversion layers being more pronounced in winter.1-20-21 Further proof that the single diurnal SO2 peak can be related to the trapping and release of pollution from high stacks is indicated by the timing of the peaks during the different seasons. The persistence of the inversion layers in winter is indicated by the winter SO2 peak occurring somewhat later compared to other seasons. In Figure 4b, the diurnal trend for SO2 is presented for each day of the week, as calculated for the entire sampling period. It is clear that the same SO2 trend is observed every day of the week. This pattern again confirms that SO2 originates mainly from metallurgical industrial sources, because these smelters are operated continuously. Higher SO2 concentrations in the winter can also, at least partially, be ascribed to additional SO2 from regional recirculation of pollutants, especially during the dry winter months.21 These additional, non-local sources also only manifest at ground level after the break-up of the low-level inversion layers in the morning.
In an effort to correlate the measurements with specific sources or source sectors in the western BIC, pollution roses were compiled for all the species measured (Figure 5). In addition to the pollution roses for the entire sampling period (black), pollution roses for the period between 12:00 and 16:00 (red) were compiled. During this time of day (12:00-16:00), the atmosphere is expected to be relatively well mixed, making it possible to correlate measured pollutant concentrations with wind direction. The 12:00-16:00 SO2 pollution rose (red) shows a dominance of sources from the west-north-west to the north-north-west, as well as the east-north-east to the south-east sectors. As indicated in Figure 1, the southern section of the western BIC (south of the Pilanesberg crater) and the associated placement of pyrometallurgical smelters have a greater spatial expanse from east to west than from north to south. Additionally, the smelters west of Marikana are placed mostly on a south-east to north-west line. The shape of the 12:00-16:00 SO2 pollution rose (red) mimics this south-east to north-west placement of the smelters, again confirming that SO2 originates primarily from the high-stack emissions.


NO2 assessment
A 1-h standard and an annual standard are prescribed for NO2 ambient concentrations according to South African and European legislations. No exceedances of NO2 standards were observed (Table 1). The mean 1-h average for the entire sampling period was 8.5 ppbv (15.9 μg/m3), with a maximum of 63.9 ppbv (120.9 μg/m3), which is below the 106 ppbv (200 μg/m3) standard. The maximum annual concentration was 9.4 ppbv (17.7 μg/m3), which was also below the 21 ppbv (40 μg/m3) legislated level.
The diurnal seasonal trends for NO2 are shown in Figure 6a. NO2 concentrations showed two distinctive peaks irrespective of the season. The first peak occurred between 06:00 and 10:00 and the second peak between 17:00 and 22:00. Possible sources of NO2 in this region include vehicular emissions, household combustion and pyrometallurgical smelters. The two diurnal NO2 peaks are characteristic of urban areas dominated by traffic emissions of NO2, with NO2 levels peaking in the early mornings and late afternoons during peak traffic hours.22 Traffic volumes are lower over weekends (Saturday and Sunday), which would be reflected by the on-site NO2 measurements, if traffic was the main source of NO2. However, an investigation of separate average daily NO2 diurnal cycles for each day of the week for the entire sampling period indicated that only Sundays had somewhat lower NO2 concentrations (Figure 6b). If traffic emissions were the main source of NO2 at the measurement site, these diurnal peaks would most likely be less pronounced on both Saturdays and Sundays. Additionally, the N4 highway is directly to the south of the site, which does not correlate with the dominant source regions indicated by the pollution rose measured from 12:00 to 16:00 for the entire sampling period (Figure 5b). Therefore, it seems unlikely that vehicular emissions are the predominant source of NO2 at this site.


The diurnal NO2 peaks (Figure 6a) are most likely associated with household combustion (cooking and space heating), which shows the same peak periods (morning and later afternoon into the evening) as traffic emissions. The more pronounced second diurnal NO2 peak in winter indicates that household combustion is most likely the principal source of NO2 at this site. During winter, there is an increase in space heating practices, especially during the night. The seasonal variation observed in the diurnal trend, that is, an increase from summer to winter, can be attributed to the increased use of space heating during colder periods, compounded by the formation of low-level inversion layers during the colder months, which trap low-level emissions. The lower diurnal NO2 cycle observed for Sundays (Figure 6b) can most likely be attributed to the fact that most people start their day later on Sundays, which results in reduced and delayed early morning space heating and cooking activities.
Other combustion processes in this area, such as pyrometallurgical smelters, may also have contributed to the observed NO2 levels. However, it is evident that high-stack emissions from industries are not the main source of NO2. If this was the case, NO2 would have peaked after the morning break-up of the low-level inversion layers, as was observed for SO2. Such a situation was observed by Collett et al.13, who reported that NO2 peaked after the break-up of the low-level inversion layers in the morning, as a result of the dominance of NO2 high-stack emissions from coal-fired power stations in the Highveld Priority Area.
O3 assessment
According to South African and European standards, O3 has only an 8-h moving average concentration standard of 61 ppbv (120 μg/m3). South African legislation allows 11 tolerable exceedances per year, while the European standards have no indication of tolerable exceedances. The highest 8-h moving average O3 concentration measured was 112 ppbv (224 μg/m3), while the mean 8-h moving average O3 concentration was 29.2 ppbv (58.2 μg/m3). During the sampling period, the 8-h moving standard was exceeded more than 322 times per year, which clearly signifies the magnitude of O3 pollution in this area.
The diurnal seasonal trends for O3 are presented in Figure 7a. As expected, O3 depicts a peak during the daytime, as O3 formation is dependent on solar radiation. In Figure 2a, the diurnal seasonal global radiation measured during the sampling period is shown. Solar radiation peaked at approximately 13:00, preceeding the O3 peak that occurred between 14:00 and 16:00.
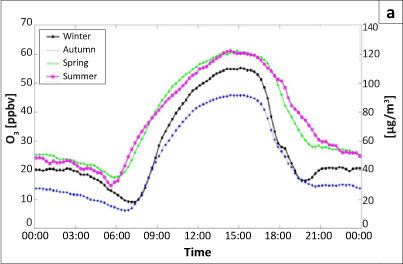

The diurnal seasonal patterns of O3 (Figure 7a) indicate that the highest O3 concentrations occurred during spring. This seasonal trend was also observed in recent measurements in the interior of South Africa.14,23,24 O3 is a secondary pollutant and the conversion of O3 precursors occurs during air transport from source regions. The hourly 96-h overlay back trajectories for Marikana (Figure 3) indicate that the Highveld Priority Area, with its high NO2 levels,13 is on the dominant anti-cyclonic regional recirculation path of Marikana. This finding partially explains the regular exceedances of O3 standards. Additionally, the higher O3 levels observed during spring can also be explained by regional CO patterns. Laakso et al.15 found CO at Botsalano (Figure 3), 175 km west-north-west from Marikana, also on the anti-cyclonic regional recirculation path of Marikana, peaked during spring.
Higher CO concentrations during spring are most likely associated with regional biomass burning events in southern Africa. From the meteorological parameters measured, it is clear that the temperatures in spring are almost as high as in summer (Figure 2c), while the humidity is almost as low as that in winter (Figure 2b). Spring is also the windiest period (Figure 2d), and high wind is conducive to biomass burning. As expected, the daily O3 pattern (Figure 7b) was similar for all days of the week and the wind rose for O3 (Figure 5c) is not indicative of any specific sources in the western BIC.
CO assessment
The maximum measured 1-h average concentration for CO was 1910 ppbv (2200 μg/m3), which did not exceed the South African standard of 26 000 ppbv (30 000 μg/m3). The mean 1-h average concentration was 230 ppbv (270 μg/m3) for the entire sampling period. The 8-h moving average (calculated from 1-h averages) had a maximum of 880 ppbv (1020 μg/m3), which did not exceed the 8700 ppbv (10 000 μg/m3) South African and European standard.
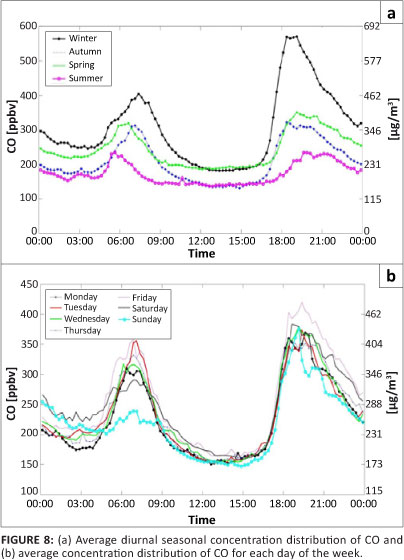
The diurnal seasonal patterns for CO concentrations are shown in Figure 8a. Similarly to NO2, CO peaked between 06:00 and 10:00, as well as between 17:00 and 22:00. If high- stack emissions from pyrometallurgical smelters were the dominant contributor to CO levels, a single peak in the morning after the break-up of the low-level inversion layers would have been observed (similar to SO2). Furthermore, if regional biomass combustion was the main contributor to CO, a single mid-morning peak after the break-up of the inversion layers would have been observed. The diurnal CO peaks correspond with typical periods for household combustion, which is also verified by the more pronounced second diurnal CO peak (between 17:00 and 22:00) in winter when space heating is mostly applied. This pattern is also confirmed by similar diurnal seasonal patterns observed for BC. BC is also associated with CO from household combustion emissions. BC also exhibited bimodal diurnal peaks, with the second peak being more pronounced in winter. Additionally, there was an inverse correlation between monthly average CO concentrations and monthly average temperatures -lower temperatures result in greater household combustion, which consequently leads to higher CO levels.
Particulate matter assessment
The current South African and European 24-h average standards for particulate matter up to 10 μιτι in size (PM10) are 120 μg/m3 and 50 μg/m3, respectively. The South African legislation allows four tolerable exceedances per year, while European legislation allows 35 tolerable exceedances per year. In 2015, the South African standard will change to 75 μg/m3 and will allow four tolerable exceedances per year. The mean 24-h average PM10 concentration for the entire sampling period was 44 μg/m3 and the highest 24-h average PM10 concentration was 222 μg/m3. During the sampling period, the current and future South African standards were exceeded 6.6 and 42.3 times per year, respectively, while the European standard was exceeded 120.2 times per year. The maximum annual average concentration for the sampling period was 46 μg/m3, which is above the 2015 South African and current European annual standard of 40 μg/m3. The number of 24-h average PM10 concentration exceedances, together with the mean annual average PM10 levels, clearly indicates the magnitude of PM10 pollution in this area.
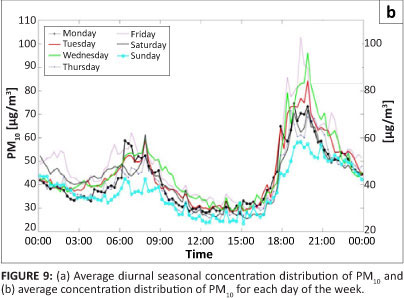
The PM10 diurnal seasonal cycle had a peak between 06:00 and 10:00, as well as a second peak between 17:00 and 22:00 (Figure 9a). This bimodal pattern correlates with the NO2, CO and BC patterns, indicating that the most likely source for atmospheric PM10, at this specific sampling site, was household combustion. The PM10 diurnal trend for each day of the week is presented in Figure 9b. This trend is also similar to the patterns observed for NO2, CO and BC, again confirming household combustion for cooking and space heating as the major source.

Conclusions
By comparing the results obtained during this investigation with South African and European air quality standards, it is evident that SO2, NO2 and CO concentrations at this site in the western BIC are generally acceptable. Considering the number of potential large point sources of these species in this area, the aforementioned results were somewhat unexpected. These results are, however, good when considering human health and environmental impacts. Although no significant exceedances were recorded for SO2, NO2 and CO, the major contributing sources could be identified as high-stack industry emissions for SO2, and household combustion for NO2 and CO.
In contrast, O3 and PM10 frequently exceeded standards. O3 exceeded the 8-h moving average standard of 61 ppbv more than 322 times per year. The main contributing factor was identified to be regional sources, with high O3 precursor species concentrations. This problem can only be addressed by reducing the regional sources of O3 precursors (e.g. CO and NO2). Currently, vast areas of southern Africa are annually burned during the dry season, producing high levels of O3 precursors, while low-income households rely heavily on coal and wood combustion for cooking and space heating. The vehicular fleet in South Africa is relatively old and public transport is not readily available. Additionally, almost no large industries currently remove NOx, notwithstanding that South Africa is well known for its NO2 hotspot over the Highveld Priority Area. In order to address the regional O3 problem, government needs to address the abovementioned issues.
PM10 exceeded 120 μg/m3, the current South African 24-h standard, 6.6 times per year, while the 2015 standard of 75 μg/m3 was exceeded 42.3 times per year. The European 24-h standard of 50 μg/m3 was exceeded more than 120 times per year. The overall PM10 average concentration for the entire sampling period of 44 μg/m3 exceeded the current European and 2015 South African annual average standard of 40 μg/m3, which emphasises the particulate matter pollution problem in the western BIC. The main source of PM10 at this site was identified as local household combustion. This problem can only be rectified by socio-economic upliftment of low-income groups. The problem of household-produced pollutants is pronounced from a health point of view as the population is directly exposed to the highest concentrations during their everyday activities. Therefore, in addition to the reduction of industrial emissions that are targeted by current South African legislation, measures to reduce emissions from domestic burning would need to take place for the current PM pollution situation to be improved.
Acknowledgements
We acknowledge financial support by the Academy of Finland under the Air Pollution in Southern Africa (APSA) and Atmospheric Monitoring Capacity Building in Southern Africa projects (project numbers 117505 and 132640), the European Commission 6th Framework Program project EUCAARI (contract no 036833-2) and the North-West University. We would also like to express our appreciation for logistical support provided by Mr Tshepo Lenake (Rustenburg Municipality).
Competing interests
We declare that we have no financial or personal relationships which may have inappropriately influenced us in writing this article.
Authors' contributions
A.D.V. was the main investigator as the study formed part of his MSc; V.V., H.L. and D.M. maintained the research station and thus contributed to generating the data; P.T. and M.J. assisted with the data analysis; J.P.B. and P.G.v.Z. supervised the research; M.K. and J.J.P. made conceptual contributions; and L.L. is the main Finnish investigator in the North-West University / University of Helsinki collaboration.
References
1. Wenig M, Spichtinger N, Stohl A, et al. Intercontinental transport of nitrogen oxide pollution plumes. Atmos Chem Phys. 2003;3:387-393. http://dx.doi.org/10.5194/acp-3-387-2003 [ Links ]
2. Stern DI. Reversal of the trend in global anthropogenic sulfur emissions. Global Environ Chang. 2006;16:207-220. http://dx.doi.org/10.1016/j.gloenvcha.2006.01.001 [ Links ]
3. Swap RJ, Annegarn HJ, Suttles JT, et al. Africa burning: A thematic analysis of the Southern African Regional Science Initiative (SAFARI 2000). J Geophys Res. 2003;108:15 pages. http://dx.doi.org/10.1029/2003JD003747 [ Links ]
4. Government Gazette [online]. 2005 [cited 2011 Dec 13] Feb 24; No. 27318. Available from: http://www.info.gov.za/view/DownloadFileAction?id=67978 [ Links ]
5. Government Gazette [online]. 2005 [cited 2011 Dec 13] Oct 14; No. 28132. Available from: http://www.info.gov.za/view/DownloadFileAction?id=61585 [ Links ]
6. Government Gazette [online]. 2007 [cited 2011 Dec 13] May 4; No. 29864 Available from: http://www.info.gov.za/view/DownloadFileAction?id=73046 [ Links ]
7. Cramer LA, Basson J, Nelson LR. The impact of platinum production from UG2 ore on ferrochrome production in South Africa. J S Afr I Min Metall. 2004;104(9):517-527. [ Links ]
8. Xiao Z, Laplante AR. Characterizing and recovering the platinum group minerals - a review. Miner Eng. 2004;17:961-979. http://dx.doi.org/10.1016/j.mineng.2004.04.001 [ Links ]
9. Beukes JP, Dawson NF, Van Zyl PG. Theoretical and practical aspects of Cr(VI) in the South African FeCr industry. J S Afr I Min Metall. 2010;110:743-750. [ Links ]
10. Scott GM. The development of a methodology for the delineation of air quality management areas in South Africa. PhD thesis, Durban, University of KwaZulu-Natal, 2010. [ Links ]
11. Piketh S, Van Nierop M, Rautenbach C, et al. Rustenburg local municipality air quality management plan. Witbank: Palace Consulting Engineers Ltd.; 2005. [ Links ]
12. Bornman R, Liebenberg-Enslin H, Von Gruenewaldt R. Spatial techniques for regional-scale air quality model evaluation - revisiting the Vaal Triangle air-shed priority area baseline results. Paper presented at: National Association for Clean Air 2010. Proceedings of NACA 2010; 2010 October 13-15; Polokwane, South Africa. Johannesburg: National Association for Clean Air; 2010. p. 10 [ Links ]
13. Collett KS, Piketh SJ, Ross KE. An assessment of the atmospheric nitrogen budget on the South African Highveld. S Afr J Sci. 2010;106(5/6):49-57. http://dx.doi.org/10.4102/sajs.v106i5/6.220 [ Links ]
14. Lourens AS, Beukes JP, Van Zyl PG, et al. Spatial and temporal assessment of gaseous pollutants in the Highveld of South Africa. S Afr J Sci. 2011;107(1/2):55-62. http://dx.doi.org/10.4102/sajs.v107i1/2.269 [ Links ]
15. Laakso L, Laakso H, Aalto PP, et al. Basic characteristics of atmospheric particles, trace gases and meteorology in a relatively clean southern African savannah environment. Atmos Chem Phys. 2008;8:4823-4839. http://dx.doi.org/10.5194/acp-8-4823-2008 [ Links ]
16. Petájá T, Laakso L, Pohja T, et al. Mobile air quality monitoring trailer for developing countries. Poster presented at: European Aerosol Conference 2007; 2007 Sep 9-14; Salzburg, Austria. [ Links ]
17. Vakkari V, Laakso H, Kulmala M, et al. New particle formation events in semi-clean South African savannah. Atmos Chem Phys. 2011;11:3333-3346. http://dx.doi.org/10.5194/acp-11-3333-2011 [ Links ]
18. MATLAB. Natick, MA: Mathworks [cited 2009 Nov 21] [ Links ].
19. Hybrid Single-Particle Lagrangian Integrated Trajectory (HYSPLIT). Version 4.8 [cited 2009 Dec 04]. Silver Spring, MD: Air Resources Laboratory, National Oceanic and Atmospheric Administration. Available from: http://www.arl.noaa.gov. [ Links ]
20. Garstang M, Tyson PD, Swap R, et al. Horizontal and vertical transport of air over southern Africa. J Geophys Res. 1996;101:721-736. http://dx.doi.org/10.1029/95JD00844 [ Links ]
21. Tyson PD, Garstang M, Swap R. Large-scale re-circulation of air over southern Africa. J Appl Meteorol. 1996;35:2218-2236. http://dx.doi.org/10.1175/1520-450(1996)035<2218:LSROAO>2.0.CO;2 [ Links ]
22. Han S, Bian H, Feng Y, et al. Analysis of the relationship between O3, NO and NO2 in Tianjin, China. Aerosol Air Qual Res. 2011;11:128-139. http://dx.doi.org/10.4209/aaqr.2010.07.0055 [ Links ]
23. Josipovic M, Annegarn HJ, Kneen MA, et al. Concentrations, distributions and critical level exceedance assessment of SO2, NO2 and O3 in South Africa. Environ Monit Assess. 2010;171:181-196. http://dx.cfoi.org/10.1007/s10661-009-1270-5 [ Links ]
24. Laakso L, Vakkari V, Laakso H, et al. South African EUCAARI-measurements: A site with high atmospheric variability. Atmos Chem Phys Discuss. 2010;10:30691-30729. http://dx.doi.org/10.5194/acpd-10-30691-2010 [ Links ]
 Correspondence to:
Paul Beukes
Private Bag X6001
Potchefstroom 2520
South Africa
E-mail: paul.beukes@nwu.ac.za
Received: 15 Dec. 2011
Accepted: 15 May 2012
Published: 14 Sept. 2012
© 2012. The Authors. Licensee: AOSIS OpenJournals. This work is licensed under the Creative Commons Attribution License.

