


Services on Demand
Article
 English (pdf)
 Article in xml format
 Article references
Indicators

Related links
-
 Cited by Google
 -
 Similars in Google
Share

 Permalink
South African Journal of Science
On-line version ISSN 1996-7489
Print version ISSN 0038-2353
S. Afr. j. sci. vol.108 n.1-2 Pretoria Jan. 2012
REVIEW ARTICLE
The South African National Vegetation Database: history, development, applications, problems and future
Michael C. RutherfordI,II; Ladislav MucinaIII; W. PowrieI
IApplied Biodiversity Research Division, South African National Biodiversity Institute, Claremont, South Africa
IIDepartment of Botany and Zoology, Stellenbosch University, Stellenbosch, South Africa
IIICurtin Institute for Biodiversity and Climate, Department of Environment and Agriculture, Curtin University, Perth, Australia
ABSTRACT
Southern Africa has been recognised as one of the most interesting and important areas of the world from an ecological and evolutionary point of view. The establishment and development of the National Vegetation Database (NVD) of South Africa enabled South Africa to contribute to environmental planning and conservation management in this floristically unique region. In this paper, we aim to provide an update on the development of the NVD since it was last described, near its inception, more than a decade ago. The NVD was developed using the Turboveg software environment, and currently comprises 46 697 vegetation plots (relevés) sharing 11 690 plant taxa and containing 968 943 species occurrence records. The NVD was primarily founded to serve vegetation classification and mapping goals but soon became recognised as an important tool in conservation assessment and target setting. The NVD has directly helped produce the National Vegetation Map, National Forest Type Classification, South African National Biodiversity Assessment and Forest Type Conservation Assessment. With further development of the NVD and more consistent handling of the legacy data (old data sets), the current limitations regarding certain types of application of the data should be significantly reduced. However, the use of the current NVD in multidisciplinary research has certainly not been fully explored. With the availability of new pools of well-trained vegetation surveyors, the NVD will continue to be purpose driven and serve the needs of biological survey in pursuit of sustainable use of the vegetation and flora resources of the southern African subcontinent.
Introduction
It is particularly important for management and conservation in regions with exceptional floristic diversity that databases are developed that are designed to store information on occurrence and co-occurrence of plant taxa, and on vegetation characteristics of the region. Such databases serve not only as storage sites of relevant information, but also allow effective and fast data mining1,2 for purposes of scientific enquiry and discovery.3,4,5,6 These databases are a vital source of information for wide-ranging practical applications in many fields of national significance. For instance, sufficiently comprehensive vegetation databases allow identification of ecological indicator species7 or species groups to assist in environmental assessment and monitoring, and extraction of species-diversity patterns for developing conservation targets.8,9,10
Southern Africa has one of the richest floras in the world, showing very high levels of local and regional endemism and unprecedented regional beta diversity.11 Southern Africa is the home of the renowned Capensis (the smallest floristic kingdom of the world) as well as global flora hotspots12 and is undoubtedly one of the most interesting and important areas of the world from ecological and evolutionary points of view. Knowing and managing the floristic richness of southern Africa requires serious engagement in recovering and storing available information about its variability and distribution.
This paper provides an update on the development of the National Vegetation Database (NVD) of South Africa since it was last described a decade ago.13 We briefly review its history as well as the current status of the NVD, its structure and associated problems. We consider the NVD to be an important scientific and natural resource management tool and therefore we investigated (using several examples) strengths and weaknesses of the NVD for application in important current issues such as conservation targeting.
Vegetation databases differ fundamentally from taxonomic databases, such as the South African National Herbarium Pretoria Computerised Information System (PRECIS) database,14 which are based on plant specimens. In contrast to independent occurrences of individual species in taxonomic databases, vegetation sample plot data (also called relevés by European phytosociologists) of vegetation databases provide combinations of species at community level.
Historical highlights of national vegetation databasing in South Africa
The first nationwide vegetation database was created by digital capture of the life's sampling work of John Acocks(ACKDAT15,16) and was aimed at producing a vegetation map of the country.17 Almost all of these mostly comprehensive records of species and estimated abundances at over 3000 sites were sampled between 1945 and 1975. The database was launched in 1994.16 Although it has good coverage in many areas (including the arid areas), ACKDAT is biased by poor sampling coverage in regions of the present-day Limpopo Province as well as in the, then less accessible, Kalahari, Maputaland, Richtersveld and high altitudes of the Cape Fold Mountains. Taxonomy of several critical groups is problematic and the database also suffers from the 'plotless' sampling design: the sampled areas are of variable and uncertain size. There are no precise georeferencing data of the sites; however, the positions of the sampled areas were identified with a precision of 1 km - 3 km. There are currently 289 414 floristic records in the database. ACKDAT played an important part in preliminary classifications precedingvegetation mapping in the Nama-Karoo18 and assisted descriptions of vegetation types of the National Vegetation Map.19
The NVD was conceived during the visiting fellowship period of L. Mucina in the research group of G.J. Bredenkamp at the Department of Botany, University of Pretoria in late 1996. The original intention was to collate numerous vegetation plot data sets (published mainly in the South African Journal of Botany) and those in phytosociological masters and doctoral degree theses, primarily covering vegetation of the Grassland and Savanna Biomes20 into a format readily amenable to large-scale syntaxonomic revisions. Turboveg21 (http://www.synbiosys.alterra.nl/turboveg), currently version 2.85, was chosen as the software platform. The unprecedented success of Turboveg in unifying the phytosociological data storage and handling in Europe (and later in some other parts of the world) followed cooperative initiatives developed in the European Vegetation Survey - a working group of the International Association for Vegetation Science.22,23
In early 1997, the budding vegetation database was recognised as a potentially useful tool for supporting the National Vegetation Map project initiated in 199524 and was referred to as the VEGMAP Database.25 Since September 2000 the NVD was jointly curated by the National Botanical Institute and Stellenbosch University. It was also in this year13 when the database received its current name - the National Vegetation Database. It subsequently fell under private curation by L. Mucina (then associated with the Universities of the North, Free State and Stellenbosch) during an unfunded period until mid-2009 when it was placed under the corporate governance of the South African National Biodiversity Institute (SANBI).
Coincidentally, this decade which saw the successful completion of the major collaborative project on the national vegetation map19,26,27 was also a decade that witnessed a major slump in new vegetation survey projects (Figure 1). In late 2009 and early 2010, SANBI undertook an assessment of the NVD, during which metadata were expanded, duplications identified and removed, and several issues were flagged for future attention. The NVD is now registered with the Global Index of Vegetation-Plot Databases28 which shows it to be one of the largest vegetation databases in Africa.
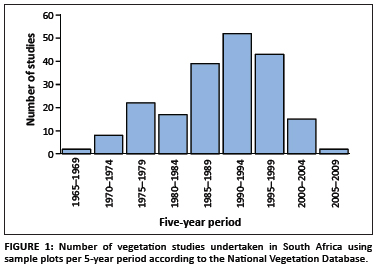
The earliest known systematic botanical surveys were conducted in Robertson Karoo vegetation29 and Fynbos vegetation at the Cape of Good Hope.30 The 1970s experienced a surge in plot-based vegetation sampling (Figure 1), supported by the Botanical Survey Section of the Botanical Research Institute, encouraged by visiting phytosociologists from Europe (M.J.A. Werger and F. van der Meulen). This effort was soon joined by several universities and nature conservation agencies which increasingly made contributions to the systematic vegetation knowledge base. The carry-over of results from fieldwork from the 1980s for publication in the 1990s, together with the notable sterling efforts by certain universities and the Agricultural Research Council, led to the 1990s becoming the golden decade of vegetation survey studies in South Africa. We believe that the publication of the National Vegetation Map (and accompanying products) as well as the new consolidated National Vegetation Databaseand only recently (2008) established National Vegetation Map Committee should provide a new impetus to recognise the need for deepening of vegetation survey work in South Africa.
National Vegetation Database: Current problems and challenges
Data availability and geographical coverage
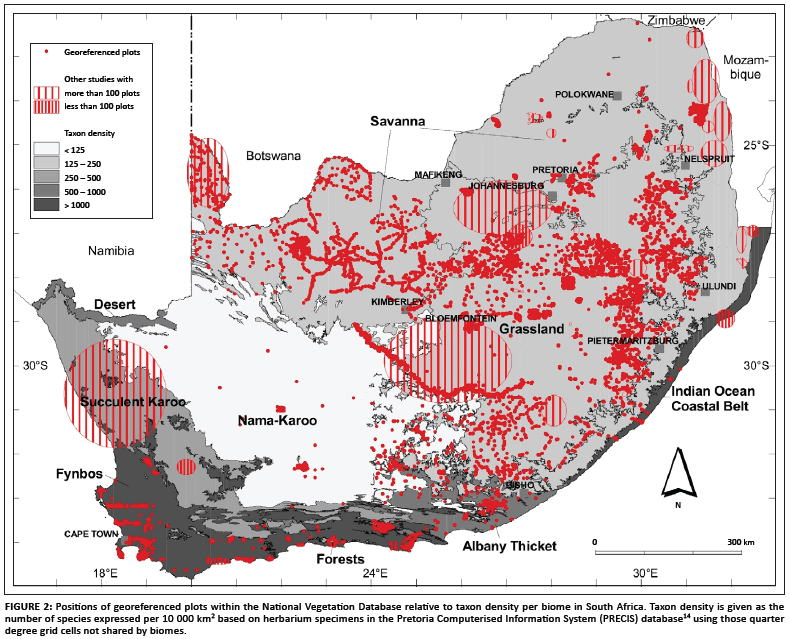
The NVD currently comprises 46 697 vegetation plots sharing 11 690 vascular plant taxa, and has 968 943 species occurrences. A few plots from the 'embedded' country of Lesotho are included in the NVD. The current geographica coverage of the NVD is highly skewed with a number of major mismatches between the georeferenced plot data and taxon density at biome level (Figure 2). Georeferenced plots are relatively well represented in Kalahari savanna areas and in the high-lying grassland areas of South Africa. Fynbos and Indian Ocean Coastal Belt are very poorly represented. Succulent Karoo is hardly represented at all even though there are many non-georeferenced plots for some regions of this biome. Many existing (unpublished) data sets from the Succulent Karoo and Desert Biomes have not yet been captured for various reasons. We realise, for example, that a wealth of vegetation plot data has been collected for western parts of the Succulent Karoo and Fynbos Biomes on BIOTA Observatories.31 These data form part of a separate database - BIOTABase. Funding of future vegetation survey projects should take into account the need to specifically cover very poorly represented areas of the country. We hope that as NVD becomes more established, people with vegetation survey data in South Africa will see the value of contributing their data to the NVD.
Data quality control
A significant proportion of the data in the NVD are so called 'legacy data', that is, the very old data sets, usually collected using outdated sampling schemes and often not accompanied by important metadata that allows for judgement on the quality of the sampling. Central to the problem of legacy data is often the lack of a clear audit trail, which in turn results in data quality concerns and uncertainty regarding the degree of confidence in the data.32
Three additional data fields were added to the NVD in late 2009: species bias, locality confidence and climatic uniformity. These additional fields were needed to qualify data instead of rejecting outright incomplete or imprecise data and therefore had a fundamental bearing on the quality control, and hence the usefulness, of the data.
The first additional field was 'species bias'. This field indicates plots where lists of recorded species were incomplete or very likely to be incomplete. Various types of species absences exist. In some forest projects only woody species were recorded and often only plants above a certain size (e.g. 10 cm diameter at breast height) were included. Absences of all species of a growth form known to be in a sample area were flagged. Some studies do not list rare species in their final phytosociological table. Other studies were flagged where the expected relatively long list of rare species seems unusually short compared to the expected species distributions.33 Some data sets are marked as probably incomplete based on their unusually low mean species richness compared to others using the same plot size in the same region.
The second additional field was 'locality confidence'. Retrospective georeferencing, which is commonly needed with legacy data, showed a wide range of spatial precision, specified in terms of a radius in metres, of sample plots. A coordinate with decimal degrees to four decimal places has an apparent accuracy of 7 m. The centroid of a reserve or farm is represented by an approximate radius commonly between 3 km and 10 km. A distance greater than 10 km was regarded as indicating a non-georeferenced plot.
The last additional field was 'climatic uniformity' around a sample plot. This field was mainly required to indicate the suitability of the plot for climate change modelling. Suitability was flagged where modelled climate data34 on a 1 x 1 minute grid around the plot was sufficiently uniform for unambiguously linking the plot data to climate data. Plots on steep climatic gradients (e.g. in topographically diverse habitats) and plots known to occur in climatically unique microhabitats (e.g. small forest patches on the escarpment) were marked as unsuitable.
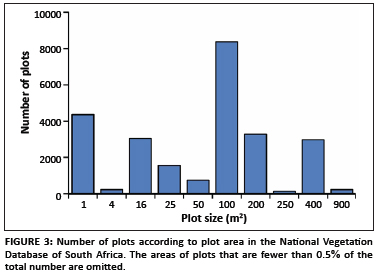
Various types of information were recorded for curatorial control purposes. For example, if the plot area can be captured or if it is simply not available. A number of data sets in the NVD omit the area of the plot. It should also be noted that there is considerable variation in plot size within the NVD (Figure 3).
There are 36 fields to capture so called 'header data' in Turboveg. The 'header data' describe the plot and include data fields containing geographical position, literature source (if relevant), size of plot, basic characteristics of the sampled vegetation (such as the percentage cover-abundance of various layers and the height of vegetation), and date of sampling.35 The header data set can be extended, and was extended for the NVD by data fields specific to South Africa with related pop-up lists (e.g. veld types and biomes). Because data were captured at various locations (by various working groups), new fields of the header data were added. In fact, there are 268 new columns in the header data table since the approximately 310 Turboveg data sets have been merged. Many different fields store the same kind of data. These fields could not be automatically combined in merging the databases, had no specifications for the data stored in them, no pop-up lists and no limits. We hope that these drawbacks will be overcome by central NVD management and adherence to standards which still have to be formulated and implemented.
Experience gained in populating the NVD has led to the development of a workflow procedure for treating potential data for incorporation in the NVD. The many detailed criteria include screening for errors of commission - when a species is mistakenly thought to be present36 - by using databases such as PRECIS in parallel.
Problem of the standard species checklist
The use of a static species list was an important limitation in South Africa, where taxonomy of many plant taxa is not yet stable and where many taxa are awaiting formal recognition (description and assignment of scientific name). Species names were subsequently carefully matched during the assessment in 2010 to the flora database, PRECIS14, and a tight link was created to enable using PRECIS as the standard.
The update of taxonomy and nomenclature in a database is not a trivial matter as witnessed by the complexity of the structure to address this issue by the team developing the United States VegBank (http://www.vegbank.org). The current rigid structure of NVD with a standard checklist is being remedied with an improved link between Turboveg and the central taxon database to enable ongoing taxonomic updates. Solutions to the problems caused by dynamic plant taxonomy (especially in developing countries) in vegetation databases are not easily applied.37
Applications using the National Vegetation Database
Applications and available data combinations
Data from the database have been used for vegetation classification and conservation targets. Data can also be used to explore projected impacts of climate change on species, species diversity patterns, abundance gradients and species co-occurrences and non co-occurrences. For a number of these applications it is currently inappropriate to attempt formal national analyses given the highly geographically skewed representation of the data. Data requirements for most of these applications are unique and, as a result of an unevenly populated database, the number of available plots per application can differ greatly (Table 1).
Formal classification of vegetation usually expects plots with full floristic lists and relative abundances of species. Perhaps unsurprisingly, given that the main initial purpose of the NVD was for classification of vegetation, is that 85% of plots complied with these requirements. More recently it has been shown that vegetation classification can be distorted by plot size.38 Inclusion of the criterion of plot size would reduce the proportion of compliant plots to 44%. Either way, the strong geographical bias of the NVD limits its usefulness for classification to specific regions. Setting conservation targets for vegetation types requires that all species are recorded and that plots are georeferenced. Although the species-area relationships are fundamental to setting these conservation targets, it has been claimed that the power exponent (z) of the commonly used power relationship is remarkably insensitive to plot size. This finding was derived from an independent study across vegetation types of the Succulent Karoo.8 However, other studies that included Succulent Karoo have indicated a greater dependence of the z-value on plot size.39 The inclusion of plot size as a criterion for setting conservation targets would result in the proportion of available plots declining from 33% to 21%.
Estimating the impact of climate change on species requires georeferenced plots that are unambiguously linked to available modelled climate data, which would limit this analysis to 32% of plots. Species diversity (richness and evenness) is highly scale dependent and requires known plot size as well as a record of all species. Spatial species diversity also requires georeferenced plots, which, when taken together, would result in only 21% of plots of the database satisfying these requirements. About 35% of plots are potentially suitable for exploring cover-abundance gradients, that is, changes in cover-abundance across the landscape. Analysis of potential species co-occurrences in terms of positively and negatively associated species in smaller plot sizes (< 400 m2) would allow 44% of the plots to be used. We limit further discussion to the first two applications mentioned.
Classification of vegetation
Review of the use of databases for vegetation classification purposes is beyond the purpose of this paper; however, it is obvious that the European Turboveg databases, in particular, were primarily designed to serve this purpose. It is also not surprising that these databases have served this purpose convincingly well (for example see Schaminée et al.40).
In South Africa, the NVD has served as a source of data for preliminary vegetation classification using data subsets from the Fynbos Biome. Data from ACKDAT were added to Turboveg for classification of vegetation in the NamaKaroo.41 Use of the NVD for deriving vegetation types of much of the Fynbos and Succulent Karoo Biomes was limited by the patchy geographical coverage of georeferenced plot data (Figure 2). Capture of about 5000 forest vegetation plots and their classification leading to the National Forest Type Classification42,43,44 was undoubtedly the most extensive and useful classification project assisted by Turboveg in South Africa to date.
An earlier alternative system of vegetation classification, which used plant structural characteristics and higher taxa (such as Families), has been applied by Campbell45 within the Fynbos Biome. This system was derived specifically for Fynbos vegetation, to, amongst other reasons, avoid the difficulty of identifying the large number of species typically encountered in Fynbos.46 Campbell46 contends, for theoretical reasons, that floristic classification will answer biogeographical rather than ecological questions and that a structural classification would differ in this respect. This theoretical basis is contentious, especially because vegetation structure is convergent in nature - that is, the same structural phenomena can be encountered under very different habitat conditions.47 We agree with the view that after the completion of a sufficient number of phytosociological surveys in Fynbos, a formal taxonomic synthesis of the entire Fynbos Biome will be feasible.48
Conservation targets
One of the characteristics of systematic conservation planning is its use of explicit targets for biodiversity features.49 Targets provide a defensible basis for conservation decisions and also provide a benchmark against which to measure the success of conservation action.8 The NVD was used to establish targets for the several hundred vegetation types of South Africa, Lesotho and Swaziland19 and was first achieved for the South African National Spatial Biodiversity Assessment (NSBA) of 2004.9 The NSBA was the first ever comprehensive spatial assessment of biodiversity throughout South Africa. This assessment provided spatial priorities for conservation action. The conservation targets were derived using cumulative species numbers for increasing areas based on plot data that led to a power curve relationship.8 This relationship was used to determine the areal land extent required to be set aside to conserve at least 75% of species that occur in each vegetation type. Resulting targets, except for forests, ranged between 16% and 36% of the original extent of vegetation types.9 The targets were published in hardcopy form; the highest average conservation targets per vegetation type for these biomes were 32% for Desert and 28% for Fynbos.10 A similar approach was used to set conservation targets for the national forest types50 where Scarp forests were found to have the highest target, in excess of 25%. By contrast, national animal databases of species occurrence data, such as the bird atlas51 and frog atlas,52 were not suitable for calculating targets for habitat conservation in the NSBA.9 These atlases were used, as was PRECIS, for spatial analyses of species of special concern in determining regions of high species irreplaceability and areas containing critically endangered species.
Conclusions
A number of lessons were learned in the development of the NVD. The most important was probably to ensure that management of the development of the database was adequately funded. Adequate funding would help to ensure greater consistency and adherence to standards. More comprehensive planning and a clearer implementation strategy with more regular external review would also have been advantageous.
We suggest that the further development of the NVD should be purpose driven and should serve current needs of biological survey and sustainable use of the vegetation and flora resources of the subcontinent. The NVD should establish a reputation not only as a source of data for purposes of basic research, but also as an important tool to assist with making informed managerial and political decisions in the fields of environmental planning and management, land use, sustainable use of biological resources and global change scenarios, amongst others. Use of the NVD in multidisciplinary research has been little explored.
The NVD should develop to serve diverse needs and therefore its structures should be more flexible up to a point, possibly allowing the storage of vegetation data such as plotless samples, demographic measurements and permanent-plot data series in addition to the classical plot species and environmental data. In addition, the NVD needs to ensure that it abides by exchange standards between vegetation databases such as that for plot-based vegetation data.53
Besides the flexible internal structure, major attention should be paid to improving the procedures for updating the species list, which requires adaptation of the current Turboveg model involving stable, yet editable species, but which does not allow for controlled cross-referencing of various taxonomic concepts. In this respect, the US VegBank project should be consulted for a possible solution.
Outside the control of the NVD is the creation of new data. The large current imbalance in geographical coverage needs to be addressed. Development of reliable, robust ecological indicators needs much wider sampling than is available in the current NVD. For example, analysis of the rate of floristic change at vegetation ecotones also requires much more intensive sampling than has been done.
Control of data quality remains a challenge. Improvements here should include the checking of species identity by cross-referencing with existing flora databases (such as PRECIS). The entry of voucher specimens into the NVD accompanying the plot data should be enabled, thereby allowing more intensive involvement of taxonomic experts. Metadata should include information about the conditions relevant to the sample(s) (e.g. sampling in an abnormally dry year54).
As in the case of other, well-established vegetation databases, the NVD should seek to build interfaces with ecologically and economically important data sets on climate, geology, landscape history and ecological traits of species. The Dutch examples - SynBioSys Netherlands55 and SynBioSys Europe (http://www.synbiosys.alterra.nl/synbiosyseu/) - should serve as inspiration. In fact, several local initiatives have emerged through cooperation of South African ecologists and botanists leading to SynBioSys Kruger (http://www.alterra.wur.nl/UK/newsagenda/archive/news/2006/SynBioSys_Kruger.htm) and SynBioSys Fynbos (http://www.synbiosysfynbos.org/home.html).
Each database serves its purpose only when populated with high-quality and a large quantity of data. Collecting new data sets is always very costly and always involves one indispensable ingredient - a well-trained vegetation surveyor. A revitalisation of local training in systematic vegetation survey is required, without which there will be far-reaching negative consequences for science as well as for the sustainable utilisation of natural resources within South Africa. The shortage of sufficient local talent and the lack of a sustained tradition of vegetation survey call for a new approach. Expertise should be imported in order to encourage the acquisition of information about one of South Africa's most unique national assets - its highly diverse vegetation.
Acknowledgements
We thank all those who contributed data to the National Vegetation Database of South Africa. L.M. acknowledges the long-term support of SANBI, the Universities of Pretoria, the North, the Free State and Stellenbosch, and the National Department of Water Affairs and Tourism over the years of the development and curation of the NVD.
Competing interests
The corresponding author confirms that there are no personal, employment or commercial affiliations, stock or equity interests or patent-licensing arrangements that could be considered to pose a financial conflict of interest regarding the submitted manuscript (which may potentially prevent them from executing and publishing unbiased research).
Authors' contributions
M.C.R. wrote the first draft for circulation to co-authors; subsequently, L.M. wrote the 'Introduction' with contributions from M.C.R.; M.C.R. and L.M. wrote 'Historical highlights of national vegetation databasing in South Africa'; M.C.R., L.W.P. and L.M. wrote 'Data availability and geographical coverage' and 'Data quality control'; L.M. wrote 'Problem of the standard species checklist' with input from L.W.P.; M.C.R. wrote 'Applications and available data combinations' with input from L.W.P.; L.M. wrote 'Classification of vegetation'; M.C.R. wrote 'Conservation targets'; and L.M. wrote the 'Conclusions' with contributions by M.C.R. All statistics, calculations and extractions from the NVD were done by L.W.P. and checked by M.C.R.; M.C.R. devised Table 1; and L.W.P. prepared Figures 1 to 3.
References
1. Madin J, Bowers S, Schildhauer M, Krivov S, Pennington D, Villàa F. An ontology for describing and synthesizing ecological observation data. Ecol Inform. 2007;2:279-296. http://dx.doi.org/10.1016/j.ecoinf.2007.05.004 [ Links ]
2. McIntosh ACS, Cushing JB, Nadkarni NM, Zeman L. Database design for ecologists: Composing core entities with observations. Ecol Inform. 2007;2:224-236. http://dx.doi.org/10.1016/j.ecoinf.2007.07.003 [ Links ]
3. Ozinga WA, Hennekens SM, Schaminée JHJ, et al. Assessing the relative importance of dispersal in plant communities using an ecoinformatics approach. Folia Geobot. 2005;40:53-67. http://dx.doi.org/10.1007/BF02803044 [ Links ]
4. Ozinga WA, Schaminée JHJ, Bekker RM, et al. Predictability of plant species composition from environmental conditions is constrained by dispersal limitation. Oikos. 2005;108:555-561. http://dx.doi.org/10.1111/j.0030-1299.2005.13632.x [ Links ]
5. Chytrý M, Jarošík V, Pyšek P, et al. Separating habitat invisibility by alien plants from the actual level of invasion. Ecology. 2008;89:1541-1553. http://dx.doi.org/10.1890/07-0682.1
6. Gotelli NJ, Anderson MJ, Arita HT, et al. Patterns and causes of species richness: A general simulation model for macroecology. Ecol Lett. 2009;12:873-886. http://dx.doi.org/10.1111/j.1461-0248.2009.01353.x, PMid:19702748 [ Links ]
7. Niemi GJ, McDonald ME. Applications of ecological indicators. Annu Rev Ecol Evol Syst. 2004;35:89-111. http://dx.doi.org/10.1146/annurev.ecolsys.35.112202.130132 [ Links ]
8. Desmet PG, Cowling RM. Using the species-area relationship to set baseline targets for conservation. Ecol Soc. 2004;9(2):11. [ Links ]
9. Rouget M, Reyers B, Jonas Z, et al. South African National Spatial Biodiversity Assessment 2004. Technical report. Volume 1: Terrestrial component. Pretoria: South African National Biodiversity Institute; 2004. [ Links ]
10. Rouget M, Jonas Z, Cowling RM, et al. Ecosystem status and protection levels of vegetation types. In: Mucina L, Rutherford MC, editors. The vegetation of South Africa, Lesotho and Swaziland. Pretoria: South African National Biodiversity Institute, 2006; p. 725-737. [ Links ]
11. Cowling RM, Gibbs Russell GE, Hoffman MT, Hilton-Taylor C. Patterns of plant species diversity in southern Africa. In: Huntley BJ, editor. Biotic diversity in southern Africa: Concepts and conservation. Cape Town: Oxford University Press, 1989; p. 19-50. [ Links ]
12. Mittermeier RA, Meyers N, Robles GP, Mittermeier GC. Hotspots: Earth's biologically richest and most endangered terrestrial ecoregions. Mexico City: CEMEX and Conservation International; 2000. [ Links ]
13. Mucina L, Bredenkamp GJ, Hoare DB, McDonald DJ. A national vegetation database for South Africa. S Afr J Sci. 2000;96:497-498. [ Links ]
14. Gibbs Russell GE, Arnold TH. Fifteen years with the computer: Assessment of the 'PRECIS' taxonomic system. Taxon. 1989;38:178-195. http://dx.doi.org/10.2307/1220833 [ Links ]
15. O'Callaghan M. National grid of vegetation sites: Reality check. S Afr J Sci. 2000;96:231-233. [ Links ]
16. Rutherford MC, Powrie LW, Midgley GF. ACKDAT: A digital spatial database of distributions of plant species and plant assemblages. S Afr J Bot. 2003;69:99-104. [ Links ]
17. Acocks JPH. Veld types of South Africa. Mem Bot Surv S Afr. 1988;57:1- [ Links ]
18. Mucina L, Rutherford MC, Powrie LW. Logic of the map: Approaches and procedures. In: Mucina L, Rutherford MC, editors. The vegetation of South Africa, Lesotho and Swaziland. Pretoria: South African National Biodiversity Institute, 2006; p. 12-29. [ Links ]
19. Mucina L, Rutherford MC, editors. The vegetation of South Africa, Lesotho and Swaziland. Pretoria: South African National Biodiversity Institute; 2006. [ Links ]
20. Rutherford MC, Mucina L, Powrie LW. Biomes and bioregions of southern Africa. In: Mucina L, Rutherford MC, editors. The vegetation of South Africa, Lesotho and Swaziland. Pretoria: South African National Biodiversity Institute, 2006; p. 30-51. [ Links ]
21. Hennekens SM, Schaminée JHJ. TURBOVEG, a comprehensive data base management system for vegetation data. J Veg Sci. 2001;12:589-591. [ Links ]
22. Mucina L, Rodwell JS, Schaminée JHJ, Dierschke H. European Vegetation Survey: Current state of some national programmes. J Veg Sci. 1993;4:429- 438. http://dx.doi.org/10.2307/3235603 [ Links ]
23. Rodwell JS, Pignatti S, Mucina L, Schaminée JHJ. European Vegetation Survey: Update on progress. J Veg Sci. 1996;6:759-762. http://dx.doi.org/10.2307/3236447 [ Links ]
24. Rutherford MC, Mucina L. Introduction. In: Mucina L, Rutherford MC, editors. The vegetation of South Africa, Lesotho and Swaziland. Pretoria: South African National Biodiversity Institute, 2006; p. 2-10. [ Links ]
25. McDonald DJ. VEGMAP: A collaborative project for a new vegetation map of southern Africa. S Afr J Sci. 1997;93:424-426. [ Links ]
26. Mucina L, Rutherford MC, Powrie LW, editors. Vegetation map of South Africa, Lesotho and Swaziland. 1:1 000 000 scale sheet maps. Pretoria: South African National Biodiversity Institute; 2005. [ Links ]
27. Mucina L, Rutherford MC, Powrie LW, editors. Vegetation map of South Africa, Lesotho and Swaziland. 1:1 000 000 scale sheet maps. 2nd ed. Pretoria: South African National Biodiversity Institute; 2007. [ Links ]
28. Dengler J, Jansen F, Glöckler F, et al. The Global Index of Vegetation-Plot Databases 1 (GIVD): A new resource for vegetation science. J Veg Sci. 2011;22:582-597. [ Links ]
29. Joubert JGV. [The ecology of the grazing land of the Robertson-Karoo]. DSc thesis, Stellenbosch, University of Stellenbosch, 1968. Afrikaans. [ Links ]
30. Taylor HC. A vegetation survey of the Cape of Good Hope Nature Reserve. MSc thesis, Cape Town, University of Cape Town, 1969. [ Links ]
31. Jürgens N, Haarmeyer DH, Luther-Mosebach J, Dengler J, Finckh M, Schmiedel U, editors. Biodiversity in southern Africa. Volume 1: Patterns at local scale - the BIOTA Observatories. Göttingen & Windhoek: Klaus Hess Publishers; 2010. [ Links ]
32. Guralnick RP, Hill AW, Lane M. Towards a collaborative, global infrastructure for biodiversity assessment. Ecol Lett. 2007;10:663-672. http://dx.doi.org/10.1111/j.1461-0248.2007.01063.x, PMid:17594421, PMCid:2040220 [ Links ]
33. McGill BJ, Etienne RS, Gray JS, et al. Species abundance distributions: Moving beyond single prediction theories to integration within an ecological framework. Ecol Lett. 2007;10:995-1015. http://dx.doi.org/10.1111/j.1461-0248.2007.01094.x, PMid:17845298 [ Links ]
34. Schulze RE. South African atlas of agrohydrology and -climatology. Report TT82/96. Pretoria: Water Research Commission; 1997. [ Links ]
35. Mucina L, Schaminée JHJ, Rodwell JS. Common data standards for recording relevés in field survey for vegetation classification. J Veg Sci. 2000;11:769-772. http://dx.doi.org/10.2307/3236581 [ Links ]
36. Rondinini C, Wilson KA, Boitani L, Grantham H, Possingham HP. Tradeoffs of different types of species occurrence data for use in systematic conservation planning. Ecol Lett. 2006;9:1136-1145. http://dx.doi.org/10.1111/j.1461-0248.2006.00970.x, PMid:16972877 [ Links ]
37. Jansen F, Dengler J. Plant names in vegetation databases - A neglected source of bias. J Veg Sci. 2010;21:1179-1186. http://dx.doi.org/10.1111/j.1654-1103.2010.01209.x [ Links ]
38. Dengler J, Löbel S, Dolnik C. Species constancy depends on plot size - A problem for vegetation classification and how it can be solved. J Veg Sci. 2009;20:754-766. http://dx.doi.org/10.1111/j.1654-1103.2009.01073.x [ Links ]
39. Schmiedel U, Dengler J, Luther-Mosebach J, et al. Patterns and dynamics of vascular plant diversity along the BIOTA transects in southern Africa. In: Schmiedel U, Jürgens N, editors. Biodiversity in southern Africa. Volume 2: Patterns and processes at regional scale. Göttingen & Windhoek: Klaus Hess Publishers, 2010; p. 118-135. [ Links ]
40. Schaminée JHJ, Hennekens SM, Chytrý M, Rodwell JS. Vegetation-plot data and databases in Europe: An overview. Preslia. 2009;81:173-185. [ Links ]
41. Rutherford MC, Mucina L, Powrie LW. Nama-karoo veld types revisited: A numerical analysis of original Acocks' field data. S Afr J Bot. 2003;69:52-61. [ Links ]
42. Von Maltitz G, Mucina L, Geldenhuys CJ, et al. Classification system for South African indigenous forests. An objective classification for the Department of Water Affairs and Forestry. Report ENV-PC 2003-17. Pretoria: Environmentek, CSIR; 2003. [ Links ]
43. Mucina L, Geldenhuys CJ. How to classify South African indigenous forests: Approach, methods, problems, perspectives. In: Seydack AHW, Vorster T, Vermeulen WJ, Van der Merwe IJ, editors. Multiple use management of natural forests and savanna woodlands: Policy refinements and scientific progress. Pretoria: Department of Water Affairs and Forestry, Indigenous Forest Management, 2002; p. 1-9. [ Links ]
44. Geldenhuys CJ, Mucina L. Towards a new national forest classification for South Africa. In: Ghazanfar SA, Beentje HJ, editors. Taxonomy and ecology of African plants, their conservation and sustainable use. Kew: Kew Publishing, 2006; p. 111-129. [ Links ]
45. Campbell BM. A classification of the mountain vegetation of the Fynbos biome. Mem Bot Surv S Afr. 1985;50:1-121. [ Links ]
46. Campbell BM. Vegetation classification in a floristically complex area: The Cape Floristic Region. S Afr J Bot. 1986;52:129-140. [ Links ]
47. Rebelo AG, Boucher C, Helme N, Mucina L, Rutherford MC. Fynbos biome. In: Mucina L, Rutherford MC, editors. The vegetation of South Africa, Lesotho and Swaziland. Pretoria: South African National Biodivesity Institute, 2006; p. 52-219. [ Links ]
48. Cowling RM, Holmes PM. Flora and vegetation. In: Cowling RM, editor. The ecology of fynbos - Nutrients, fire and diversity. Cape Town: Oxford University Press, 1992; p. 23-61. [ Links ]
49. Pressey RL, Cowling RM, Rouget M. Formulating conservation targets for biodiversity pattern and process in the Cape Floristic region, South Africa. Biol Conserv. 2003;112:99-127. http://dx.doi.org/10.1016/S00063207(02)00424-X [ Links ]
50. Berliner D, Desmet P, Mucina L. Revision of forest conservation targets and data preparation for the refinement of SANBI criteria for the listing of threatened forest ecosystems under the Biodiversity Act: Phase 1 and 2. (Project WP 9763 for National Department of Water Affairs & Forestry, Pretoria.) Cape Town: Eco-logic Consulting; 2008. [ Links ]
51. Harrison JA, Underhill LG, Barnard P. The seminal legacy of the Southern African Bird Atlas Project. S Afr J Sci. 2008;104:82-84. [ Links ]
52. Minter LR, Burger M, Harrison JA, Braack HH, Bishop PJ, Kloepfer D, editors. Atlas and red data book of the frogs of South Africa, Lesotho and Swaziland.Washington DC: Smithsonian Institution; 2004. [ Links ]
53. Wiser SK, Spencer N, De Cáceres M, Kleikamp M, Boyle B, Peet RK. Veg-X - An exchange standard for plot-based vegetation databases. J Veg Sci. 2011;22:598-609. http://dx.doi.org/10.1111/j.1654-1103.2010.01245.x [ Links ]
54. Van der Merwe H, Van Rooyen MW, Van Rooyen N. Vegetation of the Hantam-Tanqua-Roggeveld subregion, South Africa. Part 2: Succulent Karoo biome related vegetation. Koedoe. 2008;50:160-183. [ Links ]
55. Schaminée JHJ, Hennekens SM, Ozinga WA. Use of the ecological information system SynBioSys for analysis of large datasets. J Veg Sci. 2007;18:463-470. http://dx.doi.org/10.1111/j.1654-1103.2007.tb02560.x [ Links ]
 Correspondence to:
Michael Rutherford
Postal address: Private Bag X7
Claremont 7735, South Africa
Email: m.rutherford@sanbi.org.za
Received: 14 Feb. 2011
Accepted: 29 July 2011
Published: 17 Jan. 2012
© 2012. The Authors. Licensee: AOSIS OpenJournals. This work is licensed under the Creative Commons Attribution License.

