


Serviços Personalizados
Artigo
 Inglês (pdf)
 Artigo em XML
 Referências do artigo
Indicadores

Links relacionados
-
 Citado por Google
 -
 Similares em Google
Compartilhar

 Permalink
South African Journal of Science
versão On-line ISSN 1996-7489
versão impressa ISSN 0038-2353
S. Afr. j. sci. vol.107 no.1-2 Pretoria Jan./Fev. 2011
http://dx.doi.org/10.4102/sajs.v107i1/2.497
RESEARCH ARTICLES
Analysis of the modern distribution of South African Gerbilliscus (Rodentia: Gerbillinae) with implications for Plio-Pleistocene palaeoenvironmental reconstruction
Timothy L. CampbellI,II; Patrick J. LewisII; Justin K. WilliamsII
IDepartment of Anthropology, Texas A&M University, College Station, Texas, United States
IIDepartment of Biological Sciences, Sam Houston State University, Huntsville, Texas, United States
ABSTRACT
There are four extant species of Gerbilliscus, formally classified as Tatera, native to the southern African subregion, each exhibiting varying degrees of environmental tolerance. These species are also routinely reported from many of the palaeontological and archaeological sites in the region. We used a geographic information systems analysis to examine the distribution of modern Gerbilliscus by georeferencing museum specimens. The distribution of Gerbilliscus was then compared to the latest treatment of the vegetation of South Africa, Lesotho and Swaziland in order to quantify the genus's environmental tolerances and propose a new niche model for this taxon. Palaeoenvironmental reconstructions are made possible by defining the tolerance limits of modern taxa that have persisted relatively unchanged throughout the Plio-Pleistocene. Tolerance limits can then be applied to fossil-bearing localities where these taxa are known to have occurred in the past. Results from our analysis indicated that Gerbilliscus exhibits a wide range of environmental tolerances that must be considered when reconstructing palaeoenvironments.
Introduction
Small mammal faunas are particularly useful in reconstructing past environments as they often have relatively small home ranges and some demonstrate habitat specificity with precise ecological and environmental tolerances.1,2,3 Micromammals, for example, have been used to estimate such environmentally meaningful aspects as vegetation, temperature, seasonality and variation in rainfall.4,5,6,7,8,9 Furthermore, the near ubiquitous nature of rodent microfauna in fossil bearing localities allows for the study of changes in palaeoenvironment and dispersal patterns over wide temporal and spatial ranges.5,6,7,10,11,12,13,14,15,16,17,18 With a lack of well-defined diagnostic dental characters, a better understanding of the habitat preferences and range of temperature and precipitation tolerances exhibited by Gerbilliscus is needed for their accurate use in palaeoenvironmental reconstruction. Results from our analyses indicate that Gerbilliscus exhibits a wide range of temperature and precipitation tolerances and occupies many different habitats, all of which should be considered in palaeoenvironmental reconstructions.
The use of small mammals in palaeoenvironmental reconstruction is based on the principle of actualism, in which the environmental tolerances of extant taxa are presumed to be similar to the fossil specimens they most closely resemble.14,15,16,17 Consequently, it is important that precise neontological data on modern environmental tolerance limits be collected to ascertain the fullest extent of their ecological, or fundamental niche. A taxon's fundamental niche is defined as the set environmental tolerance limits in multidimensional space within which a taxon is potentially able to maintain a viable population indefinitely.19 These tolerances must be qualified, however, as conditions influencing a modern taxon's biogeography may not be the same as those that existed in the past.14,15,16,17 Factors such as competition, predation and other biotic interactions may serve to limit a taxon's distribution to a smaller subset of their fundamental niche, known as their realised niche.20 Nevertheless, an accurate assessment of modern environmental tolerance limits, as currently known, is a prerequisite for any actualistic approach. When accurate data on modern tolerance limits are obtained and applied to fossil-bearing localities, changes in faunal palaeocommunities can be used as proxies for environmental shifts and climatic change.
Within the family Muridae, the ratio of the subfamilies Gerbillinae to Murinae has been used as a faunal indicator of aridity.21,22,23,24,25 As a group, modern Gerbillinae are generally associated with open, arid environments while the Murinae are generally associated with more closed and moist environments. A higher number of individuals or genera belonging to Gerbillinae relative to Murinae, therefore, can yield a rough indication of an area's relative aridity. As differential preservation between these two subfamilies in fossil faunas can occur, factors such as taphonomic and predation biases must be considered when using this approach.21,23
While differences in the frequencies of micromammal remains have been shown to yield important information on changes in past environments,26 in some instances it may not be possible to fully assess the taphonomic and predation biases that have contributed to the accumulation of a fossil assemblage. In these instances the use of presence/absence data may be more appropriate to avoid the habitat signatures of one or a few taxa masking the actual environmental signature as a result of unknown biases.27 The development of niche models for use in cumulative taxonomic habitat indices has been shown to be a useful, abundance-free method for reconstructing past environments.13,23,27,28,29 This approach takes into account the habitat preference variability of modern faunas at different hierarchical levels and allocates values for each habitat proportional to their presumed habitat indication with the sum of all scores totalling 1.13,23,27,28,29 For example, if a taxon is found with equal frequency in grasslands, savannas and deserts, each of these three unique categories would be given a score of 0.33. At the genus level, scores are derived by adding up all the scores for each individual species and dividing by the total number of species in the genus. This process is again repeated for each higher taxonomic level with the values applied to the fossil specimens corresponding to the level at which modern representatives can be found. By averaging the niche model values for each habitat class for all taxa present in a fossil assemblage, a cumulative taxonomic habitat index is generated.
Among African Gerbilliscus there is considerable phenotypic plasticity in characteristics such as hair colour, hind foot length and number of mammae.1,2,3,30,31,32,33 Similarly, dental characters for this group are ambiguous and definitive dental apomorphies are difficult to define because of varying degrees of interspecific overlap.34,35,36 Nevertheless, fragmentary maxillae and mandibles are the most common diagnostic elements found in fossil-bearing localities and are heavily weighted in taxonomic assessments. When dental characters are described for members of Gerbilliscus, they are typically poorly defined and qualitative in nature1,3,30,31,32 and therefore suspect in species level identification. While some success has been shown in separating out species within Gerbilliscus using multivariate analyses,34,35,36 to date, we are unaware of any comprehensive treatment examining the range of inter and intraspecific variation existing throughout their distribution.
Within Gerbilliscus there are four species currently recognised in the southern African subregion, defined here as the mainland area of the African continent south of the Zambezi river and the northern border of Namibia.37 These species include the bushveld gerbil, G. leucogaster; the Cape gerbil, G. afra; the Highveld gerbil, G. brantsii and the Gorongosa gerbil, G. inclusus. Of these four species, G. afra is the only member endemic to South Africa. With a distribution extending from Nieuwoudtville in the Northern Cape, eastwards along the coast to Herold's Bay, G. afra exhibits the only distribution completely allopatric with other members of the genus.3 Whereas G. brantsii and G. leucogaster are widely distributed throughout the subregion and their distributions are sympatric with each other throughout a large part of their ranges. Finally, G. inclusus is not found within conterminous South Africa, instead being found in eastern Zimbabwe and central Mozambique south of the Zambezi river.3 Throughout its distribution G. inclusus is sympatric with G. leucogaster.
Members of Gerbilliscus utilise a wide variety of habitats including grasslands, savannas, woodlands and cultivated areas.1,3,33 In Botswana, however, their habitat preference has been said to be independent of vegetation cover, with a majority of specimens being caught on sandy soils or sandy alluvium substrate.33 While most authors have reported that members of this genus are found predominantly in sandy soils1,2,3,33 there are several exceptions. Notably, G. leucogaster has been reported on hard substrate in mopane woodlands in Botswana,1,3,33 and G. brantsii has been reported in peaty soils around marshes and pans.1,2
Southern African species of Gerbilliscus also display a wide range of environmental tolerance for variation in mean annual precipitation (MAP). Because of the unique geographic and climatic patterns of the area inhabited by G. afra, the range in MAP varies greatly throughout its distribution.38 While G. leucogaster and G. brantsii are widely distributed and sympatric throughout a large part of their respective ranges, G. brantsii has been reported to inhabit areas that receive less than 200 mm MAP.3 G. leucogaster, however, has been said to avoid areas that receive less than 250 mm MAP,1 although their presence has been reported in areas of Namibia that receive less than 100 mm MAP.3 Sympatric with G. leucogaster,G. inclusus is the most mesic adapted of the four species and confined to the north-eastern parts of the subregion in areas that receive greater than 800 mm MAP.3
We georeferenced museum specimens with the latest treatment of the vegetation of South Africa, Lesotho and Swaziland39 to better define the thermal and precipitation tolerances associated with Gerbilliscus and to propose a quantitative genus-level niche model based on known distributions. Thermal and precipitation tolerances were examined at different scales corresponding to the averages reported for the various biomes, bioregions and, when necessary, vegetation units of the area.39 The biomes, bioregions and vegetation units used here represent a three-level nested hierarchy.40,41 At the lowest level, vegetation units are defined as 'a complex of plant communities ecologically and historically (both in spatial and temporal terms) occupying habitat complexes at the landscape scale'40. Intermediate between the levels of vegetation unit and biome, bioregions are defined as 'a composite spatial terrestrial unit defined on the basis of similar biotic and physical features and processes at the regional scale'41. At the highest level, the criteria used by Rutherford et al.41 to define a biome closely follows that of Rutherford and Westfall42, but emphasis was placed on the vegetation and floristic diversity to the exclusion of faunal components. Additionally, no scale limitation was implemented by Rutherford et al.41 To evaluate if the geographic range of Gerbilliscus was evenly distributed throughout biomes, we examined the percentage distribution of localities and individuals within each biome and compared them to the relative proportion of total area for each biome within the study area. Finally, we compared the number of localities within the biomes and bioregions with the number of individual specimens to evaluate collector bias.
Materials and methods
An initial data set of 2747 records of Gerbilliscus collected within South Africa, Lesotho and Swaziland was obtained from the mammal collection catalogue of the Transvaal Museum (TM), South Africa and online records from the Smithsonian Institution, National Museum of Natural History (NMNH), Washington DC, Division of Mammals Collection Database. All records for which latitudinal and longitudinal data were not available were removed, resulting in 1881 entries. During this process all specimens with latitudinal and longitudinal data reported in a box grid system were considered too coarse for this analysis and were excluded. All specimens were then projected using geographic information system software package ArcMap 9.243 in the Hartebeesthoek94 coordinate system. The Hartebeesthoek94 coordinate system was developed to refine older South African coordinate systems and correct distortions which became apparent with the advent of GPS technologies.44 In developing this new system the WGS84 reference system was used for the recalculations, thus making the two systems essentially compatible.44 The decision to project all points into this system was made with the realisation that some of the specimens were collected prior to the introduction of the Hartebeesthoek94 coordinate system and georeferenced using older coordinate systems, such as the Cape Datum system. As a comprehensive vetting of collectors's field notes associated with specimens was beyond the scope of this project, the decision was made to standardise the coordinate system using Hartebeesthoek94 and accept any resulting error that may occur. In general, for those specimens from which latitudinal and longitudinal data were derived using the Cape Datum system, projection into the Hartebeesthoek94 coordinate system can result in errors ranging between 20 m and 90 m for the longitude and 292 m and 300 m for the latitude.44
Once all the data from both the TM and NMNH were projected, provenance and data validity was assessed. Vegetation, geopolitical and infrastructural data were obtained from electronic shapefiles provided with the latest comprehensive treatment and reclassification of the vegetation of South Africa, Lesotho and Swaziland.39 Ecological and environmental data were obtained from the accompanying text.39 All points that were found to fall outside the coastal and state boundaries of the study area were compiled and the converted latitudinal and longitudinal data were rechecked against those found in the original electronic records. After correcting any data entry errors, points still found outside the study area were then individually examined to assess discrepancies. In instances where points were found to be positioned on top of or slightly over boundary lines (usually < 200 m), minor corrections were made to their latitudes and longitudes to place them at the closest straight-line point within the boundary from their original position. All points for which provenance could not be adjusted were subsequently removed.
In the second round of data assessment, all points within the study area were first queried against the major rivers, lakes and dams. Points found within these areas were subsequently checked for data entry errors against the original electronic records. Points still falling within a major river, lake or dam were then adjusted as before, to the closest point from their original position not within an aquatic area. Next, all points for which the state or provincial placement was recorded in the original museum data were queried against the current boundaries found within base maps. Numerous specimens were collected before the redesignation of provincial boundaries and thus contained outdated provincial designations. For points found on or over the state boundaries of Lesotho and Swaziland, verification of data entry and corrections were made following the methods previously outlined. Points found on or around provincial boundaries for which records were assumed to be accurate were also verified and corrected following the methods previously outlined. In these cases, accuracy was assessed by comparing specific locality data (e.g. near town X or road Y) recorded in the original museum data with that obtained from the available infrastructural maps. All records with specific locality information that differed from what was known to be around the point locality were removed. After removing all specimens determined to have erroneous provenance, a total sample size of 1877 georeferenced individuals was obtained.
To assess genus presence within specific vegetation types, a search was run cross-referencing georeferenced specimens with the corresponding biome and bioregion for each locality. Consequently, embedded within the major biomes and bioregions are areas in which unique hydrogeological and pedological conditions exert a primary influence on floristic composition resulting in distinctive habitats.40,45 Although the nature of these influences vary by locality, processes such as waterlogging, flooding and the presence of soil types with high salinity levels can produce habitats atypical from those of the surrounding biome and bioregion. Collectively termed Azonal Vegetation,39 these areas can be differentiated into unique habitats found exclusively within an individual biome or bioregion, termed Intrazonal, or they can be found within several different biomes or bioregions, termed Azonal sensu stricto.45 We used the broad definition of Azonal Vegetation and afforded it biome-level status to indicate a unique habitat which differs from that typical of the surrounding vegetation. At a lower hierarchical level, Inland Azonal Vegetation can further be divided up into three major types, Freshwater Wetlands, Alluvial Vegetation and Inland Saline Vegetation.45 These unique subdivisions, further differentiated by water and salt contents, we afforded bioregion-level status to possibly elucidate additional factors dictating the distribution of Gerbilliscus. Hereafter, we refer to Azonal Vegetation and the rest of the biomes collectively as biome level units (BLUs). Additionally, we collectively refer to the inland subdivisions within Azonal Vegetation along with the rest of the bioregions as bioregion-level units (BRLUs).
As a result of the complexity of Azonal Vegetation, climate data for this BLU and its constituent BRLUs was derived by averaging the scores from all the respective vegetation units.45 As the Desert BLU is characterised by ecological extremes resulting from several features responsible for differences in aridity and seasonality, climate data for this area was derived by averaging the scores from the selected weather stations provided.46 Similarly, climate data for the Gariep Desert BRLU was derived by averaging scores provided by weather stations from that area.46 Because of the fragmented nature of southern African forests, climate data for the Azonal and Zonal & Intrazonal Forest BRLUs was derived by averaging all the scores from the respective vegetation units.47 Finally, as the Indian Ocean Coastal Belt (IOCB) BLU is comprised of a mosaic of zonal, intrazonal and azonal vegetation units, climate data reported here was derived from the specific vegetation units where georeferenced specimens were located.48
As the museum specimens used were collected by numerous individuals at different times, percentage locality and specimen occurrence within each BLU and BRLU was calculated and compared to assess if individual sampling intensity and methodology influenced the results, hereafter called collector bias. In instances where a lack of specimen or locality data for a specific region may result from specimens collected from that area being curated at a regional repository not sampled here, the term collection bias is used.
Results
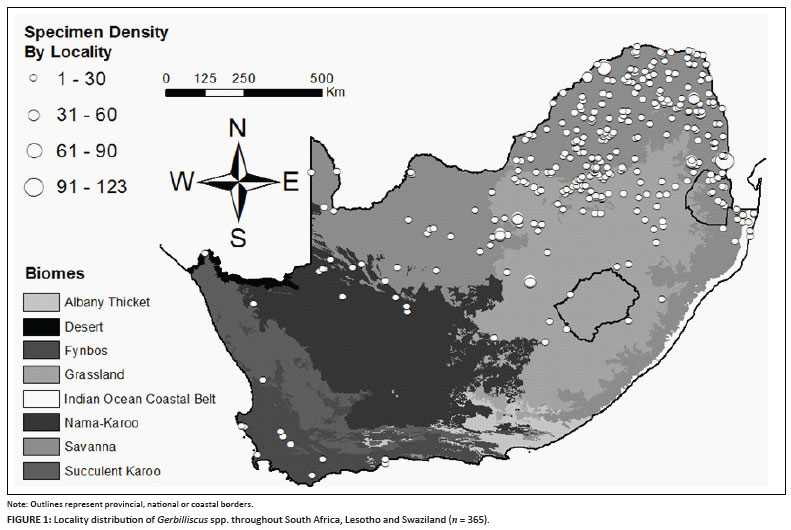
By comparing all entries with the vegetation types, it was found that the data intersected with 147 individual vegetation polygons, 41 of which were duplicate hits on the same vegetation type. In total, 365 localities containing Gerbilliscus were found in 106 individual vegetation types contained within 25 BRLUs and 9 BLUs (Figure 1). The total number and percentage of both specimen and locality occurrence within each vegetation level are reported here along with mean annual temperature (MAT) and MAP (Table 1). MAP for all localities containing Gerbilliscus ranged from 63 mm to 964 mm while MAT ranged from 13.9 ºC to 22.3 ºC. Figure 2 is a comparison of the percentage of total specimen and locality occurrence by BLU to the relative proportion of each BLU area in South Africa. In the Savanna BLU, the percentage occurrence of localities and individuals were double that of the relative proportion of its area. The percentage occurrence of localities and individuals located in the Forest BLU were almost double that of the relative proportion of its area. In the IOCB BLU, while the percentage occurrence of localities was slightly higher, the percentage occurrence of individuals was slightly lower than the relative proportion of its area. All other percentage occurrences of localities and individuals by BLU were smaller than their respective proportion by area.
Discussion
Our data largely agree with previous interpretations that Gerbilliscus is predominantly a Savanna Biome taxon. Accordingly, while this BLU represents roughly one-third of the total land area examined, around two-thirds of our specimens and localities were located within this region (Figure 2). In regards to environmental conditions, although the average MAP for this BLU was 495 mm, within it the MAP ranges from 184 mm to 708 mm between the Kalahari Duneveld and Lowveld BRLUs respectively (Table 1). This illustrates that even within the Savanna BLU there is considerable variation in precipitation regimes occupied by Gerbilliscus. When all BLUs are considered, the range of environmental tolerances for Gerbilliscus is even greater.
When the percentage of specimens within each BLU was compared to the percentage of localities, it was found that the results were largely congruent with one another for most categories (Table 1). From this we surmised that, because of the large sample size used in this analysis, the effects of collector bias are at least minimal at the scale of the BLUs. The one notable exception to this is the Desert BLU where only one specimen was found. If this datum point is removed from the analysis the lower range of MAP shifts from 63 mm to 105 mm in the Namaqualand Sandveld BRLU and the upper range for MAT shifts from 22.3 ºC to 21.1 ºC in the Maputaland Coastal Belt BRLU. When comparing the percentage locality against species occurrence at the bioregion level this trend starts to fade, possibly resulting from an increased susceptibility of lower level vegetation units to collector bias. Although not reported here, the congruence between specimens and localities is further reduced when examining individual vegetation units. (Copies of the complete species and locality occurrence by vegetation unit can be obtained from the corresponding author.)
Two BLUs where Gerbilliscus was underrepresented in comparison to the relative proportion BLU area are the Nama-Karoo and Succulent Karoo. The Nama-Karoo BLU can be characterised as a large, arid landlocked region with a predominantly sandy substrate.49 Average MAP and MAT for this area are 208 mm and 16.3 ºC, respectively, although, the range within the constituent BRLUs is variable. In the Succulent Karoo BLU, average MAP and MAT are similar to those of the Nama-Karoo at 168 mm and 16.8 ºC, respectively, although the range among its constituent BRLUs tends to be less and is more inclined towards xeric conditions.50 Additionally, the Succulent Karoo BLU has a fair number of sandy substrates, although the diversity of soil types is much greater.50 Considering previous descriptions of the habitat preferences of Gerbilliscus, it is interesting that so few localities and specimens are found in this BLU. These data, however, agree with published maps of their distribution that show a general lack of specimens from these areas.1,3
Another BLU in which Gerbilliscus appears to be underrepresented is the Fynbos. As the only endemic member of this genus, G. afra is primarily confined to this BLU, the incongruence between relative area and percentage of locality and species occurrence may be the result of collection bias. It follows that as only one of the museums from which specimen data were obtained represents a regional repository (TM), distance from this museum and the presence of closer repositories may limit the number of samples obtained. While proposed here in relation to the Fynbos BLU, the effects of this bias are certainly not limited to this region. Indeed, all areas in which a local repository is located are probably affected by this bias to some extent. Specimen data from regional repositories may therefore be necessary to further explore these discrepancies.
Finally, Gerbilliscus is found in all BLUs except that of the Albany Thicket. Located primarily along the south-eastern coast between 24º30'E and 28º00'E longitude and between 32º30'S and 34º00'S latitude, this BLU is a mosaic containing tracts of the Forest, Grassland, Savanna, Nama-Karoo, Succulent Karoo and Fynbos BLUs.51 While distributional maps vary, De Graff1 suggests that the presence of G. brantsii is possible in the northern part of this BLU. MAP and MAT for this area are well within the tolerance limits for Gerbilliscus, being 431 mm and 17.2 ºC, respectively, and therefore are probably not a mitigating factor. Instead, other factors may be responsible, such as an unpredictable rainfall regime, a dense, woody, semi-succulent and thorny vegetation or pedological factors.51 Further investigation is needed to identify what factors are promoting the lack of evidence for Gerbilliscus from this area, although a collection bias is again possible.
In developing niche models for extant taxa, it has been previously pointed out that no clear methodology has been proposed to assess and distribute niche model values across habitat classes.29 Previous works have either relied on published habitat descriptions13,28 or personal observations,23,27 thus generating unique niche model values, or have borrowed published niche model values and modified them where needed.29 Furthermore, depending on the geographic area under investigation, choice of what habitat classes to use and how these classes are defined may vary from study to study.13,23,27,28,29 Without standardised habitat classes or clearly defined conventions for assigning niche model values, results from different analyses are not directly comparable. One way to standardise the partitioning of niche model values is to quantify the percentage occurrence of modern taxa within current habitat classes using museum specimens. As pointed out by Reed29 in his analysis of micromammals from the Serengeti, however, when developing niche models it is important to not confuse a taxon's habitat indication with its habitat association. A taxon's habitat indication is the probability of a particular habitat for a given taxon while a taxon's habitat association is the probability of finding a particular taxon in a given habitat.29 As some taxa are common in one environment yet rare in others, there exists the possibility that they have not been adequately sampled throughout their distribution. This is further complicated by the influences of both collection and collector biases and may explain why our data show an absence of Gerbilliscus in the Albany Thicket BLU. With the use of large sample sizes from multiple repositories, however, the chances of detecting the full range of habitats utilised by a taxon for a study area increases. Furthermore, by comparing the number of specimens found within the various habitat classes with the number of localities in which the specimens were found, one can begin to assess the degree to which these probabilities differ. When the values for both the number of specimens and number of localities in a particular habitat are largely congruent, it may be assumed that these values approximate the actual habitat indication for a given taxon.
Although we have analysed the macrohabitat classes in which Gerbilliscus is found, some rodents may have specific microhabitat requirements that can be found embedded within a variety of different macrohabitats.13,27 Their distributions may therefore reflect the use of these microhabitats irrespective of the more inclusive broader scale habitat classes they are found in. In an analysis of the palaeoenvironment of the late middle Pleistocene site of Hoedjiespunt 1, Matthews et al.13 addressed this issue by developing both macrohabitat and microhabitat niche models for the taxa examined. Unfortunately, because of the nature of this analysis, identification of microhabitat usage was not possible. While this information may be obtainable in the field notes associated with the museum collections, a thorough vetting of these records was beyond the scope of this project.
Two final issues that must be considered when applying these data as niche models are the range of study area examined and the comparability of the habitat classes. As the habitat classes we used here only covered the countries of South Africa, Lesotho and Swaziland, we limited our analysis of the distribution of Gerbilliscus to these areas. As such, this analysis fails to capture the full range of temperatures, precipitations and habitats occupied by Gerbilliscus even within the subregion. Additionally, several of the habitat classes used here are unique to the study area and thus do not have direct correlates with other habitats found throughout Africa. While these issues must be considered when applying these data to localities outside the study area, this analysis presents quantified habitat values that can be adapted to fit alternative models. Ideally, niche models should take into account the entire realised niche for a given taxon. For Gerbilliscus this would entail georeferencing specimens throughout most of Africa and would cover a wide range of environments, all of which should be considered when reconstructing past environments unless species level characters can be identified for the remains commonly found in a palaeontological setting. Our data represent a first step in accurately assessing the entire range of environments inhabited by Gerbilliscus.
Conclusion
Using molecular markers, Chevret and Dobigny52 estimated the origin of African Gerbilliscus at about 4.81 ± 1.02 MYA. This places their emergence at approximately the same time as that of both eastern and southern African hominins. Moreover, fossils of Gerbilliscus are found in deposits containing hominin remains5,15,53 making an understanding of their environmental tolerances important. As previous palaeoenvironmental reconstructions cite the presence of Gerbilliscus as evidence for dry or unstable conditions,10,14,15,54 consisting of either savanna grasslands or savanna woodlands vegetation,5,55,56 or for the presence of a sandy substrate,13 an accurate assessment of their entire modern environmental tolerance limits is necessary. While these data largely support previous interpretations, the range of habitats in which Gerbilliscus is found varies and is not exclusive to savanna or grassland environments. Aside from the lack of evidence for Gerbilliscus in the Albany Thicket BLU and underrepresentation in the Nama-Karoo, Succulent Karoo and Fynbos BLUs, the distribution of Gerbilliscus is broad and encompasses a wide range of thermal and precipitation regimes. Furthermore, their underrepresentation in xeric areas characterised by sandy substrates suggests that these two criteria may not be limiting factors influencing the distribution of Gerbilliscus. Alternatively, these conditions may be associated with other factors such as dietary preference, seasonality of climate, or biotic interactions that dictate the habitat specificity of Gerbilliscus. An analysis of species level distributions could clarify some of these issues. However, as species level identification is not currently possible with most palaeontological specimens, the use of specific level environmental parameters in palaeoenvironmental reconstructions is not recommended. Instead, in order to avoid distorted signatures, it is more conservative to incorporate the total range of environmental tolerances known for this genus into palaeoenvironmental reconstructions.
Acknowledgements
We thank the staff of the Transvaal Museum for access to their databases and all their help: Teresa Kearney, Curator of Mammals; Stephany Potze, Curator of Palaeontology and Tersia Perregil, Information Specialist, and the faculty and staff in the Department of Biological Sciences and the College of Arts and Science at Sam Houston State University. We would also like to acknowledge our second data source: the Smithsonian Institution, National Museum of Natural History, Division of Mammals Collection Database. This database was accessed on 14 July 2009 (http://collections.nmnh.si.edu/vzmammals/pages/nmnh/vz/DtlQueryMammals.php). Finally, we are grateful to three anonymous reviewers for their helpful comments and insightful critiques which greatly improved the quality of this manuscript. This research was funded in part by a Sigma Xi Grants-in-Aid of Research and a Paleontological Society, Lane Student Research Award (TLC).
References
1. De Graaff G. The rodents of southern Africa. Durban: Butterworth & Co.; 1981. [ Links ]
2. Roberts A. The mammals of South Africa. Johannesburg: Trustees of the Mammals of South Africa Book Fund; 1951. [ Links ]
3. Skinner JD, Chimimba CT. The mammals of the southern African subregion. 3rd ed. Cape Town: Cambridge University Press; 2005. [ Links ]
4. Avery DM. Southern savannas and Pleistocene hominid adaptations: The micromammalian perspective. In: Vrba ES, Denton GH, Partridge TC, Burckle LH, editors. Palaeoclimate and evolution with emphasis on human origins. New Haven: Yale University Press, 1995; p. 459-478. [ Links ]
5. Avery DM. The Plio-Pleistocene vegetation and climate of Sterkfontein and Swartkrans, South Africa, based on micromammals. J Hum Evol. 2001;41:113-132. [ Links ]
6. Legendre S, Montuire S, Maridet O, Escarguel G. Rodents and climate: A new model for estimating past temperatures. Earth Planet Sci Lett. 2005;235:408-420. [ Links ]
7. Montuire S, Maridet O, Legendre S. Late Miocene-Early Pliocene temperature estimates in Europe using rodents. Palaeogeogr Palaeoclimatol Palaeoecol. 2006;238:247-262. [ Links ]
8. Thackeray JF. Quaternary environmental changes inferred from small mammalian fauna, southern Africa. Clim Change. 1987;10:285-305. [ Links ]
9. Thackeray JF, Avery DM. A comparison between temperature indices from Late Pleistocene sequences at Klasies River Mouth and Border Cave, South Africa. In: Heine K, editor. Palaeoecology of Africa and the Surrounding Islands, vol. 21. Rotterdam: AA Balkema, 1990; p. 311-315. [ Links ]
10. Avery DM. Last interglacial and Holocene altithermal environments in South Africa and Namibia: Micromammalian evidence. Palaeogeogr Palaeoclimatol Palaeoecol. 1993;101:221-228. [ Links ]
11. Avery DM. Late Quaternary environmental change at Mumbwa Caves, Zambia. J Afr Zool. 1996;110:221-234. [ Links ]
12. Avery DM. Early and Middle Pleistocene environments and hominid biogeography; micromammalian evidence from Kabwe, Twin Rivers and Mumbwa Caves in central Zambia. Palaeogeogr Palaeoclimatol Palaeoecol. 2003;189:55-69. [ Links ]
13. Matthews T, Denys C, Parkington JE. The palaeoecology of the micromammals from the Late Middle Pleistocene site of Hoedjiespunt 1 (Cape Province, South Africa). J Hum Evol. 2005;49:432-451. [ Links ]
14. Patnaik R. Reconstruction of Upper Siwalik palaeoecology and palaeoclimatology using microfossil palaeocommunities. Palaeogeogr Palaeoclimatol Palaeoecol. 2003;197:133-150. [ Links ]
15. Wesselman HB. The Omo micromammals: Systematics and palaeoecology of early man sites from Ethiopia. Contributions to Vertebrate Evolution. 1984;7:1-219. [ Links ]
16. Wesselman HB. Of mice and almost-men: Regional palaeoecology and human evolution in the Turkana Basin. In: Vrba ES, Denton GH, Partridge TC, Burckle LH, editors. Palaeoclimate and evolution with emphasis on human origins. New Haven: Yale University Press, 1995; p. 356-368. [ Links ]
17. Wesselman HB, Black MT, Asnake M. Small mammals. In: Haile-Selassie Y, WoldeGabriel G, editors. Ardipithecus kadabba: Late Miocene evidence from the Middle Awash, Ethiopia. Berkeley: University of California Press, 2009; p. 105-133. [ Links ]
18. Winkler AJ. Neogene palaeobiogeography and east African palaeoenviroments: Contributions from the Tugen Hills rodents and lagomorphs. J Hum Evol. 2002;42:237-256. [ Links ]
19. Hutchinson GE. Concluding remarks. Cold Spring Harbor Symposium on Quaternary Biology. 1957;22:415-427. [ Links ]
20. Lomolino MV, Riddle BR, Brown JH. Biogeography. 3rd ed. Sunderland: Sinauer; 2006. [ Links ]
21. Denys C. Rodent faunal lists in karstic and open-air sites of Africa: An attempt to evaluate predation and fossil biases on palaeodiversity. Cuadernos de Geologia Iberica. 1997;23:73-94. [ Links ]
22. Denys C. Of mice and men: Evolution in east and south Africa during Plio-Pleistocene times. In: Bromage TG, Schrenk F, editors. African biogeography, climate change, and human evolution. New York: Oxford University Press, 1999; p. 216-226. [ Links ]
23. Fernandez-Jalvo Y, Denys C, Andrews P, Williams T, Dauphin Y, Humphrey L. Taphonomy and palaeoecology of Olduvai Bed-I (Pleistocene, Tanzania). J Hum Evol. 1998;34:137-172. [ Links ]
24. Jaeger JJ. Les rongeurs (Mammalia, Rodentia) du Pleistocene inferieur d'Olduvai Bed I (Tanzanie) 1ere Partie: Les Murides. In: Savage RJG, Coryndon SC, editors. Fossil vertebrates of Africa. Vol. 4. London: Academic Press, 1976; p. 58-120. [ Links ]
25. Matthews T, Denys C, Parkington JE. Community evolution of Neogene micromammals from Langebaanweg 'E' Quarry and other west coast fossil sites, south-western Cape, South Africa. Palaeogeogr Palaeoclimatol Palaeoecol. 2007;245:332-352. [ Links ]
26. Avery DM. Micromammals as palaeoenvironmental indicators and an interpretation of the late Quaternary in the Southern Cape Province, South Africa. Ann S Afr Mus. 1982;85:183-374. [ Links ]
27. Andrews P. Owls, caves and fossils. Chicago: University of Chicago Press; 1990. [ Links ]
28. Evans EMN, Van Couvering JAH, Andrews P. Palaeoecology of Miocene sites in western Kenya. J Hum Evol. 1981;10:99-116. [ Links ]
29. Reed DN. Serengeti micromammals and their implications for Olduvai palaeoenvironments. In: Bobe R, Alemseged Z, Behrensmeyer AK, editors. Hominin environments in the east African Pliocene: An assessment of the faunal evidence. Dordrecht: Springer, 2007; p. 217-255. [ Links ]
30. Davis DHS. The affinities of the South African gerbils of the genus Tatera. Proc Zool Soc London. 1949;118:1002-1018. [ Links ]
31. Davis DHS. Contribution to the revision of the genus Tatera in Africa. Ann Mus Roy Afr Centr Zool. 1966;144:49-65. [ Links ]
32. Davis DHS. Part 6.4, Genera Tatera and Gerbillurus. In: Meester J, Setzer HW, editors. The mammals of Africa: An identification manual. Smithsonian Washington: Institution Press; 1975. [ Links ]
33. Smithers RHN. The mammals of Botswana. Mem Natn Mus Rhod. 1971;4:1-340. [ Links ]
34. Crawford-Cabral J. A craniometric study of Angolan gerbils of the subgenus Tatera (Mammalia, Rodentia, Gerbillidae). Part I: Results from a principal components analysis. Zool Abh. 1988;43:169-192. [ Links ]
35. Crawford-Cabral J, Pacheco AP. A craniometric study of Angolan gerbils of the subgenus Tatera (Mammalia, Rodentia, Gerbillidae). Part II: Results from discriminant and cluster analyses. Zool Abh. 1991;46:215-224. [ Links ]
36. Granjon L. Morphological and morphometrical analyses of three cryptic species of Tatera Lataste, 1882 (Rodentia: Muridae) from West Africa. Belg J Zool. 2005;135(supplement):97-102. [ Links ]
37. Wilson DE, Reeder DM, editors. Mammal species of the world. A taxonomic and geographic reference. 3rd ed. Baltimore: Johns Hopkins University Press; 2005. [ Links ]
38. Rebelo AG, Boucher C, Helme N, Mucina L, Rutherford MC. Fynbos biome. In: Mucina L, Rutherford MC, editors. The vegetation of South Africa, Lesotho and Swaziland. Strelitzia. 2006;19:53-219. [ Links ]
39. Mucina L, Rutherford MC, editors. The vegetation of South Africa, Lesotho and Swaziland. Strelitzia vol. 19. Pretoria: South African National Biodiversity Institute; 2006. [ Links ]
40. Mucina L, Rutherford MC, Powrie LW. The logic of the map: Approaches and procedures. In: Mucina L, Rutherford MC, editors. The vegetation of South Africa, Lesotho and Swaziland. Strelitzia vol. 19. Pretoria: South African National Biodiversity Institute; 2006. [ Links ]
41. Rutherford MC, Mucina L, Powrie LW. Biomes and bioregions of southern Africa. In: Mucina L, Rutherford MC, editors. The vegetation of South Africa, Lesotho and Swaziland. Strelitzia vol. 19. Pretoria: South African National Biodiversity Institute; 2006. [ Links ]
42. Rutherford MC, Westfall RH. Biomes of southern Africa: An objective categorization. 2nd ed. In: Leistner OA, Momberg BA, du Plessis E, editors. Memoirs of the botanical survey of South Africa no. 63. Pretoria: National Botanical Institute; 1994. [ Links ]
43. ArcMap [computer program]. Version 9.2. Redlands: ESRI Inc.; 2006. [ Links ]
44. Wonnacott RT. The implementation of the Hartebeesthoek94 coordinate system in South Africa. Survey Review. 1999;35:243-250. [ Links ]
45. Mucina L, Rutherford MC, Powrie LW. Inland azonal vegetation. In: Mucina L, Rutherford MC, editors. The vegetation of South Africa, Lesotho and Swaziland. Strelitzia vol. 19. Pretoria: South African National Biodiversity Institute; 2006. [ Links ]
46. Jurgens N. Desert biome. In: Mucina L, Rutherford MC, editors. The vegetation of South Africa, Lesotho and Swaziland. Strelitzia vol. 19. Pretoria: South African National Biodiversity Institute; 2006. [ Links ]
47. Mucina L, Geldenhuys CJ. Afrotemperate, subtropical and azonal forests. In: Mucina L, Rutherford MC, editors. The vegetation of South Africa, Lesotho and Swaziland. Strelitzia vol. 19. Pretoria: South African National Biodiversity Institute; 2006. [ Links ]
48. Mucina L, Scott-Shaw CR, Rutherford MC, et al. Indian Ocean Coastal Belt. In: Mucina L, Rutherford MC, editors. The vegetation of South Africa, Lesotho and Swaziland. Strelitzia vol. 19. Pretoria: South African National Biodiversity Institute; 2006. [ Links ]
49. Mucina L, Rutherford MC, Palmer AR, et al. Nama-Karoo Biome. In: Mucina L, Rutherford MC, editors. The vegetation of South Africa, Lesotho and Swaziland. Strelitzia vol. 19. Pretoria: South African National Biodiversity Institute; 2006. [ Links ]
50. Mucina L, Jurgens N, le Roux A, et al. Succulent Karoo Biome. In: Mucina L, Rutherford MC, editors. The vegetation of South Africa, Lesotho and Swaziland. Strelitzia vol. 19. Pretoria: South African National Biodiversity Institute; 2006. [ Links ]
51. Hoare DB, Mucina L, Rutherford MC, et al. Albany Thicket Biome. In: Mucina L, Rutherford MC, editors. The vegetation of South Africa, Lesotho and Swaziland. Strelitzia vol. 19. Pretoria: South African National Biodiversity Institute; 2006. [ Links ]
52. Chevret P, Dobigny G. Systematics and evolution of the subfamily Gerbillinae (Mammalia, Rodentia, Muridae). Mol Phylogenet Evol. 2005;35:674-688. [ Links ]
53. De Graaff G. A preliminary investigation of the mammalian microfauna in Pleistocene deposits of caves in the Transvaal System. Palaeont Afr. 1960;7:59-118. [ Links ]
54. Robbins LH, Murphy ML, Stevens NJ, et al. Palaeoenvironment and archaeology of Drotsky's Cave: Western Kalahari Desert, Botswana. J Archaeol Sci. 1996;23:7-22. [ Links ]
55. Avery DM. Holocene micromammalian faunas from the northern Cape Province, South Africa. S Afr J Sci. 1981;81:265-273. [ Links ]
56. Avery DM. The micromammalian fauna from Border Cave, Kwazulu, South Africa. J Archaeol Sci. 1982;9:187-204. [ Links ]
 Correspondence to:
Timothy Campbell
Postal address: Department of Anthropology
4352 TAMU, College Station
TX 77843-4352, United States
email: anthro_campbell@tamu.edu
Received: 03 Dec. 2009
Accepted: 19 Nov. 2010
Published: 28 Jan 2011

