


Servicios Personalizados
Articulo
 Inglés (pdf)
 Articulo en XML
 Referencias del artículo
Indicadores

Links relacionados
-
 Citado por Google
 -
 Similares en Google
Compartir

 Permalink
South African Journal of Science
versión On-line ISSN 1996-7489
versión impresa ISSN 0038-2353
S. Afr. j. sci. vol.107 no.1-2 Pretoria ene./feb. 2011
http://dx.doi.org/10.4102/sajs.v107i1/2.406
RESEARCH ARTICLES
A bibliometric analysis of South Africa's scientific outputs - some trends and implications
Michael Kahn
Centre for Research on Science and Technology, Stellenbosch University, South Africa
ABSTRACT
The paper examines the change in volume of South African publications as indexed to the Web of Science over the periods 1990-1994 and 2004-2008. It was noted that publication volumes have increased sharply even while the stock of researchers has remained static. A number of factors may account for the rise including the increase in the Department of Education publication subsidy, the increase in the number of South African journals indexed to the Web of Science and a shift in focus to fields with higher publication propensity. For example, it was noted that a new growth area has emerged in the field of infectious diseases. The publication count by author institution showed that collaboration with foreign authors has increased considerably across the two periods and it is suggested that it is this factor that best accounts for the rise in volume. The concentration by subject area permitted some judgement to be made regarding the prospects for the five grand challenges of the Ten Year Innovation Plan. Lastly, it was noted that if it is collaboration that is driving the volume increase, the system is vulnerable to offshore changes.
Introduction
From 1994 to 2008, government engaged in the extensive development of science and innovation policy with the goal of re-orienting science and technology toward the goals of redress, improved quality of life, job creation and economic competitiveness. The 1996 White Paper on Science and Technology1 launched this process and introduced the concept of the national system of innovation in which the three main actors - higher education, government and business - were understood to work together in a mutually reinforcing manner to generate new knowledge, produce new generations of the highly skilled, and new products, processes and services. I used elementary bibliometrics to seek and describe the extent to which scientific activity has shifted over this time. Bibliometrics is an inexact science that seeks patterns in scientific and technological literature. Though much criticised,2,3 the Thomson Reuters Web of Science4 remains the database of choice for such bibliometric analysis, particularly as it allows for relatively straightforward queries. An unresolved problem is that both the Web of Science and the rival Scopus database do not do justice to the outputs of the Social Sciences and Humanities because they neglect to include books and other forms of communication.5 The advent of Google Scholar has changed this situation because it captures full-text versions, including books and chapters in books. While Google Scholar can provide an indication of citations it is not yet regarded as transparent and reliable enough for analytical purposes. The real competition is between the Web of Science and Scopus.
Compiling bibliometric databases is fraught with difficulties: categorisation of journals by field, attribution of fractional shares by authorship, frequent errors in addresses or even naming of authors, the instant of capture and dissemination on databases, the effect of journal death or absorption and so on. The compilation is arduous and labour intensive. In South Africa the CREST SA Knowledgebase at Stellenbosch University is unique among such databases in capturing demographic data on the authors.
This paper starts with the observation that South Africa's scientific output was lamentably constant from the mid-1980s through to about 2004, after which it showed a steep upward climb. One task of the paper is to seek reasons for this change. Accordingly, it presents the bibliometric analysis of the publication record from two perspectives: publication counts by subject area and publication counts by institution. This is the simplest possible analysis with no use being made of normalised citation rates. This is followed by a section on interpretation, and then analysis of the drivers of change of scientific production and the implications for policy.
The publication record
In order to average out year-on-year perturbations, scientific publications are examined for two five-year periods: 1990-1994 immediately prior to the onset of democracy, and 2004-2008, some fifteen years into the transition.
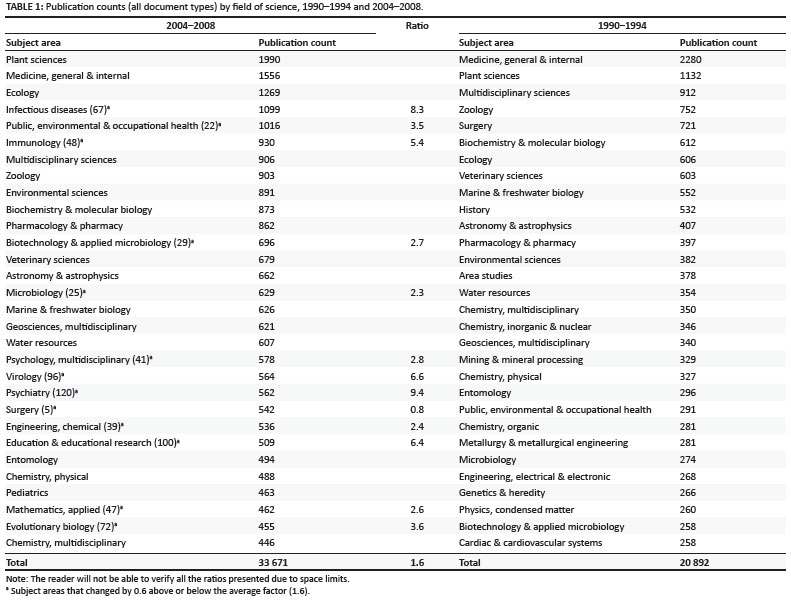
The publication counts in Tables 1 and 2 are drawn from the Thomson Reuters Web of Science according to its predefined subject areas. Table 1 displays all document types indexed to the Science Citation Index (SCI), Social Science Citation Index (SSCI), and Arts and Humanities Citation Index (AH&CI) combined, including peer-reviewed journal articles, letters, reviews and conference proceedings among others, rather than the narrower selection of journal articles. It is noted that counting all document types may favour the health sciences6 that use a wider range of channels to communicate among peers than is common in the natural sciences and engineering. Another restriction arises from the classification into subject areas and sub-disciplines that is imposed by the design of the Web of Science database. If one later combines counts for sub-disciplines (e.g. to obtain a grand total for the area of chemistry) there is a risk of multiple counting.
Table 1 presents publication counts for the top 30 subject areas for each period and allows comparison of changes in rank and volume. The third column displays the relative increase in a subject area whose count shifted by more than 10 places. The total number of publications rose by a factor of 1.6 across the period and subject areas that changed by 0.6 above or below this level are indicated. It is clear that the two top subject areas of 1990-1994 remain the top two of 2004-2008. Plant sciences and Medicine, general and internal, remain a country strength. This is consistent with Albuquerque's7 1981-2001 study in which he computed the Scientific Revealed Comparative Advantage (SRCA) of scientific publications for Brazil, India, Mexico and South Africa. SRCA for a subject area is the ratio of the country contribution to the world total in that area. Accepting that concentration is not the same as quality (conventionally measured by frequency of citations) the fields with SRCA values greater than 2.0 represent core strengths of the research system. This identification is supported in the 2007 citation analysis of Pouris.8 As the Academy of Science of South Africa also notes,9 '... health-related research has been responsible since the 1960s for the largest single contribution from South African addresses in the indexed Thomson Reuters ISI system.' Top rank notwithstanding, there is a red flag: the count for Medicine, general and internal declined by a factor of 0.8 and its SRCA fell from 5.0 to 2.3 from 1981 to 2001. Surgery, the fifth most prolific area in 1990-1994, declined by 0.8. Cardiac and cardiovascular systems fell from a rank of 30 to 48.
Albuquerque7 also identified South African robustness in Veterinary science (a steady SRCA from 1981 to 2001), Marine and freshwater biology (SRCA > 2.0), and Chemistry, inorganic and nuclear (SRCA < 2.0 in 2001). These show small growth in counts by a factor of 1.3.
By contrast, there were sharp growths in the counts for Infectious diseases (ratio 8.3), Virology (6.6), Immunology (5.4), Public and environmental health (3.5) - what may be termed the 'infectious disease cluster', as well as Evolutionary biology (3.6), Microbiology (2.3), Biotechnology and applied microbiology (2.7), and Environmental sciences (2.3). Education and educational research is a newcomer at rank 24, having risen by a factor of 6.4 and is joined by outliers Psychiatry (9.4) and Psychology, multidisciplinary (2.8). Last are Mathematics, applied (2.6) and Engineering, chemical (2.4).
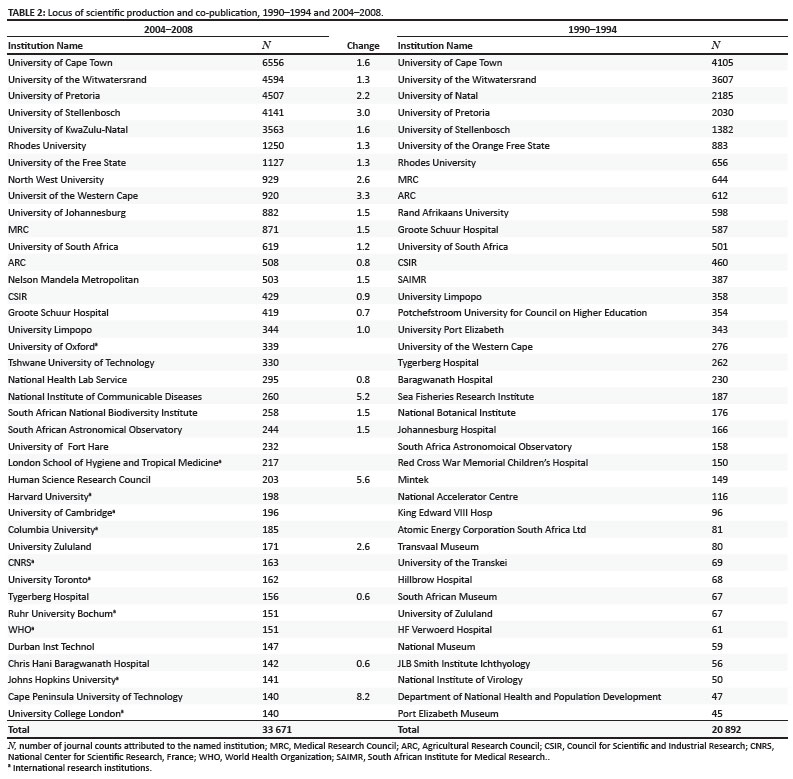
Table 2 presents publication counts by author institution. In other words, it depicts the existence of co-publication. This data set is not adjusted for fractional counts, so adding the individual institution counts gives a higher total than the number of publications involving the joint authors.
Making comparisons across the two time periods is complicated by a number of factors including name changes and termination or reorganisation of organisations and their subsidiaries, not to mention the emergence of large multisite projects involving many institutions and researchers. A first observation from Table 2 is the evident dominance of the universities in scientific publication, compared with the state and private sectors. Second is the continued hegemony of the 'big five' research universities, namely the Universities of Cape Town, the Witwatersrand, Pretoria, KwaZulu-Natal and Stellenbosch University, whose share of counts (multiple counting notwithstanding) rose from 57% to 69% of the total. The third observation, that almost contradicts the previous observation, is the much stronger openness of the science system as revealed by the presence among the top 30 institutions for 2004-2008 of major international research performers such as Oxford, Cambridge, Harvard and Columbia Universities and the London School of Tropical Medicine and Hygiene. In 1990-1994 the first foreign institution (the University of Texas) appeared at rank 41 and was present in 0.2% of all publications; Oxford is now involved in 1% of all publications. These findings are almost unchanged if one searches for 'journal article' counts only.
To obtain finer insight into the changes across the two periods it is necessary to set some useful minimum contribution level. I set this lower limit to include institutions that account for 0.05% or more of the total publication count. For 1990-1994, this lower limit excludes 11 publications, whereas for 2004-2008 it excludes 18 publications. The underlying data of Table 2 then reveals the following: for 1990-1994 this level involved 210 institutions with the first foreign contributors at ranks 41 to 43 out of a total of 94 foreign contributors that accounted for 1715 publications. In 2004-2008 the 0.05% level included 500 institutions of which 378 were foreign, the first two - Oxford University and the London School of Tropical Medicine and Hygiene - appearing at ranks 17 and 20, respectively. The total foreign institution publication count rose to 17 845. Crudely speaking, without correcting for fractional counts, the number of what might be termed major foreign collaborating institutions increased nearly four-fold and co-publication events nearly ten-fold. A fourth finding is that the same data cut for the academic and provincial hospitals shows a reduction in research sites from 28 to 18 and in publications from 1992 counts to 1381 with Groote Schuur Hospital falling from 597 publications to 419 and Tygerberg Hospital from 262 to 156. The fifth observation is the decline in output from the scientific sections of the major state museums: from 301 down to 254, with the South African Museum falling from 67 publications to 41. A sixth observation is that the six 'largest' industry research performers of 1990-1994 that produced 97 publications have completely disappeared. The research activities of the Chamber of Mines, for example, moved to the CSIR. New industry players produced 275 publications from 2004 to 2008, of which Sasol accounted for 198, the Sugar Cane Research Institute for 53 and Aurum Health the balance of 24. The seventh finding is the modest rise in output from science council and department-based research institutes: 3415 to 4099 across the same period. It is important to reiterate that the comparison is being made down to the 0.05% share of contribution. If the entire database were to be searched down to a single publication the number of performers would obviously increase but this does not change the locus of major scientific activity.
Interpretation
Before seeking the underlying reasons for the above findings, information on the stock of researchers (Table 3) is presented.

This data, drawn from the methodologically comparable 1991/92 and 2006/07 Survey on Research and Experimental Development shows that the state (government and science councils) and higher education sectors have seen limited growth in the number of full-time equivalent (FTE) researchers, from 6059 to 6426. One notes the near doubling of the FTEs for the business sector, but must recall that business is a small contributor to the volume of scientific publications. One also notes the steep rise in the FTEs for PhD students, but should recognise that PhD students are often part-time and are more likely to publish toward the end of their studies. The appropriate indicator to consider as a factor in publication output might be the number of PhD graduates rather than those enrolled. The number of PhD graduates rose from 684 in 1993 to 1100 in 2006.
The above numbers pose the central question for the paper: despite the fact that the core researcher workforce in higher education and government has remained static the publication count rose by close to 13 000 units. What might explain this?
One possibility arises from the 2003 re-engineering of the then Department of Education funding formula so that today the value of a publication unit has risen four-fold to about R108 000. This makes scientific publication an important component of general university funding,12 so much so that a number of universities are using publication as a 'carrot and stick' incentive for their staff: 'publish or (you and the university will) perish'.
A second increase in publication counts may arise from Thomson Reuters' review of the journal offerings of many emerging and developing countries that from 2005 to 2010 saw the number of South African journals indexed to the Web of Science rise from 26 to 66 - an increase equally split between the Natural Sciences and Engineering, and Social Sciences and Humanities. This country is not alone in gaining such recognition, for that is what it implies: indexed Brazilian journals rose in number from 26 to 331 over the same period (Purnell P 2010, personal communication, April 17). If there are more journals being indexed then the number of publications abstracted should also increase.
Two other policy-led perturbations affect the state of science in the science councils and department-based research institutions and museums. One is the promotion of an Essential National Health Research policy that has seen a reduction in research funding in the academic teaching and provincial hospitals.13 Another is the loss of the older generation of researchers from the science councils and department-based research institutes and their replacement with early-career black researchers.14 This impact on publication volume is unquantified but is likely to be downward. The decline in outputs from the academic teaching hospitals has been already noted above.
In brief, there are greater rewards for publishing; there is a shift toward health science fields with high publication rates, there are more South African journals indexed by the Web of Science in which to publish, there may be more PhD students available to assist with research and the system is more open for co-publication with foreign parties (mainly in the Northern hemisphere).
Of these factors the last stands out for its size and simplicity: over the period co-publication with foreign universities and other research institutes rose by close to 11 200 counts, multiple counting excluded.
A simple index of co-publication is obtained as the ratio of institution counts (uncorrected for fractional counts) to the total number of publications. In 1990 this stood at 1.46, in 1994 at 1.54, in 2004 at 2.14 and in 2008 at 2.29, implying a steady increase in co-publication within organisations, local and foreign. The increase in co-publication may reflect shifts toward fields where co-publication is more common than, for example, in health sciences and high-energy physics. In the latter case it is not unusual for a single paper to involve a score of institutions and even a hundred authors. Further analysis (Table 4) shows that co-publication with four of the most prolific foreign collaborating institutions - Oxford, Harvard and Columbia Universities and the London School of Tropical Medicine - is canted toward the infectious diseases cluster with a total of 1000 co-publications out of a total of 3500 with these institutions.
Moreover, there may well be both push and pull influences at work: the concentration of foreign expertise is in fields of local expertise and there are problems of common interest, hence the collaboration. Noteworthy too is the sheer scale of scientific output at the leading research universities over the 2004 to 2008 period: Oxford and Cambridge Universities each produce the same volume of output as all South African publications, while Harvard's is twice as large. As the Academy of Science of South Africa's study on clinical research observes15: 'Since the average citation rates per article in clinical medicine exceed those of the principal emerging nations of the South ... the quality of South African papers according to this criterion has been higher and the quantity lower in a comparison with developing nations. In this sense, South Africa has performed like a small developed country'.
Another way of demonstrating the effect of foreign collaboration on the volume of publication is provided by the National Science Foundation16 with its information on country article production adjusted for fractional counts. For South Africa the fractional article count of SCI and SSCI articles increased from 2351 (1995) to 2805 (2007), a factor of 1.2. The uncorrected article count rose by a factor of 1.6. This strengthens the hypothesis that the strongest factor driving the publication increase is collaboration rather than any one of the other drivers. As to chasing the journal subsidy payment, the fact is that the subsidy discourages international collaboration because the more extramural parties involved in a publication with a national university, the lower the amount that goes to the university.17
Further detailed and painstaking examination of the individual publications will be needed to confirm the hypothesis that foreign collaboration is mainly responsible for the rise in volume.
Implications for policy
The Ten Year Innovation Plan set targets18 for two indicators that are central to scientific production: South Africa's global share of research outputs (0.5% in 2002) should reach 1% and the number of full-time equivalent researchers (11 439 in 2005) should rise to 20 000 in 2018. For the first target we turn to King19 who compiled data on world journal production over the five-year periods 1993-1997 and 1997-2001. His data suggest world publication growth of 10% through consecutive five-year periods. By contrast, the South African trend across those periods was downward from 0.52% of the world total (17 461 publications) to 0.5% (18 123). Indeed the National Science Foundation data show that South Africa's world share corrected for fractional counts declined from 0.416% in 1995 to 0.369% in 2007.
Both estimates are cause for concern because the upward shift for publications noted in Tables 1 and 2 may not be sustainable. It has been shown that the core of foreign collaboration lies in the health sciences with their tendency for high individual publication rates.
What effect will the target of 20 000 FTE researchers by 2018 have on publication volume? In 2007/08 there were 12 993 FTE researchers against the 2004/05 level of 11 080, implying an annual growth of 5%. At this rate the FTEs could be close to the proposed 20 000 by 2018. But there is no linear relationship between the number of FTE researchers and publications. In 2004 the 11 080 FTE researchers produced 5446 publications; by 2008, publications stood at 8519, representing an average annual rate of increase of 10%. If the main driver of this rise was exogenous to the system, then one cannot state with confidence what the level of publication would be in 2018.
Where does this leave the science base of the Ten Year Innovation Plan grand challenges? The 'Farmer to Pharma' grand challenge demands a strong science underpinning that, among other areas, resides in Plant Sciences, and the rise in Pharmacology and Pharmacy. There is evidence of robustness on the 'Farmer' end of the chain as the country remains in the world's top ten of countries registering plant varieties.20
Space Science and Technology will require skills in electronic and software engineering, materials science, computer science, astronomy and astrophysics, and signal processing, as well as combustion engineering, aerodynamics and chemistry, if a launch vehicle is to be designed, constructed and fired. Of scientific fields related to this quest only Astronomy and Astrophysics is in the top 30 and even then its volume increase is far from stellar. Much of the underlying technology platform for this grand challenge must rest on the accumulated technological learning in the Defence/Aerospace industries that still account for some 7% of gross expenditure on research and development (R&D).21 This industrial R&D does not manifest in the top levels of the publication record and is performed by Denel, Saab-Grintek, Reutech, Zeiss-Eloptro, Tellumat and others. The concern must be whether a human resources pipeline is in place to maintain and strengthen the associated science base.
Similar concerns underpin the energy grand challenge with its goals for fuel cell technologies and other renewable sources: this despite the stasis in the chemical sciences. A key question here would be whether Sasol with its research expertise in platinum group catalysis might seek to enter these fields. While the overall level of publications in the chemical sciences is static the science expertise of Sasol is quite unprecedented among South Africa's industrial players. Even in the heyday of the Chamber of Mines Research Organization, their publication count was a fraction of Sasol's present levels.
As to the climate change grand challenge, this by its very nature is multidisciplinary, cutting across Ecology, Environmental Science, Zoology, Marine and Freshwater Biology, Computer Science, Applied Mathematics, and the other grand challenges. It is difficult therefore to be precise as to the latent strength in the science system that would allow for the realisation of the associated highly qualitative goals set out in the Plan. The same holds for the attainment of the goals for Human and Social Dynamics.
To summarise: Tables 1 and 2 show that the count of publications rose by 60%; that the universities remain the dominant locus of scientific publication; that co-publication involves many more foreign partners, is more intense and has risen more than ten-fold; and that a new research focus on infectious diseases and public health has emerged.
For South Africa to maintain its world share of scientific publications, let alone increase it, will require considerable investment in the production, attraction and retention of researchers. At present the forward-looking Department of Science and Technology South African Research Chairs Initiative22 is the main thrust, and there are signs that this is slowing because of financial constraints. There is no coherent policy across government that drives the mission of high-level human resources development. Instead this quest is bedevilled by racial politics.
The evidence presented in this paper suggests that the rise in publication volumes in the last five years is associated with the strengthening of research with foreign partners. In and of itself that is excellent, but it does render South Africa vulnerable should those partnerships weaken. There is no substitute for building the home base.
References
1. White Paper on Science and Technology. Pretoria: Department of Arts, Culture, Science and Technology; 1996. [ Links ]
2. Archambault E, Vignola-Gagne E, Cote G, et al. Benchmarking scientific output in the social sciences and humanities: The limits of existing databases. Scientometrics. 2006;68(3):329-342. [ Links ]
3. De Bellis N. Bibliometrics and citation analysis. Lanham: The Scarecrow Press Inc.; 2009. [ Links ]
4. Thomson Reuters. Web of Science [homepage on the Internet]. 2010 [cited 2010 Dec 22] Available from http://thomsonreuters.com/products_services/science/science_products/a-z/web_of_science [ Links ]
5. Towards a bibliometric database for the Social Sciences and Humanities. A European Scoping Project. A report produced for DFG, ESRC, AHRC, NWO, ANR and ESF. Strasbourg: European Science Foundation; 2010. [ Links ]
6. De Bellis N. Bibliometrics and citation analysis. Lanham: The Scarecrow Press Inc., 2009; p. 161. [ Links ]
7. Albuquerque E. Immature systems of innovation: Introductory notes about a comparison between South Africa, India, Mexico and Brazil based on science and technology statistics. Discussion paper No. 221. Belo Hirozonte: CEDEPLAR/FACE/IFMG.ASGI-SA; 2003. [ Links ]
8. Pouris A. The international performance of South African academic institutions; a citation assessment. Higher Education. 2006;54(4):501-509. [ Links ]
9. Academy of Science of South Africa (ASSAf). Consensus report on revitalising clinical research in South Africa. Pretoria: ASSAf, 2009; p. 125. [ Links ]
10. Resources for R&D in the Republic of South Africa 1991/92. Results of Survey Programme no 17. Pretoria: Department of National Education; 1993. [ Links ]
11. Human Sciences Research Council. South African National Survey of Research and Experimental Development 2007/08 [homepage on the Internet]. No date [cited 2010 Dec 22]. Available from: http://www.hsrc.ac.za/index.php?module=rnddoc&func=login_register&file_id=104 [ Links ]
12. Mouton J, Weingart P. R&D evaluation. Workshop presented at: INORMS 2010 Conference; 2010 April 12-16; Cape Town, South Africa. [ Links ]
13. Academy of Science of South Africa (ASSAf). Consensus report on revitalising clinical research in South Africa. Pretoria: ASSAf, 2009; p. 147. [ Links ]
14. Kahn MJ. Report on knowledge and innovation for the World Bank-Department of Education Multi-sector Analysis project. Pretoria: World Bank; 2009. [ Links ]
15. Academy of Science of South Africa (ASSAf). Consensus report on revitalising clinical research in South Africa. Pretoria: ASSAf, 2009; p. 126. [ Links ]
16. Science and engineering indicators. Washington: National Science Board; 2010. [ Links ]
17. Policy and development support communiqué. Vol. 1 No. 2, April 2009. Policy and procedures for the measurement of research output of public higher education institutions. Pretoria: Department of Education; 2010. [ Links ]
18. Innovation plan: Toward the knowledge economy. Pretoria: Department of Science and Technology, 2008; p. 8. [ Links ]
19. King DA. The scientific impact of nations: What different countries get for their research spending. Nature. 2004;430:311-316. [ Links ]
20. Plant variety protection statistics for the period 2003-2007. Document prepared by the Office of the Union. Geneva: Union of Plant Varieties; 2008. [ Links ]
21. National survey of research and experimental development, 2007/08. Cape Town: Centre for Science, Technology and Innovation Indicators; 2009. [ Links ]
22. South Africa's research chairs initiative and South African research chairs and rated researchers incentive funding [homepage on the Internet]. No date [cited 2010 July 29]. Available from: www.nrf.ac.za/projects.php?pid=61. [ Links ]
 Postal address:
Centre for Research on Science and Technology, Stellenbosch University
Matieland 7602
Private Bag X1, South Africa
email: mikejkahn@gmail.com
Received: 12 Oct. 2009
Accepted: 30 Sept. 2010
Published: 27 Jan. 2011

