


Services on Demand
Article
 English (pdf)
 Article in xml format
 Article references
Indicators

Related links
-
 Cited by Google
 -
 Similars in Google
Share

 Permalink
South African Journal of Science
On-line version ISSN 1996-7489
Print version ISSN 0038-2353
S. Afr. j. sci. vol.106 n.11-12 Pretoria Nov./Dec. 2010
http://dx.doi.org/10.4102/sajs.v106i11/12.223
RESEARCH ARTICLE
A socio-structural analysis of crime in the city of Tshwane, South Africa
Gregory D. Breetzke
Department of Geography, University of Canterbury, Christchurch, New Zealand. email: gregory.breetzke@canterbury.ac.nz
ABSTRACT
High and rising levels of crime plague post-apartheid South Africa. A common explanation for these high crime rates relates the country's unique socio-political past to a system of ineffective social control mechanisms that suggest high levels of social disorganisation within certain communities. Other explanations emphasise the presence of disaffected youths and deprivation, as well as the rapid immigration of people from neighbouring African countries into South Africa. I examined a number of these socio-structural explanations of crime on contact crime rates in the city of Tshwane, South Africa. The findings are largely consistent with the social disorganisation theory, as well as with what has previously been suggested in local literature. In order to supplement these preliminary findings, the effects of the same socio-structural explanations on contact crime rates were determined for predominantly Black, White, and 'Mixed' (containing a mix of both Black and White residents) suburbs using spatial regression models. Evidence from these analyses suggests that the effects of the various socio-structural explanations do not appear to traverse racial lines. Rather, the findings suggest non-uniformity in terms of the extent to which the various socio-structural factors impact contact crime rates based on race.
Keywords: apartheid; contact crime; deprivation; social disorganisation; Tshwane
INTRODUCTION
Crime is a chronic social pathology of endemic proportions in South Africa.1 Recent research indicates that despite a slight decline in overall crime levels since democracy, certain categories of crime continue to increase unabated.2,3 Currently, a third of all crime reported to the South African Police Service (SAPS) is violent.4 Explanations for the high and rising levels of violent crime in post-apartheid South Africa are myriad. Breetzke and Horn5 attribute the growth in crime in the country to existing and emerging socio-economic inequalities, while Altbeker6 believes the post-1994 crime wave has been driven by its own runaway internal energies, rather than underlying social and economic conditions. A more nuanced conceptualisation of crime in post-apartheid South Africa is outlined by Shaw7, who attributes the growth in crime to the breakdown of community and related principles of social organisation, including crime control arrangements and reduced risks of punishment. Other explanations emphasise the presence of disaffected youths, deprivation and the rapid immigration of particularly African migrants into South Africa.8,9 In this study, I use a series of maximum likelihood estimation spatial lag models to test a number of these socio-structural explanations of post-apartheid South Africa's violent crime trends. As a geographical focus area, the region under consideration is the City of Tshwane Metropolitan Municipality, located in the Gauteng province of South Africa.
SOCIO-STRUCTURAL EXPLANATIONS OF POST-APARTHEID SOUTH AFRICAN CRIME TRENDS
Social disorganisation
A common explanation for the high violent crime rates in post-apartheid South Africa links the country's unique socio-political past to a system of ineffective social control mechanisms existing within certain communities, notably on the periphery of metropolitan areas.10,11,12,13 The concept that a breakdown of informal social control in families and communities can lead to crime is most directly associated with the ecological perspectives at the macro-level.14 The ecological approach in criminology has among its historical antecedents the work of Shaw and McKay15 who developed an ecological perspective of crime and deviance after mapping thousands of incidents of juvenile delinquency in the city of Chicago. The researchers based their social disorganisation theory on the notion that adverse physical and social conditions in communities, which were a consequence of the process of urban growth, pushed residents into a life of crime.16 The proliferation of population and demographic datasets in the 1980s, coupled with the emergence of geographic information systems (GIS) in the 1990s, has resulted in a number of tests of the social disorganisation theory,14,17 as well as a concomitant number of extensions to the theory.18,19 In most incidences, partial support for the theory is found,20,21,22,23 with poverty typically exhibiting the greatest explanatory power in most studies.
The recent political history of South Africa is inherently intertwined with social disorganisation and community fragmentation. Segregationist policies in the apartheid-era, most notably the migrant labour system and Groups Areas Act, resulted in predominantly Black communities being marginalised, both socially and economically, as the apartheid government sought to maintain class exploitation and to prevent unified resistance. Whereas researchers have long documented social disorganisation in Black communities,11 few studies have tested the social disorganisation theory and its key propositions in a local context.
Four main measures are typically employed to represent social disorganisation within a community, (1) ethnic heterogeneity, (2) socio-economic deprivation, (3) family disruption and (4) residential mobility. In this study, I concentrate on the social organisation of families (or family disruption) as a measure of social disorganisation. This approach was adopted for a number of reasons. Firstly, family and community ties related to family structure and composition were typically strained under apartheid. Secondly, the family reflects the primary socialisation and supervision institution in the lives of individuals. Lastly, family and community ties affect the ability of the family to collectively establish informal social control. The last explanation draws heavily on Hirshi's24 influential social control theory which posits that strong social bonds to family, school and peers deter individuals from committing crime. The concept of informal social control at the individual level is, however, most often operationalised to social disorganisation perspectives at the macro-level.
Disaffected youths
Prior international research suggests that crime is committed disproportionately by young males.25,26,27 The consistent overrepresentation of this demographic in studies of crime has led some theorists to suggest that hormonal and biological factors are the most logical explanation for these differences.28 Other theorists motivate that cultural and psychosocial factors may play a determining role in gender and age differences in offenders.29,30 Local researchers in South Africa also note the disproportionate involvement of particularly young men as perpetrators of crime. For example, in apartheid South Africa, Venter and Retief31 found that juvenile delinquency and crime peaked at the age of 18 and that older offenders were prone to committing more aggressive and sexual crimes. Similarly, in an analysis of official juvenile crime statistics from 1969–1970, Strijdom and Van der Colff32 found that the risk of criminality among young adults was considerably higher than the rest of the population. The crime-age relationship under apartheid rule is echoed in the post-apartheid era, with a number of researchers noting the positive correlation with male youth and crime.2,33 Indeed, statistics from the South African Department of Correctional Services indicate a 10-fold increase in the number of male child offenders (between the ages of 12 and 17) incarcerated in youth correctional facilities between 1999 and 2004.34 Almost 400 000 children were arrested across the country between 2000–2002, while almost 175 000 children were arrested in 2005 alone.35
A number of reasons have been postulated for the growing number of youth in the criminal justice system in South Africa, including the proliferation of gang activity,36 prior victimisation,37 poverty caused by unemployment38 and the loss of parents as a result of HIV/AIDS.35 More recent explanations for the increasing incidence of crime committed in South Africa by particularly Black male youths, cite frustration as a result of unmet socio-economic expectations.39,40 I therefore analysed the impact of the proportion of young males on post-apartheid South Africa's high and rising crime rates.
African immigration
Other researchers have suggested that South Africa's exceptionally high crime rates are a result of the influx of particularly African migrants into South Africa.9,41 It is estimated that one illegal immigrant enters South Africa every 10 minutes,42 with a report from the United Association of South Africa43 indicating that about 10 million illegal immigrants from neighbouring African countries are currently in South Africa. The strong association between illegal immigration and crime has been widely acknowledged by the South African government with the first main policy document to govern policing in the country, the National Crime Prevention Strategy, in 1996 warning that the unregulated flow of people over borders can increase the potential for inter-group conflict and cross-border crime. In 1999, the White Paper on International Migration44 indicated the negative impact that illegal immigrants were having on the provision of services and on South African society as a whole. The paper noted the considerable involvement of illegal immigrants in criminal activities, as well as their involvement in the corruption of state officials. In 2003, the former Minister of Defence, Mr Mosiuoa Lekota, made an explicit reference to the involvement of illegal immigrants in crime by stating that the majority of cash-in-transit heists in South Africa were being conducted by syndicates led by foreigners and that involvement of immigrants in the drug trade in South and southern Africa was significant. Statistics largely support the standpoint taken by government, with figures indicating a 27% increase in the number of deportation warrants issued to immigrants convicted of crimes in South Africa between 1998 and 2003.41
Relative and absolute deprivation
The relationship between poverty and crime has been consistently present in international literature.45,46,47 Local researchers48,49 also highlight the association between South Africa's high crime rates and poverty. According to Parker50, the theoretical link between crime and poverty is based on two distinct but related conceptions of poverty: relative and absolute deprivation. Relative deprivation is an outcome of social comparisons and is seen as a mechanism whereby poverty leads to crime.51 Individuals evaluate their socio-economic position in relative terms and become frustrated and can resort to violence based on their perceived deprivation relative to the socio-economic position of others. A key feature of the relative deprivation model often referred to as reference group theory52 or strain theory,53 is accurately defining the reference group used by individuals in determining injustices. Whereas Lau54 maintains that individuals will compare themselves with others with whom they come into frequent contact, Hipp55 argues that individuals are more likely to compare themselves with others of their own racial or ethnic group when determining the appropriateness of their economic rewards. Within this context, it seems plausible that individuals in South Africa, particularly Black residents, may feel relatively deprived when comparing themselves to both reference groups. Firstly, the gross inequalities of apartheid and its legacy resulted in the majority of Black people in post-apartheid South Africa being much poorer than their White counterparts. The most recent statistics in South Africa indicate virtually no poverty among White people (1.1%), whereas poverty rates for Coloured people and Black people are 16.3% and 33% respectively.56 In this instance, the poverty line was defined as R5057 per household per annum. Living in such a multi-racial society, individuals will naturally have immeasurable contact with members of all other races. Secondly, Black people may feel deprived when comparing themselves to other Black people, particularly those that have gained considerable wealth in the 15 years of democracy. According to Landman57 the main driver of inequality currently in South Africa is no longer the Black or White divide, but rather the intra-group divide between rich Black people and poor Black people. Inequality estimates derived from the 1996 and 2001 population censuses were the highest among the Black population,58 while the largest within-group increase in the Gini coefficient, which measures the distribution of national income, since democracy, was from 0.467 to 0.501 and occurred among Black people. While this intra-Black move is understandable, given the concerted efforts to transform the ownership and personnel structures of the economy, the move also speaks of the failure of government policies, particularly that of Black Economic Empowerment, to reduce poverty levels across the whole country. Overall, the dichotomous economy of wealth in post-apartheid South Africa is revealed in the national Gini index, which currently stands at 0.58.57
Absolute deprivation is a much simpler concept to define and refers largely to the absence of the basic requisites for survival, such as food, water and shelter. The absolute deprivation measure can itself lead to crime, as individuals are driven by need rather than economic profit. The proposition that absolute deprivation can increase the risk of various types of crime is a common thread in a number of competing theoretical models, including social disorganisation,15 strain52 and conflict theory.59 The basic premise is that a significant level of absolute deprivation reduces opportunities, employment or otherwise, for the legitimate pursuit of socio-economic wealth. Consequently, individuals resort to crime in order to survive. Both of these conceptions of poverty can play an important role in explaining the high levels of crime in post-apartheid South African society and are included in the analysis.
Previous ecological studies of crime in post-apartheid South Africa
A limited number of studies have been forthcoming in post-apartheid South Africa, examining one or more of these socio-structural explanations of crime. According to Breetzke and Horn60 the dearth of ecological studies of crime in the country can be attributed to a range of methodological issues. These issues include the misalignment of administrative units, such as police station boundaries with census units and problems related to the capturing of crime incidents in the Case Administration System of the SAPS, which are detailed by Schwabe and Schurink.61 Despite these and other issues, I have identified five previous studies that have used cross-sectional data to explicate crime in South Africa. The first is Gilfillan62, who used ordinary least squares (OLS) regression to indicate which socio-economic variables best predicted crime locations. Gilfillan found a positive spatial relationship between the prevalence of poverty, low social status, deficient social structures and crime. In terms of methodological issues, he indicated the problems he experienced during the process of aggregating demographic variables from the enumeration area (EA) level up to the police station level. The problems experienced were such that some demographics from the census, such as unemployment and related socio-economic indices, family structure and cohesive indicators, were not used. Also, Gilfillan did not account for problems of spatial autocorrelation commonly associated with the use of spatial data.
Brown63 found that socio-economic variables (such as income, age and education) were more significant determinants of crime in South Africa than deterrence variables (such as conviction and average length of prison sentence). However, Brown's study was limited in terms of the time period and geographical areas that were considered. Because of a number of constraints, her analysis could only be undertaken for crimes committed in 1994 and measures for certain variables had to be contrived from datasets at much coarser aggregation levels. In addition, Brown used simple Pearson pairwise correlation between the crime rate and the predictor variables in order to obtain her results. The use of this statistic, while important in quantifying the linear relationship between variables, does not imply causation and should therefore be used with caution in studies of this nature. In a panel data analysis of crime in South Africa, Blackmore49 found that (1) a low income per capita, (2) a high ratio of women to men, (3) a high degree of urbanisation, (4) a high level of unemployment and (5) young age had significant associations with high crime levels. In Blackmore's study, only one third of all crimes were found to be sensitive to changes in the quantity of expenditure on total protection services, while education and change in gross domestic product variables yielded non-significant results.
Perhaps the most comprehensive study focusing on crime causation and appropriate crime prevention policy in post-apartheid South Africa was conducted by Schwabe and Schurink.64 These researchers created a socio-crime classification of police station areas in South Africa. Approximately 1100 police station boundaries were captured into a GIS and integrated with crime statistics between 1997 and 1999, and with socio-demographic information from the 1991 and 1996 censuses. The database ultimately consisted of over 250 census variables and 74 crime variables linked to police station boundaries. The database was subsequently entered into an Artificial Neural Network which clustered the 1100 police stations into 20 primary socio-crime categories. In their study, violent crimes were found to predominate in police station areas consisting of people with no housing and where residents speak predominantly Black African languages such as IsiZulu and IsiXhosa, while economic crime was dominant in urban areas where there were a high number of White people. Similarly to Gilfillan62, Schwabe and Schurink ignored spatial autocorrelation and noted the omission of certain variables, such as unemployment and population density, in their analysis as a result of the problems that occurred during the process of aggregating demographic variables from the EA level to the police station level.
More recently, Demombynes and Özler33 examined the effects of local inequality on property and violent crime in South Africa. Their findings were consistent with economic theories relating local inequality to property crime and also were consistent with sociological theories that imply that inequality leads to crime in general. Similar to Brown63 and Blackmore,49 their unit of analysis was the police station boundary which provides a very coarse ecological portrayal of the determinants of crime in the country and makes any inferences drawn from these findings more susceptible to the inherent limitations associated with mapping defined boundaries, such as the modifiable areal unit problem and the ecological fallacy.
In light of the previous literature reviewed, this study is unique in a number of ways: firstly, it represents the first time in a South African context that crime analysis is conducted using geocoded incidences of crime, which allowed for the finest possible aggregation level – the suburb – to be used as the unit of analysis. Secondly, spatial regression techniques are employed to account for the effects of spatial dependence in the dataset. Lastly, the study practically implements and assesses common criminology theories, such as the social disorganisation theory, in a local context.
DATA AND METHODS
Crime data
Crime data for the study were obtained from the Crime and Information Analysis Centre of the SAPS. The information provided included the geographic location, date, time of day and type of crime committed in Tshwane between 2002 and 2006. These dates were selected as they represent the closest date to democracy at which accurate spatial information on crime incidents has been recorded by the SAPS. The time period also broadly coincides with the most recent census carried out in the country by Statistics South Africa (SSA), which was in 2001. Contact crimes were selected as the measure of crime for two important reasons. In their analyses of the national crime situation, the SAPS typically group crime tendencies into five broad categories, (1) contact crimes, (2) contact-related crimes, (3) property-related crimes, (4) crimes heavily dependent on police action for detection and (5) other forms of serious crime. Contact crimes include murder, attempted murder, rape, assault with the intent to inflict grievous bodily harm (assault GBH), common assault, indecent assault, aggravated robbery and other forms of robbery. In this study, contact crimes were selected as the measure of crime for two important reasons. Firstly, this crime type involves physical contact between victims and perpetrators, with the result being either death or some form of physical and/or psychological trauma. Consequently, contact crimes have important implications on the perception of security or insecurity among South Africans. Secondly, these crimes constitute 33% of South Africa's recorded crime. As a result, the South African government has resolved to reduce contact crime levels by between 7% and 10% each year, starting with the 2004/2005 financial year. The target was established on the basis of broad comparisons with the crime ratios recorded by other INTERPOL member countries during the late 1990s and the fluctuating crime trends observed locally since 1994.
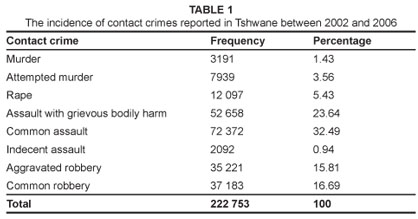
The resultant crime dataset totalled a staggering 222 753 contact crime incidences occurring over the 5-year period in Tshwane. The data includes 3191 murders, 12 097 rapes and about 125 000 incidences of assault in an area smaller than Long Island in the United States. Each geocoded crime incident was matched to a suburb and a 5-year average (2002–2006) was taken to minimise the impact of annual fluctuations for small units. Suburbs represent the finest spatial unit of analysis at which SSA has legally provided SSA Census 2001 information. Tshwane currently has 371 suburbs with a suburb typically consisting of between 150 and 300 households. The rate refers to the number of contact crimes per 10 000 residential population.
Census data
The socio-demographic data used to represent the socio-structural explanations of crime in Tshwane were obtained from the SSA Census for 2001. Firstly, to test the notion that social disorganisation accounts for post-apartheid South Africa's crime trends, I included measures of divorce or separation, head of household and father mortality status. These measures are intended to reflect family composition or, more specifically, the degree of familial structure within communities. It is expected that an increase in the number of separations or divorces will signal declining informal social control. Divorce or separation is measured by the number of cases per 1000 general population. Also included is the percentage of female-headed households and the percentage of residents whose father is either dead or estranged. I operationalised disaffected youths as the percentage of males aged between 15 and 34. Relative deprivation was measured as the share of the city of Tshwane's income located within a given suburb and was calculated as (Ii/It) / (Pi/Pt), where (Ii/It) is the proportion of aggregate household income in Tshwane that is located in suburbi and (Pi/Pt) refers to the proportion of all city residents located in suburbi. Values greater than 1.0 indicate that, relative to its population, a suburb has a disproportionate share of the total city income, while values less than 1.0 mean the converse. I included two measures of absolute deprivation in the analysis. The unemployment rate was calculated as the percentage of unemployed persons among the population aged 15 years and older. The poverty measure was a factor-analysed deprivation index (DI) based on the United Nations Development Programme's65 parameters for deprivation in five dimensions, (1) the percentage of residents living in informal housing, (2) the percentage of households with no flush toilet, (3) the percentage of households with no water supply, (4) the percentage of households with no electricity and (5) the percentage of households with no refuse removal. An index was created for each of the five dimensions to measure the absolute deprivation of each parameter per suburb in Tshwane. The DI was then calculated as a simple average of the five basic services indices, with 0 indicating extreme deprivation and 1 indicating affluence. African immigration was also included and was determined as the percentage of residents with African citizenship (outside of South Africa).
Regression model for analysis
A spatial regression model was used in this study because of the problems that arise when using traditional OLS regression with spatial data.66 Initially, exploratory spatial data analysis was performed on the data, including global and local indicators of spatial clustering. It is interesting to note that the global Moran's I statistic (0.0005, p = 0.00) confirmed visual inspection to the effect that significant autocorrelation did not exist in the distribution of contact crimes in the city of Tshwane. This provides an indication that contact crime is equitably distributed and widespread across Tshwane. In order to assess more specific measures of local spatial association, the univariate local indicators of spatial association method was employed to assess the extent to which the global pattern of spatial association, measured using Moran's I, was spread uniformly throughout the data or whether there were significant types of locations affecting its computation. The subsequent analysis provided evidence of the existence of statistically significant contact crime clusters occurring predominantly in the eastern and northern regions of the city. Evidence of significant localised spatial clustering motivated for model estimation using spatial regression. Finally, because the analysis includes a number of possibly multicollinear covariates, a correlation matrix was constructed for the independent variables. While a number of correlations were high and pose a risk of collinearity in the spatial statistical modelling process, none of the correlation coefficients were greater than 0.70, a common threshold for concern, while all variance inflation factors were well below 4. The general functional form of the spatial lag model is:

where y represents the number of contact crimes per 10 000 population at risk, Wy is the weighted mean of the local values of y in neighbouring areas, p is the parameter, X is the set of crime motivators, B is a vector of coefficients to be estimated and ε is the error term. Spatial autocorrelation was modelled using first-order rook's movement for suburb adjacency definitions in construction of the weights-standardised wij matrix.
RESULTS
Crime data
Table 1 presents a generalised breakdown of contact crime in Tshwane. A number of features are particularly prominent. Firstly, the results illustrate the magnitude of contact crime in Tshwane, with over 220 000 incidences recorded over the 5-year period (2002–2006). Assaults, both GBH and common, are the most frequently occurring crimes in the city, which is a worrying fact considering these crimes are notoriously under-recorded in South Africa; two national victim surveys indicated that less than half of all assaults were reported to the police.67,68 Moreover, common and aggravated robberies, which combined constitute more than 30% of contact crime in Tshwane, are also under-reported in South Africa, with 78% of these types of crimes typically going unreported. Over 980 000 incidences of crime covering all categories were recorded for this time period in the city.
Census data
In terms of the independent variables, the descriptive statistics (Table 2) reveal the disrupted nature of families in Tshwane with over 30% of households being headed by women and almost 40% of residents' fathers classified as either deceased or estranged. Also notable is the low divorce or separation rate in the city and the low percentage of non-South African citizens. Finally, the relatively large standard deviations across almost all variables suggest that scores are widely dispersed and vary considerably across the city. This finding could reflect the remarkably wide historical disparities in socio-economic wealth between races in the country.

Regression model
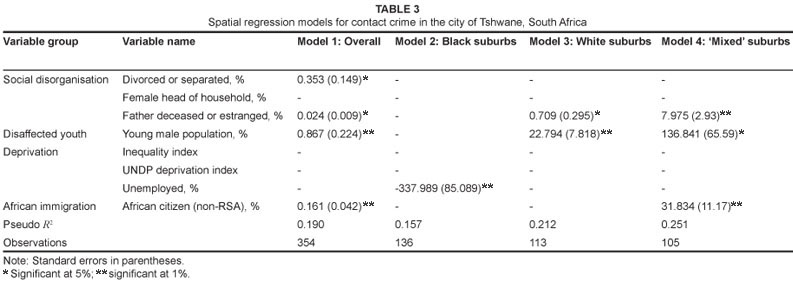
Table 3 shows the regression results for the analyses of contact crime rates for Tshwane. For the aid of interpretation, only the significant predictors are shown. A total of three spatial regression models are estimated. The first model presents the results from analysis estimating the impact of the identified socio-structural explanations of crime on contact crime rates across the whole of Tshwane. In order to evaluate any possible interaction between the racial composition of suburbs and the socio-structural explanations of contact crime rates in the city, three further regression models were run separately for those suburbs categorised as being occupied by predominantly Black people, White people or both ('Mixed'). Suburbs were categorised as Black if more than 80% of the residents were Black, as White if more than 80% of the residents were White and as 'Mixed' if there were neither an 80% Black nor an 80% White majority within the suburb. While the identification of crime determinants in racially stratified suburbs within Tshwane was not a central aim of this paper, I felt that this knowledge would supplement the main findings of the study by providing further insight into the impact that different socio-structural factors have on crime rates across racially diverse suburbs.
The effects of two of the three social disorganisation measures of contact crime for the overall model are supported, with both the parameters percentage divorced or separated and percentage father deceased or estranged, being statistically significant. Thus, consistent with the social disorganisation theory, suburbs with greater familial instability tend to have greater contact crime rates. Other statistically significant effects were found for the young male population and for the measure of African immigration. In all instances, the direction of the relationship between the socio-structural factors and contact crime is consistent with expectations.
Model 2 is an analysis of the relationship between the socio-structural factors and contact crime among predominantly Black suburbs. In this model, only the percentage of unemployed residents is significant. Interestingly, the percentage of unemployed residents exhibits a very strong negative association with contact crime rates. This implies that a decrease in the percentage of unemployed residents is associated with an increase in the contact crime rate in Black communities. This finding is surprising considering that both the contact crime and unemployment rates are on average higher among Black suburbs (the number of crimes per 10 000 people is 78.72 and the percentage of unemployed people is 29.13) than either White suburbs (the number of crimes per 10 000 people is 16.38 and the percentage of unemployed people is 3.12), or 'Mixed' suburbs (the number of crimes per 10 000 people is 74.38 and the percentage of unemployed people is 7.59). This finding, while surprising, is not uncommon in international literature,69,70 and is also consistent with another local study33 wherein no significant association was found between unemployment and crime. In the local study, the researchers explained this finding by emphasising the complicated relationship between employment and crime, as well as the fact that the unit of analysis used in their study did not adequately capture the relevant job market. A possible explanation for this finding for Black residents in this study can be found by examining the nature of contact crime in South Africa. According to the SAPS4, over 80% of contact crime committed in the country is social or domestic in nature and involves people who are known to each other. This includes 89% of assault cases, 82% of murders, 76% of rapes and 59% of attempted murders. In addition, Leggett71 notes that '... most contact crime in South Africa occurs in the heat of the moment' and involves the use of drugs and alcohol. In such instances, an individual's employment status, while important in generating personal wealth, is perhaps less significant than other strains placed on personal relationships, such as infidelity, substance abuse and work-related stress.
Model 3 estimates the impact of socio-structural factors on contact crime rates for predominantly White suburbs. Consistent with the overall model, familial instability, together with an increase in the percentage of young males, is associated with an increase in the contact crime rate. Lastly, Model 4 estimates the impact of socio-structural factors on contact crime rates for 'Mixed' suburbs. The results indicate three significant predictors of contact crime rates including the percentage of families with a deceased father, the percentage of young males and the percentage of African citizens. These findings suggest that in 'Mixed' suburbs familial instability and the presence of immigrants are the socio-structural factors most strongly associated with an increase in contact crime.
DISCUSSION
The results of the cross-sectional analyses indicate that a number of socio-structural factors play a facilitating role in crime in Tshwane. Overall, the findings support social disorganisation explanations of post-apartheid South African contact crime trends. Two of the three measures of social disorganisation effects in the overall model are both significant and in the expected direction. Considerable support is also found for the disaffected youth explanation, as well as for the measure of African immigration. While the results indicate that an explanation for post-apartheid South African contact crime trends should include measures of social disorganisation, disaffected youth and African immigration, evidence suggests that the effects of the socio-structural explanations do not appear to traverse racial lines, particularly in terms of unemployment. Rather the findings suggest non-uniformity in the extent to which the various socio-structural factors impact contact crime rates based on race.
The study's limitations need to be considered. Firstly, the cross-sectional nature of the study implied that there is a lag between the census data (accurate for 2001) and the crime data averaged over 5 years from 2002 to 2006. Ideally, a time-series analysis would aid in examining the influence of these socio-structural factors on contact crime rates in Tshwane over time. Unfortunately such a longitudinal study would be difficult, if not impossible, in South Africa because 2001 represents the earliest date at which accurate spatially referenced information of any crime incident became available in the country. This, by implication, makes any ecological study of crime in South Africa prior to 2001 prone to error. Secondly, the variable used to represent African immigration captures those residing legally in South Africa and does not reflect the presence of illegal immigrants. While this measure was nonetheless found to be significant in both the overall and the 'Mixed' model 1 suggest that this measure may have been more significant in these models or certainly would have been significant in all the models if the measure also reflected the percentage of illegal immigrants in each suburb of Tshwane. Unfortunately data documenting the presence of illegal immigrants in communities is rarely available and certainly not at a suburb level of aggregation. Future research could include such a measure if a national study was conducted at a much wider level of aggregation (i.e. municipal or provincial level) as estimates of the presence of illegal immigrants at these spatial extents are likely to be more accurate and would certainly be more readily available. Lastly, the study does not take into account the location of the offender of the criminal incident. An offender residing in suburb A could commit an offence in suburb B and this could have little to do with the social disorganisation 'status' in suburb B. Indeed, research by Breetzke & Horn5 has shown how offenders in Tshwane are spatially clustered in some areas in which crime itself is relatively low. Again, this limitation is difficult to counter because crime data typically collected by the SAPS does not record the offender of the crime and certainly not the offender's address. With crime conviction rates perennially low, it seems that this problem will continue for the foreseeable future. While these limitations place certain restrictions on the generalisability of the findings, the study is an important step in future ecological crime studies in the country and provided important initial insight into the distribution of contact crime within Tshwane and its relationship to regional and racial composition.
CONCLUSION
In this study, using geocoded incidences of contact crime in Tshwane, I have analysed the effects of a number of socio-structural factors on crime. Overall, the various factors of crime highlighted by local researchers are generally well supported in this study. Four of the eight variables selected to measure the various socio-structural explanations of crime, were found to be statistically significant and directed in the expected direction in terms of the overall model. Considerable support is found for the social disorganisation measure, as well as the disaffected youth and the measure of African immigration. A comparison of the pattern of findings of my study with other research examining the determinants of crime in South Africa is problematic. Notwithstanding the methodological limitations referred to earlier, no previous studies have related measures of social disorganisation, or reported on the influence of African immigration on contact crime rates. Loose comparisons that can be made, however, are largely consistent with other local research. For example, Brown71 reports on the presence of young males as an explanation of crime but also indicates the relevance of female marginalisation. Moreover, Demombynes and Özler33 also found no significant relationship between unemployment and crime, although the coefficients were positive for violent crime. Conversely Gilfillan62, Brown63 and Blackmore49 all report on the significance of unemployment as a predictor of high crime levels in the country.
The estimation of three separate race models introduced a new dimension to the study. In doing so, the study represents the first empirical attempt to understand these racial differences in the effects of socio-structural factors on any crime rates in South Africa. The results illustrate the complex and conflicting nature of South African society with no variable significant across all of the race models. One possible explanation for this finding could lie in the fundamental cultural differences that have emerged historically between the diverse races in South Africa. Traditional cultural perspectives in criminology claim that unique historical experiences of certain groups of people, such as African Americans and southerners in the United States, have led these individuals to adopt values, attitudes and beliefs conducive to the use of violence and the devaluing of the sanctity of life.72 Accordingly, a 'subculture of violence' has emerged among such individuals that would not be expected to disappear if structural conditions improved markedly within their communities. Local researchers have long speculated on the development of a 'subculture of violence' among certain racial groups in South Africa.10,12,13,71 Advocates of the subculture of violence explanation emphasise the presence of socio-economic deprivation, disaffected youths and a lack of basic education among certain racial groups as being the primary cause of crime. According to Schwabe73, this juvenile cohort perceives itself to be deprived in terms of education, employment and socio-economic wealth relative to other groups in the country and tends to be guided by values that prescribe violence as a means of solving problems and expressing frustrations. However, empirical studies investigating the so-called 'subculture of violence' evident among certain communities in South Africa have been sorely lacking with post-apartheid researchers reluctant to speculate on a certain racial group being considered crime-prone. While this reluctance is understandable considering the socio-political past of the country, an examination of racial differences in crime and delinquency is critical because many prominent macro-level explanations of crime assume similar effects across racial groups.74 Future studies should seek to expand on this aspect of the race-crime relationship in post-apartheid South Africa as well as to conduct similar analyses, possibly using other socio-structural factors not used in this study. I believe that the results presented here are, however, sufficiently valuable enough to merit further investigation and provide an important spatial platform for future crime research in South Africa.
REFERENCES
1. Botes L. Development and crime: Reflections on the South African context. Paper presented The Crime Prevention and Development workshop of the Criminal Justice Initiative of the Open Society Foundation of South Africa; 2003 June 26-27; Stellenbosch, South Africa. [ Links ]
2. Altbeker A. Positive trends: 2004/05 crime statistics. S Afr Crim Quar. 2005;14:1–11. [ Links ]
3. Louw A. Crime and perceptions after a decade of democracy. Soc Ind Res. 2007;81:235–255. [ Links ]
4. South African Police Service. SAPS Annual Report 2007/08; 2008. [ Links ]
5. Breetzke GD, Horn AC. A geodemographic profiler for high offender propensity areas in the city of Tshwane, South Africa. Environ Plan A. 2009;41:112–127. [ Links ]
6. Altbeker A. A country at war with itself: South Africa's crisis of crime. Johannesburg: Jonathan Ball Publishers; 2007. [ Links ]
7. Shaw M. Crime, police and public in transitional societies. Trans. 2002;49:1–24. [ Links ]
8. Van Huyssteen E, Oranje M. Planning for crime prevention: The case for the city of Tshwane. Pretoria: SaferAfrica; 2003. [ Links ]
9. Strydom H, Schutte, SC. A theoretical perspective on farm attacks in the South African farming community. Acta Crim. 2005;18:115–125. [ Links ]
10. Elder GS. Malevolent traditions: Hostel violence and the procreational geography of apartheid. J S Afr Stud. 2003;29:921–935. [ Links ]
11. Emmett T. Social disorganisation, social capital and violence prevention in South Africa. Afr Saf Prom J. 2003;1:4–18. [ Links ]
12. Maree A. Criminogenic risk factors for youth offending. In: Bezuidenhout C, Joubert S, editors. Child and youth misbehaviour in South Africa: A holistic view. Pretoria: Van Schaik, 2003; p. 51–79. [ Links ]
13. Berg J, Schärf W. Crime statistics in South Africa 1994–2003. S Afr J Crim Jus. 2004;17:57–78. [ Links ]
14. Cahill ME, Mulligan GF. The determinants of crime in Tucson, Arizona. Urb Geo. 2003;24:582–610. [ Links ]
15. Shaw C, McKay HD. Juvenile delinquency and urban areas. Chicago: University of Chicago Press; 1942. [ Links ]
16. Allen C. Crime, drugs and social theory. Aldershot: Ashgate; 2007. [ Links ]
17. Andresen MA. Crime measures and the spatial analysis of criminal activity. Br J Crim. 2006;46:258–285. [ Links ]
18. Sampson RJ, Wilson WJ. Toward a theory of race, crime, and urban inequality. In: Hagan J, Peterson R, editors. Crime and inequality. Stanford: Stanford University Press, 1995; p. 37–54. [ Links ]
19. Tseloni A, Osborn DR, Trickett A, Rose K. Modelling property crime using the British crime survey: What have we learnt? Br J Crim. 2002;42:109–128. [ Links ]
20. Kawachi I, Kennedy BP, Wilkinson RG. Crime: Social disorganisation and relative deprivation. Soc Sci Med. 1999;48:719–731. [ Links ]
21. Ouimet M. Aggregation bias in ecological research: How social disorganization and criminal opportunities shape the spatial distribution of juvenile delinquency in Montreal. Can J Crim. 2000;42:135–156. [ Links ]
22. Rice KJ, Smith WR. Socioecological models of automotive theft: Integrating routine activity and social disorganization approaches. J Res Crim Del. 2002;39:304–336. [ Links ]
23. Freisthler B. A spatial analysis of social disorganization, alcohol access, and rates of child maltreatment in neighborhoods. Child Youth Serv Rev. 2004;26:803–819. [ Links ]
24. Hirschi T. Causes of delinquency. Berkley: University of California Press; 1969. [ Links ]
25. Gottfredson M, Hirschi T. A general theory of crime. Palo Alto: Stanford University Press; 1990. [ Links ]
26. Foot DK, Stoffman D. Boom, bust & echo 2000: Profiting from the demographic shift in the new millennium. Toronto: Macfarlane, Walter and Ross; 1998. [ Links ]
27. Fajnzylber P, Lederman D, Loayza N. What causes violent crime? Eur Eco Rev. 2002;46:1323–1357. [ Links ]
28. Wilson JQ, Herrnstein RJ. Crime and human nature. New York: Simon & Schuster; 1985. [ Links ]
29. Maccoby EE. Social groupings in childhood. In: Olweus D, Block J, Radke-Yarrow, editors. Development of antisocial and prosocial behavior: Research, theories, and issue. New York: Academic Press, 1986; p. 263–284. [ Links ]
30. Campbell A. Men, women, and aggression. New York: Basic Books; 1993. [ Links ]
31. Venter HJ, Retief GM. Bantoejeugmisdaad: 'n Krimineel-Sosiologiese Ondersoek van 'n Groep Naturelle Jeugoortreders in the Boksburgse Landdrosdistrik [Bantu youth crime: A criminological and sociological study of a group of youth offenders in the Boksburg Magistrate District]. Cape Town: HAUM; 1960. Afrikaans. [ Links ]
32. Strijdom HG, Van der Colff JAL. 'n Ontleding van Suid-Afrikaanse Jeugmisdaadstatistiek, 1969–1970 [An examination of South African youth crime statistics, 1969-1970]. Pretoria: RGN; 1975. Afrikaans. [ Links ]
33. Demombynes G, Özler B. Crime and local inequality in South Africa. J Dev Eco. 2005;76:265–292. [ Links ]
34. Department of Correctional Services of South Africa. Annual report for the 2007/08 financial year. 2008. [ Links ]
35. Du Preez N, Luyt, WFM. Children in conflict with the law: South African perspectives and private company involvement. Child Abuse Res S Afr. 2005;6:48–55. [ Links ]
36. 36. Frank C. Young guns: Children in organised armed violence. S Afr Crim Quar. 2005;14:11–14. [ Links ]
37. Luyt WFM. Hidden victims of the criminal justice system? Paper presented The 10th International Symposium on Victimology; 2003 July 13-18; Stellenbosch, South Africa. [ Links ]
38. Makoko T. An investigation into the experiential world of children awaiting trial at Dyambu Youth Centre. Masters thesis, Cape Town, University of Cape Town, 2002. [ Links ]
39. O'Donovan M. Looking forward: Using socio-economic data to determine crime trends. Institute for Security Studies Monograph 1998; No. 3 May–June. [ Links ]
40. Altbeker A. Why is crime in South Africa so uniquely violent? Paper presented The Harold Wolpe Memorial Trust's 55th Open Dialogue; 2006 November 30; Iziko Museum of Cape Town, South Africa. [ Links ]
41. Hough M. Involvement of foreigners in crime in South Africa. Pretoria: Institute for Security Studies; 2004. [ Links ]
42. Neveling SC. Implementing the Immigration Act: A cause of or hindrance to xenophobia in South Africa? Masters thesis, Johannesburg, University of Johannesburg, 2006. [ Links ]
43. UASA. The 4th South African Employment Report [homepage on the internet]. c2006 [cited 2006 Nov 23]. Available from: http://www.uasa.org.za/employmentreports.aspx [ Links ]
44. White Paper on International Migration. Pretoria, Government Gazette No. 19920, April 1999. [ Links ]
45. Williams KR. Economic sources of homicide: Re-estimating the effects of poverty and inequality. Am Soc Rev. 1984;49:283–289. [ Links ]
46. Krivo LJ, Peterson RD. Extremely disadvantaged neighborhoods and urban crime. Soc For. 1996;75:619–648. [ Links ]
47. Wang F, Arnold FT. Localized income inequality, concentrated disadvantage and homicide. Appl Geo. 2008;28:259–270. [ Links ]
48. Louw A. Surviving the transition: Trends and perceptions of crime in South Africa. Soc Ind Res. 1997;41:137–168. [ Links ]
49. Blackmore FLE. A panel data analysis of crime in South Africa. S Afr J Eco Man Sci. 2003;6:439–458. [ Links ]
50. Parker RN. Poverty, subculture of violence, and types of homicide. Soc For. 1989;67:983–1007. [ Links ]
51. Webber C. Revaluating relative deprivation theory. Theo Crim. 2007;11:97–120. [ Links ]
52. Merton RK. Social structure and anomie. Am Soc Rev. 1938;3:672–682. [ Links ]
53. Agnew R. A revised strain theory of delinquency. Soc For. 1985;64:151–162. [ Links ]
54. Lau RR. Individual and contextual influences on group identification. Soc Psy Quar. 1989;52:220–231. [ Links ]
55. Hipp JR. Income inequality, race, and place: Does the distribution of race and class within neighborhoods affect crime rates? Crim. 2007;45:665–697. [ Links ]
56. Statistics South Africa. South African Census 2001. Pretoria: Government Printers; 2001. [ Links ]
57. Landman JP. Breaking the grip of poverty and inequality in South Africa: 2004–2014. Southern African Regional Poverty Network Report [homepage on the Internet]. c2003 [cited 2003 Dec 10]. Available from: http://www.sarpn.org.za/documents/d0000649/index.php [ Links ]
58. Leibbrandt M, Bhorat H, Woolard I. Measuring recent changes in South African inequality and poverty using 1996 and 2001 census data. CSSR Working Paper No. 84. Cape Town: South African Labour and Development Research Unit, University of Cape Town; 2004. [ Links ]
59. Taylor I, Walton P, Young J. The new criminology. New York: Harper Torchbooks; 1973. [ Links ]
60. Breetzke GD, Horn AC. Key requirements in the development of a spatial-ecological theory of crime in South Africa. Acta Crim. 2008;21:123–143. [ Links ]
61. Schwabe CA, Schurink WJ. Crime forecasting and multivariate analysis at a strategic level: Towards a social science interpretation. Research report for the South African Department of Arts, Culture, Science and Technology, Pretoria, South Africa; 2000. [ Links ]
62. Gilfillan TC. Modelling crime statistics with the 1996 census data. Pretoria: Council for Scientific and Industrial Research Press; 1999. [ Links ]
63. Brown KV. The determinants of crime in South Africa. S Afr J Eco. 2001;69:269–299. [ Links ]
64. Schwabe CA, Schurink WJ. A classification of police stations in South Africa: Towards a better understanding of crime. Research report for the South African Department of Arts, Culture, Science and Technology, Pretoria, South Africa; 2000. [ Links ]
65. United Nations Development Programme. South Africa: Human development report. Cape Town: Oxford University Press; 2003. [ Links ]
66. Chainey SP, Ratcliffe JH. GIS and crime mapping. London: John Wiley; 2005. [ Links ]
67. Statistics South Africa. The national victims of crime survey. Pretoria: Government Printers; 1998. [ Links ]
68. Burton P, Leggett T, Louw A, Mistry D. National victims of crime survey: South Africa 2003. Pretoria: Institute for Security Studies; 2004. [ Links ]
69. Ehrlich I. Participation in illegitimate activities: A theoretical and empirical investigation. J Pol Eco. 1973;81:521–565. [ Links ]
70. Kelly M. Inequality and crime. The Rev of Econ Stat. 2000;82:530–539. [ Links ]
71. Leggett T. By-laws and regulations for high impact crime prevention: Why wait? SA Crim Quar. 2004;8:11–16. [ Links ]
72. Peterson RD, Krivo LJ. Macrostructural analyses of race, ethnicity, and violent crime: Recent lessons and new directions for research. Ann Rev Soc. 2005;31:331–356. [ Links ]
73. Schwabe CA. Towards the development of a spatial information system for crime analysis and prevention: Some conceptual requirements and empirical evidence from South Africa. Report for the South African Department of Arts, Culture, Science and Technology, Pretoria, South Africa; 2000. [ Links ]
74. Ousey GC. Homicide, structural factors, and the racial invariance assumption. Crim. 1999;37:405–426. [ Links ]
 Postal address:
Department of Geography
College of Science, University of Canterbury
Private Bag 4800
Christchurch 8140, New Zealand
Received: 17 Aug. 2009
Accepted: 11 Aug. 2010
Published: 15 Nov. 2010
This article is available at: http://www.sajs.co.za
© 2010. The Authors. Licensee: OpenJournals Publishing. This work is licensed under the Creative Commons Attribution License.

