


Servicios Personalizados
Articulo
 Inglés (pdf)
 Articulo en XML
 Referencias del artículo
Indicadores

Links relacionados
-
 Citado por Google
 -
 Similares en Google
Compartir

 Permalink
South African Journal of Science
versión On-line ISSN 1996-7489
versión impresa ISSN 0038-2353
S. Afr. j. sci. vol.106 no.9-10 Pretoria sep./oct. 2010
RESEARCH ARTICLE
Developing a South African pedestrian environment assessment tool: Tshwane case study
Patricia N. AlbersI,II; Caradee WrightII; Jane OlwochI
IDepartment of Geography, Geo-informatics and Meteorology, University of Pretoria, South Africa
IIEnvironmental Health Research Group, Natural Resources and the Environment, CSIR, South Africa
ABSTRACT
Pedestrians, comprising approximately 60% of the population, are among the most vulnerable road users in South Africa. The roadside environment may be an important factor influencing the nature and frequency of pedestrian fatalities. While there are audit tools for assessing the pedestrian environment in other countries, no such tool exists for South Africa. This study evaluated existing audit tools in relation to South African issues and conditions and developed a South African Pedestrian Environment Assessment Tool (PEAT). PEAT was tested at five sites in the Tshwane Metropolitan Area in Gauteng to assess its applicability. PEAT was simple to use and provided valuable information, however, appropriate measures need to be taken to address fieldworker security, especially for night-time assessments when several roadside factors, such as lighting, should be evaluated. Although it was not the focus of our study, based on our results, we suggest that the lack of pavements, pedestrian crossings and pedestrian lighting are factors that, potentially, could increase pedestrian vulnerability.
Keywords: audit tool; fatalities; roadside environment; road users; South Africa
INTRODUCTION
About 60% of the South African population rely on walking as a means of transport.1 Pedestrian fatalities account for a large proportion (i.e. 45%) of deaths on South African roads.2 The most frequent pedestrian accidents in South Africa occur while crossing the road. However, walking alongside, standing beside or playing near the road are also pedestrian activities of concern.3 In 2008, there were 5272 pedestrian fatalities recorded throughout South Africa, compared to 4283 driver fatalities and 5073 passenger fatalities. The highest number of these pedestrian fatalities occurred among individuals aged 30-34 years (i.e. 12.5%), 25-29 years (i.e. 12.5%) and 5-9 years (i.e. 10.5%).2 The periods over Christmas and Easter, when many people travel for holiday purposes, are renowned for having high road death tolls in South Africa. For example, during the Easter periods (approximately 5 days) from 2004 to 2009, pedestrian fatalities (n = 539) ranged between 27% and 49% of all accidents that occurred as a result of road use in South Africa.4
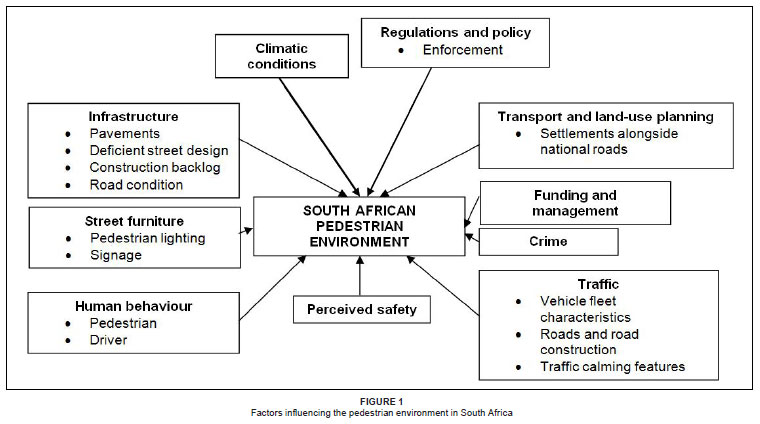
The pedestrian roadside environment may be an important factor influencing pedestrian fatalities. Several factors impact the South African pedestrian environment (Figure 1). Limited supportive policy and resources to develop countermeasures to high pedestrian fatality rates, such as education, enforcement of road regulations and engineering interventions, suggest that pedestrian fatalities will perpetuate human and economic losses. Pedestrian facilities encompass a broad suite of services and facilities including street furniture (e.g. traffic control devices) and infrastructure (e.g. curb ramps, grade passes, crosswalks, traffic calming devices and centre refuge islands) in conjunction with the roadway system and are provided as part of the public right-of-way. For example, in 1952, yield control crossings (also known as zebra crossings) were introduced to South Africa in order to give pedestrians right-of-way to cross a road. Unfortunately, enforcement and education in terms of usage have remained major challenges. Engineering shortcomings, such as lack of crossing facilities, walkways alongside roads and recreational space, such as cycling lanes, may also contribute to pedestrian-motor vehicle collisions.
Human behaviour, in terms of both pedestrians and drivers, is an important influencing factor. Previous research has found that dart-outs and 'intersection dash' accidents are among the most frequent pedestrian accident types involving children and adults, respectively.5 Pedestrian injury rates may be related to population density, traffic flow, local population age composition, gender, unemployment, alcohol consumption and education level.6
Some environmental factors known to influence pedestrian behaviour are weather conditions, the presence of trees, the extent of lighting and the perception of safety. In a study conducted in California, America, which considered the role of street furniture and the traffic environment in child pedestrian injuries, proximity to homes, playing areas, land use, presence and physical attributes of roadways, traffic volumes, car speed and parking, the number of pedestrians, as well as their ages and movements, were all important factors.7 The incidence of injury was three times higher for children living in high-density residential areas than that of children living in single-family residences. A higher number of vehicles parked on the curb also increased the likelihood of child pedestrian injuries occurring.
In South Africa, the same possible causes of pedestrian fatalities and injuries exist; behavioural factors such as alcohol use, and environmental or physical factors, such as lack of roadside pavements, road crossing facilities and inadequate street lighting are of particular concern.8 Even though behavioural factors impact the number of pedestrian accidents and fatalities significantly, environmental factors are potentially more easily modified than human behaviour. The impact of environmental factors has not been given adequate coverage in South Africa and therefore was the focus of our study. In addition, no audit tool exists to assess the South African pedestrian environment, to identify possible problems and to provide recommendations. Therefore, an audit tool meeting these requirements was developed in order to obtain a better understanding of the and evaluate three international pedestrian environment tools to inform the development of a South African-specific tool. The newly developed tool was applied and tested at five sites in the Tshwane Metropolitan Area in Gauteng in order to identify possible limitations and improvements required for future application and to ensure sound outcomes for evidence-based decision-making to address the amelioration of the South African pedestrian environment.
CONTEXT FOR DEVELOPMENT OF THE PROPOSED AUDIT TOOL
Evidence suggests that the pedestrian environment in South Africa is inadequate and this may contribute towards the high incidence of pedestrian fatalities. Several strategies and guidelines have been devised in an attempt to provide safe pedestrian and bicycle facilities in South Africa. Local studies have considered ways to create safer roads through road safety education, law enforcement and evaluation9 and implementing a National Pedestrian Strategy.10 The National Department of Transport published a Pedestrian and Bicycle Facility Guidelines Manual11 in 2004 to evaluate, review and combine all previous manuals into one and to include cost-effective standards and guidelines. However, this document was not available.
The strategic objective of the Road to Safety 2001-2005 Strategy was to reduce vehicle accidents, deaths and injuries on South Africa's roads by addressing four themes: (1) enforcement and law compliance, (2) operator, vehicle and driver fitness, (3) infrastructure, management and information systems and (4) communication, public education and participation.10 The Arrive Alive Road Safety Campaign, initiated in 1997, aims to improve road user compliance and reduce road traffic fatalities. Several phases of this initiative have focused on pedestrian behaviour, including pedestrian visibility and jaywalking. Between 2001 and 2004, the top three high-risk pedestrian accident sites in each province were identified and targeted for treatment; however, this fragmented approach is unsustainable and curative, rather than preventative.10 In general, pedestrian safety has been overshadowed by policies that overemphasise the need to adhere to safe driving, with pedestrian safety not being addressed as a priority.12
While the National Department of Transport for South Africa recognises that pedestrians are the most vulnerable road users, there is little mention of pedestrians or improving the pedestrian environment in the Moving South Africa Stategy.13 Pedestrian vulnerability is addressed in the Draft National Non-Motorised Transport Policy12 where it is stated that pedestrian facilities include not only pavements, but traffic calming features and crossing facilities as well. The importance of street lighting and pavement safety is also emphasised. However, no attention was given to pedestrian environments in their entirety, which may influence the vulnerability of pedestrians. Despite these efforts to implement interventions with the potential impact of improving pedestrian safety, no specific audit tool has been developed to assess the pedestrian environment and to identify critical influencing factors. The Draft National Non-Motorised Transport Policy clearly states that an audit tool is needed to assess South African walkways and pedestrian pavements. This paper describes the first such tool developed to assess the pedestrian environment in a standardised manner in an attempt to inform a relevant response.
METHODS
Evaluation of existing tools
Three roadside assessment tools were evaluated to inform the development of a similar tool for South Africa, namely the Australian Systematic Pedestrian and Cycling Environmental Scan (SPACES),14 the Scottish Walkability Assessment Tool (SWAT)15 and the Pedestrian Environmental Quality Index (PEQI) developed in the United States of America.16 Each tool was reviewed and evaluated to determine common factors appropriate to South African conditions. The data from each existing model were extracted using a template of key items developed especially for this review. An extensive search was undertaken to source articles in which the existing tools were applied in order to fully understand their use and applicability.
Development of a South African audit tool
Drawing from the review of internationally applied tools, several factors were examined and used to develop the Pedestrian Environment Assessment Tool (PEAT) while taking South accidents which included fatalities between 01 January 2007 and 06 May 2009 (i.e. over a period of 29 months). The highest number of pedestrian fatalities per province was recorded in Gauteng.2 Data for pedestrian accidents and 'hit-and-runs' (i.e. when the driver or person responsible flees the accident scene) for the Tshwane Metropolitan Area were extracted. Thereafter, police stations in the Tshwane Metropolitan Area with the most pedestrian and hit-and-run accidents were identified using data from the previous 6 months.
Because the data did not detail accident locations sufficiently, each of the top five police stations was visited. The site regarded as the one with the highest number of accidents in that particular suburb was identified verbally by an official stationed at the police station traffic division in question. However, only two of the five police stations were visited as the remaining police stations were in areas deemed to be isolated or unsafe and not suitable for the researchers to visit. Officers at one of the police stations provided three road sites, but because one of the three sites was considered a high crime area, it was excluded. At the second police station, five sites were identified, of which three were selected by ensuring there was no overlap between these sites and those already selected. The safety (with regard to the incidence of crime) and accessibility of the sites was taken into consideration during the selection process.
Each site was assessed using PEAT. Sites were assessed twice daily, once during morning peak traffic hours (07:00-09:00) and once during afternoon peak traffic hours (15:30-18:00). No sites were visited at night because of safety reasons, as was the case in a study by Agran et al.7 For each site, one side of the road was assessed in the morning and the other side in the afternoon, except at Site B where the same side was assessed during both visits. No sites were assessed during school holidays, public holidays or weekends when traffic patterns may differ from the norm. Fieldwork was conducted between 18 and 24 June 2009. Two trained fieldworkers carried out all the site audits.
Data analysis
Results of the audit of the five representative sites are given both descriptively and quantitatively as a percentage of factors present or absent at each site. In this way, important factors for inclusion in the tool, missing factors and factors requiring more information were identified. Several limitations and challenges were encountered and these are highlighted. The following sections discuss the evaluation of the three existing roadside environment tools and the development of the South Africa PEAT, followed by the findings of its application for its improvement and effective implementation.
RESULTS AND DISCUSSION
Existing audit tools
Three pedestrian environment audit tools were reviewed to identify relevant factors for inclusion in a first attempt to generate a similar audit tool for South Africa. Results of the review and evaluation are provided in Table 1. SPACES was a framework used to study what constitutes a sound environment for walking and cycling by examining aspects, such as paths, in terms of their condition, material, obstructions and slope. It also considered factors such as aesthetics, lighting, cleanliness, vehicle traffic, curbs and vegetation.14 This tool was divided into different sections, such as functionality, safety, aesthetics and destination. It also considered factors such as walking surface, streets, permeability, personal safety, traffic, streetscape, views and facilities. Weightings were applied in order to consider which factors influenced walking, cycling, transport and recreational behaviour.15 Personal safety, attractiveness and the presence of a destination were identified as the most important factors for walking. For cycling, a continuous route and traffic safety were important. Furthermore, a continuous surface was regarded as more important for travel than for recreation.
SWAT objectively documented aspects of the physical environment considered to influence walking in urban Scotland and was aimed at promoting public health and well-being.16 The characteristics of the roadside environment differed according to culture, built environment, landscape and climate.16 Some of the factors examined in this tool were path material and quality, aesthetics, crossings and public transport. It was assumed that some features were present throughout, such as road crossing aids; however, these features were altered for their environment.
PEQI was used by the San Francisco Department of Public Health in the United States. This index was created to assess whether or not the physical environment affects the number of people walking in the area and examined categories such as intersection safety, traffic, street design, perceived safety and land use.17 The index showed which factors people take into account when deciding whether or not to walk in a specific area, in order to inform planners of pedestrians' needs. PEQI divided the criteria into five categories, namely intersection safety, traffic, street design, perceived safety and land use. It examined items such as crossings, width of sidewalk, traffic calming features and public seating. This tool was designed to understand and improve the existing pedestrian environment and not as a method to reduce pedestrian incidents; however, it may have had that effect indirectly.
A thorough examination of the three audit tools highlighted important core factors for inclusion in a pedestrian environment audit tool. Five high-level categories were identified, namely (1) traffic elements, (2) street design, (3) intersection safety, (4) perceived safety and (5) land use. However, all of the existing audit tools aimed primarily to assess the physical environment in an attempt to improve recreational space for health promotion in developed countries, whereas in an emerging country, such as South Africa, roadsides are generally used for purposeful travel instead of for recreational purposes. An important factor that was not considered in the three audit tools was road condition; road condition may influence a driver to drive on a roadside where pedestrians have right-of-way. In South Africa, road conditions are varied and even tarred roads may pose threats where potholes are a major problem.
SPACES and SWAT attempted to accommodate factors requiring quantitative and qualitative responses; however, several factors require a subjective response, for example, aesthetics and safety. These factors were identified for further research. In South Africa, crime and perceived safety are complex issues and therefore several variables were identified for inclusion in the proposed audit tool. For example, the presence of surveillance video cameras outside petrol stations and restaurants may instil a sense of safety for pedestrians walking in a commercial area.
Several limitations were identified during the application of SPACES, SWAT and PEQI to test their applicability, ease of use, robustness and reliability. The main issue of concern was the lack of variability among the sites audited and this was considered during site selection for piloting the proposed South African audit tool.
Description of PEAT
The newly developed PEAT comprised six sections and is presented in Table 2. Each section is discussed below.
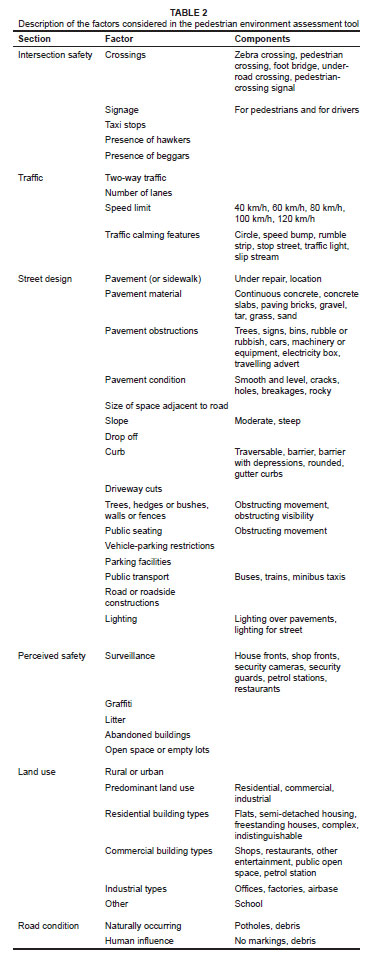
Intersection safety referred to aspects found at an intersection which influence the safety of all road users (i.e. drivers, cyclists and pedestrians), such as crossings, taxi stops, the presence of beggars and hawkers (street or street-side vendors), and pedestrian and vehicle driver signage.
Traffic factors included direction of traffic, the number of lanes for each direction, speed limit and traffic calming features, such as circles, speed bumps, rumble strips, stop streets, traffic lights and slipstreams.
Street design focused on the presence of a pavement, approximate distance from the road (in metres), the roadside area where a pavement was absent, roadside slope, material and condition. Furthermore, any obstructions to pedestrian movement (such as trees, signs, bins, rubble or rubbish, machinery or equipment, electricity boxes and travelling adverts) were also recorded. The presence or absence and type of curbs were recorded. In the absence of a curb, the tar often ends abruptly and erosion occurring at the edge causes a steep drop from the tar to the adjacent ground - a feature known as a 'drop off'; the presence of this erosion was also noted. Parking restrictions, public parking facilities, type of available public transport and construction (of both road and roadside) were included. The presence and position of lighting for both drivers and pedestrians were also documented.
Perceived safety considerations included surveillance of the road or intersection. Surveillance may be in the form of proxy surveillance, such as petrol stations, restaurants or house fronts, or direct surveillance including installed cameras for road and pedestrian observation. Also, the presence of graffiti, litter, abandoned buildings and open land that is not public open space, were included for assessment.
Land use was recorded as residential, commercial or industrial, considering that there may have been more pedestrians in a commercial area and more trucks in an industrial area. Predominant building types were also noted in terms of common buildings for different zonings.
Road condition was assessed for the presence of potholes, the absence of markings and the presence of debris on the road surface, as these conditions may influence dangerous driving behaviour.
Application of PEAT
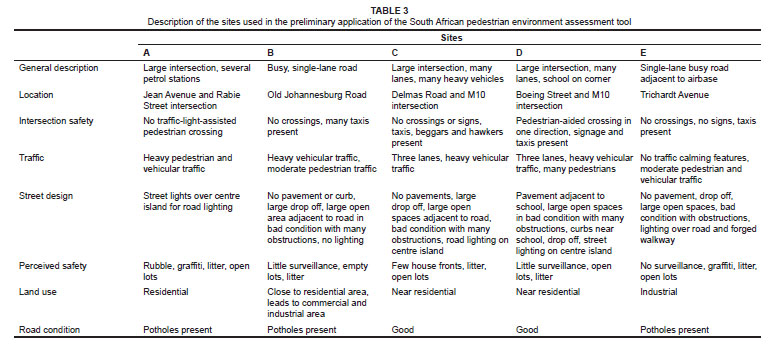
The audit tool was used to obtain a snapshot of the pedestrian environment by evaluating specific factors deemed important for pedestrian safety. To test its suitability, applicability and ease of use, PEAT was used to assess several potential risk factors in the pedestrian environment for each of the five roadside sites identified, using accident data and word-of-mouth. Descriptive characteristics of the sites are given in Table 3. All of the sites were urban: Sites A, C and D were intersections, and Sites B and E were located between intersections. Sites B, C, D and E were all deemed thoroughfares. The level of pedestrian activity was similar for Sites A, B, C and D, while Site E had fewer pedestrians.
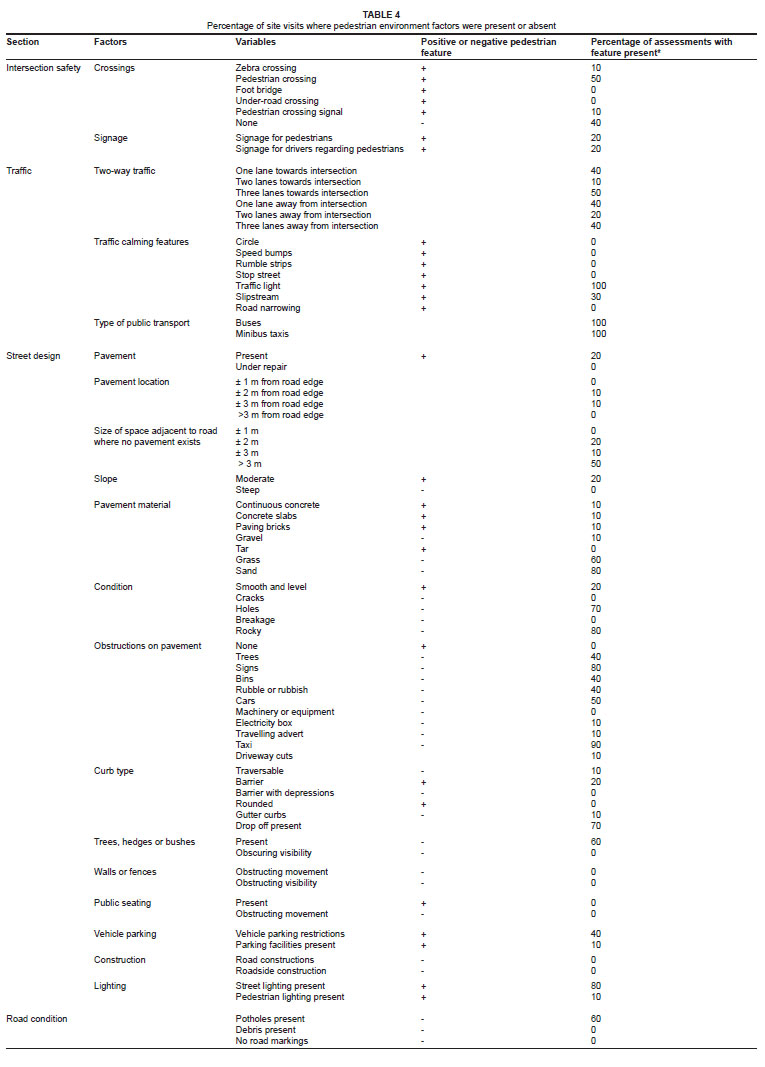
In order to identify important factors across sites, the percentage of site visits when pedestrian environment factors were present or absent, is given in Table 4. For intersection safety, four of the assessed sites did not have any form of pedestrian crossing. Of all the sites, only one had a pedestrian crossing signal (Site D). Hawkers were present at all of the observed intersections and were placing themselves at increased risk of being struck by a vehicle and possibly also obstructing the vision of vehicle drivers. Only two site assessments had signage for pedestrians and/or drivers informing them of the presence of pedestrians.
Five of the site visits had three lanes or more. The number of lanes indicates the general size of the roads and alludes to vehicle frequency, suggesting a possible relationship between the number of lanes and pedestrian accidents, with more pedestrian fatalities being associated with larger and therefore busier roads. Vehicle and pedestrian frequencies were recorded but are not reported here as our focus was on the physical pedestrian environment.
Of the five sites, four had a speed limit of 80 km/h, while only one had a limit of 60 km/h. Pedestrian accidents have predominantly been associated with high travelling speeds, however, one study noted that there were fewer child accidents associated with their highest speed group.10 The authors explained that this might be because of people exercising exceptional caution on larger roads. According to the accident data obtained, approximately 14% of all pedestrian fatalities in the Tshwane Metropolitan Area occurred on national roads, those with a speed limit typically between 80 km/h and 120 km/h. Only 12% occurred on regional roads with speed limits typically between 80 km/h and 100 km/h. Of the fatalities, 73% were on municipal roads; these are roads with speed limits of between 40 km/h and 80 km/h.
In terms of traffic calming features, seven primary features were identified for PEAT, but of these only two were observed at the sites. The two observed were traffic lights (present at all the sites) and slipstreams present in only three of the 10 assessments. Public transport, in terms of buses and minibus taxis, was observed at all the sites. This finding is significant because more pedestrians are likely to be found on routes where there is public transport and one might also expect better pedestrian facilities on these routes as a result of the presence of public transport. However, it is interesting to note that the accident data obtained showed that buses were responsible for 2.5% of all pedestrian fatalities, while comprising only 0.49% of all registered motor vehicles, and minibus taxis were responsible for 11% of all pedestrian fatalities, while comprising only 3.4% of all registered motor vehicles.
In terms of street design, two road sites had pavements but these were located only on one side of the road. Of the roads that did not have pavements, the open space adjacent to the road was predominantly wider than 3 m. All sites without pavements featured roadsides of gravel or a combination of gravel and grass. Holes and rocks, which made walking difficult, were recorded during eight of the site visits. All of the sites had various forms of obstruction, the most common being signage, observed at 8 of the 10 site visits, and stationary taxis, which were observed at 9 of the site visits. Only 3 of the 10 site assessments had curbs; the rest all had drop-offs. When curbs were present, they were not continuous, being either only at the intersection, or near a garage entrance.
Nearly all of the sites had street lighting, however, only one site had lighting over the pedestrian walkway; this site had no pavement. Sites were not visited at night, therefore street light functionality was not assessed. The perceived safety of an area may not influence pedestrian fatalities directly, but it may influence pedestrian behaviour which, in turn, leads to increased risk of being struck by a motor vehicle. For example, if a pedestrian feels unsafe in the environment they may choose not to walk on the walkway, but choose to walk in the road under the street light instead. Nearly all of the sites had proxy surveillance from a petrol station, but also had open lots adjacent to the road, possibly instilling feelings of unease in pedestrians. In terms of road condition, three of the assessed sites had potholes, while the roads of the other two were in relatively good condition. All of the roads had road markings. None of the sites had large debris obstructing the road during site visits.
Although it was not the focus of our study, based on these results we suggest that the lack of pavements, pedestrian crossings and pedestrian lighting may be some of the important factors that could potentially increase pedestrian vulnerability and therefore they require immediate attention to improve the pedestrian physical environment.
Limitations, challenges and recommended improvements to PEAT
Piloting the created PEAT was done to ascertain whether any factors included in the audit tool were inappropriate for South African conditions and whether relevant factors had been excluded and should therefore be added to the audit tool.
Several challenges were encountered when implementing PEAT. One challenge was ensuring the safety of the fieldworkers working on the roadsides. Although night-time assessments should be carried out to determine whether lights are in working order and where they shed light, appropriate security would be required to do so. Two fieldworkers were deployed, but one fieldworker completed the PEAT forms whilst the second fieldworker accompanied the other only for security purposes. In future audits, stringent guidelines would need to be implemented to ensure that inter-rater reliability was sound.
Factors identified during the implementation of PEAT not included in the original audit tool and therefore recommended for inclusion in future applications, were whether or not the roadside was considered a thoroughfare and the proximity of the roadside to formal and informal settlements. Furthermore, it may be beneficial to pilot this tool in rural and informal settlement areas for more factors to be identified. It has been suggested that the number of pedestrian fatalities may continue to increase given the increase in formal and informal settlements adjacent to national roads.9 Another factor relevant to the South African environment would be that of the presence of gated communities and how these influence pedestrians and their movements. The use of marking a feature as either absent or present in PEAT, was in accordance with previous studies; however, the study yielded crude results and further analyses are required to incorporate additional details, such as the width of pedestrian walkways and the distance to the nearest pedestrian crossing. Behavioural factors should be incorporated into future applications as potential negative factors, although the best technique for doing so is still to be determined. For example, a poor roadside environment may force people to walk in the road, or the lack of pedestrian crossing facilities may cause people to jaywalk.
An important issue of concern not sufficiently incorporated in PEAT was crime and security influences on the pedestrian environment. Some proxy measures, such as overgrown vegetation in which criminals may hide, could be included in future applications. It might also be possible to interview pedestrians regarding their crime experiences on roadsides. A second concern is how to evaluate roadside designs for pedestrians with physical impairments. Some studies have considered the pedestrian demographics of motor vehicle accidents in an attempt to inform public health professionals on whom to educate about safe pedestrian behaviour.18,19 However, without providing a safe, user-friendly pedestrian environment, education will not suffice. In other words, PEAT is a useful audit tool that needs to be part of a holistic approach that includes educational programmes aimed at pedestrians and drivers and should be supported by up-to-date and relevant policy and guidelines.
CONCLUSION
The South African PEAT was developed to assess the pedestrian environment for non-motorised road users who use walking as their main mode of transport. In South Africa, where limited resources and capacity exist, the audit tool will assist in efficiently identifying key pedestrian environment factors requiring intervention based on pedestrian safety and ease of use. Three international pedestrian environment audit tools, developed mainly to improve roadsides for recreational purposes, informed the design of PEAT. Following implementation at five sites in the Tshwane Metropolitan Area, several challenges were encountered and recommendations made. Although the audit tool is simple to use and provides valuable information, appropriate measures need to be taken to address fieldworker security, especially for night-time assessment when several factors should be evaluated.
PEAT is the first assessment tool of its kind in South Africa. Future applications will ensure its improvement and effectiveness. It is hoped that awareness will be raised around this research to emphasise the importance of the pedestrian environment because pedestrian fatalities are a significant public health concern.
ACKNOWLEDGEMENTS
The authors would like to thank Dr Sonali Das for her advice, as well as the Road Traffic Management Corporation for providing the accident fatality data which enabled this study.
REFERENCES
1. Department of Environmental Affairs and Tourism. State of the Environment - Most people still travel on foot [homepage on the Internet]. c2004 [cited 2009 Mar 20]. Available from: http://soer.deat.gov.za/themes.aspx?m=361 [ Links ]
2. Road Traffic Management Corporation. Road Traffic Report March [document on the Internet]. c2008 [cited 2009 Apr 03]. Available from: http://www.arivealive.co.za/documents/march_2008_-_Road_traffic_report_-_march_2008.pdf [ Links ]
3. Brysiewicz P. Pedestrian road traffic collisions in South Africa. Accid Emerg Nurs. 2001;9:194-197. [ Links ]
4. Road Traffic Management Corporation. Easter 2009 road traffic report [document on the Internet]. c2009 [cited 2009 May 04]. Available from: http://www.arrivealive.co.za/documents/Easter_2009_Road_Traffic_Report.pdf [ Links ]
5. Jonah BA, Engel GR. Measuring the relative risk of pedestrian accidents. Accid Anal Prev. 1983;15(3):193-206. [ Links ]
6. LaScala EA, Gerber D, Gruenewald PJ. Demographic and environmental correlates of pedestrian injury collisions: A spatial analysis. Accid Anal Prev. 2000;32:651-658. [ Links ]
7. Agran PF, Winn DG, Anderson CL, Tran C, Del Valle CP. The role of the physical and traffic environment in child pedestrian injuries. Pediatrics. 1996;98(6):1096-1103. [ Links ]
8. Ribbens H. Pedestrian facilities in South Africa: Research and practice. Transp Res Rec. 1996;1538:10-18. [ Links ]
9. Moeketsi PN. A holistic approach to the creation of a safe road environment for road users on national roads: A case study. Paper presented at: the 21st Annual South African Transport Conference; 2002 July 15-18; Pretoria, South Africa 2002 [cited 2009 Mar 16]. Available from https: https://repository.up.ac.za/upspace/bitstream/2263/7828/1/043.pdf [ Links ]
10. Ribbens H, Raborifi J. Towards implementing a national pedestrian strategy for South Africa. Paper presented at: the 21st Annual South African Transport Conference; 2002 July 15-18; Pretoria, South Africa. [cited 2009 September 11]. Available from http://www.up.ac.za/dspace/handle/2263/7822 [ Links ]
11. Macozoma S, Ribbens H. Improving infrastructure to promote the safety of non-motorised road users in South Africa. Paper presented at: the 23rd Southern African Transport Conference; 2004 July 12-15; Pretoria, South Africa. [cited 2009 September 11]. Available from http://www.up.ac.za/dspace/handle/2263/5667 [ Links ]
12. Draft National Non-Motorised Transport Policy December 2008 [document on the Internet]. c2008 [cited 2009 Sept 22]. Available from: http://nasp.dot.gov.za/siteimgs/Draft%20National%20Non-Motorised%20Transport%20Policy/DRAFT%20NATIONAL%20NON-MOTORISED%20TRANSPORT%20POLICY.pdf [ Links ]
13. Department of Transport. Moving South Africa [homepage on the Internet]. c1999 [cited 2009 Mar 20]. Available from: http://www.transport.gov.za/search/index.html [ Links ]
14. Pikora T. Systematic pedestrian and cycling environmental scan (SPACES). Survey of the physical environment on local neighbourhoods. Observers manual. University of Western Australia [document on the Internet]. c2002 [cited 2009 Mar 24]. Available from: http://www.activelivingresearch.org/files/spaces_observation_manual.pdf [ Links ]
15. Pikora T, Giles-Corti B, Bull F, Jamrozik K, Donovan R. Developing a framework for assessment of the environmental determinants of walking and cycling. Soc Sci Med. 2003;56:1693-1703. [ Links ]
16. Millington C, Thompson CW, Rowe D, et al. Development of the Scottish Walkability Assessment Tool. Health Place. 2009;15:474-481. [ Links ]
17. San Francisco Department of Public Health. Program on Health, Equity, and Sustainability Urban Health and Place Team Pedestrian Environmental Quality Index - May 2008 [document on the Internet]. c2008 [cited 2009 Apr 03]. Available from: http://dphwww.sfdph.org/phes/HIA_tools/PEQI.pdf [ Links ]
18. Rivara FP, Barber M. Demographic analysis of childhood pedestrian injuries. Pediatrics. 1985;76(3):375-381. [ Links ]
19. Willis A. Human movement behaviour in urban spaces: Implications for the design and modelling of effective pedestrian environments. Environ Plann B Plann Des. 2004;31:805–828. [ Links ]
 Correspondence to:
Patricia Albers
Postal address: PO Box 9258
Centurion 0046, South Africa
email: palbers@csir.co.za
Received: 06 Jan. 2010
Accepted: 11 Aug. 2010
Published: 04 Oct. 2010
This article is available at: http://www.sajs.co.za
© 2010. The Authors. Licensee: OpenJournals Publishing. This work is licensed under the Creative Commons Attribution License.

