Serviços Personalizados
Artigo
Indicadores
Links relacionados
-
 Citado por Google
 -
 Similares em Google
Compartilhar
South African Journal of Science
versão On-line ISSN 1996-7489
versão impressa ISSN 0038-2353
S. Afr. j. sci. vol.105 no.9-10 Pretoria Set./Out. 2009
COMMENTARY
South Africa's gold production and reserves
C.J.H. Hartnady
Research and Technical Director at Umvoto Africa (Pty) Ltd, P.O. Box 61, Muizenberg 7950, South Africa. E-mail: chris@umvoto.com)
The recent underground mass death of more than 80 'illegal miners' or zama-zamas (chance-takers) highlights the parlous state of South Africa's gold-mining industry. Also attracting notice and comment recently is the official acknowledgement1 that South Africa (S.A.) has fallen into second place after China in the world ranking of gold production. At the same time, S.A. continues to claim a first-place country ranking in the world list of gold 'reserves', with a (suspiciously round and, since 2001, unchanging) quantity of 36 000 tonnes (or about 40% of the global total) still in the ground.1 How credible is this latter claim? A critical examination of the full history of gold production from the Witwatersrand, based on figures from the Chamber of Mines of South Africa,2 can provide a fresh perspective, particularly if tools of analysis and forecasting, pioneered in the context of U.S. and global energy reserves by the distinguished American geologist, M. King Hubbert,3,4 are applied.
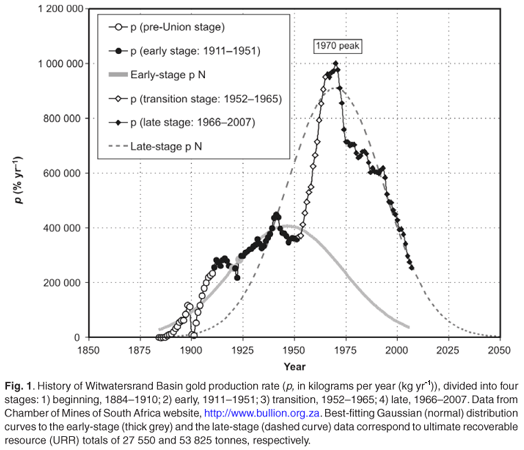
S.A. gold-mining history (Fig. 1) is easily divisible into four distinct stages. The beginning stage, from discovery in the 1880s to the formation of the Union of South Africa in 1910, shows rapid growth and a conspicuous interruption around 1900–1901 caused by the South African (Anglo-Boer) war. The following stage, between 1911 and 1951, is here dubbed 'early', and is characterised by a slower rate of growth with some fluctuations related to key local and global events, e.g. a production fall-off related to the First World War (1914–1918) followed by a sharp decline in 1922 due to the disruptive effects of the Rand Rebellion. After 1942, there is an interval of production decline, probably related to the economic impacts of the Second World War (1939– 1945).

While the annual production rate (conventionally symbolised as p) grew from ~250 tonnes per year (t yr–1) in 1911 to ~360 t yr–1 in 1951, with a brief peak around ~450 t yr–1 in 1941, the cumulative total of production (usually symbolised as q) rose over the same period from 2 380 t to 15 626 t. More significantly, however, the ratio of annual rate to cumulative production (p/q) generally declined from 10.8% yr–1 in 1911 to 2.3% yr–1 in 1951.
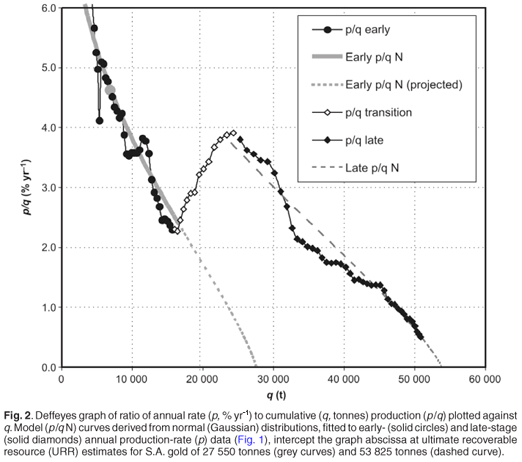
The 'Deffeyes graph' (Fig. 2), named after Ken Deffeyes, Emeritus Professor of Geology at Princeton University, who also developed its application to the analysis of oil production and reserves,5 plots the p/q growth parameter against the cumulative q. It has the interesting property that the declining p/q trend projects towards an intercept on the q axis at 0% yr–1 p/q, representing the 'ultimate recoverable resource'. The mathematical method of projection to this measure may vary, depending on whether the growth rate for the cumulative is assumed to follow a 'logistic' distribution (introduced by the statistician Pierre Verhulst in relation to population growth models) or a 'normal' distribution (introduced by the mathematician Abraham de Moivre).

In the present analysis, taking advantage of a spreadsheet modelling routine developed and made available by David Rutledge of the California Institute of Technology,6 an ideal normal (Gaussian) distribution is assumed and is least-squares fitted to the early-stage p data (grey bell-shaped curve, labelled 'Earlystage p N' in Fig. 1). The corresponding curve in the Deffeyes graph (thicker solid grey curve, labelled 'early p/q N' in Fig. 2) can be projected beyond the 1951 datum to its intercept at 0% yr–1 p/q (thinner dashed grey line) at a q value around 27 550 t.
Had this kind of analysis been undertaken anachronistically in 1951, five years prior to Hubbert's seminal paper,3 the conclusion may then have been drawn that the remaining or residual gold reserve in hitherto exploited (largely the East, Central and West Rand) mines was just under 12 000 t. Future production after 1951 might have been expected to roughly follow the declining trend shown by the grey normal model (Fig. 1), from a peak near 400 t yr–1 in 1946 to around 50tyr–1 only after the turn of the 21st century.
What actually happened after 1951 was quite different. The next, 'transition' stage records a remarkable growth phase, from p of less than 400 t in 1952 to over 950 t in 1965 (Fig. 1). This period is associated with the bringing into production of many mines in the new goldfields of the Carletonville, Klerksdorp, Free State and Evander areas, and with the concurrent introduction of innovative technologies for mining at ever-deeper levels. It is important to recognise that the ground-work for these developments had been laid much earlier, essentially beginning with the 1930s' geophysical exploration over deeply buried extensions of the Wits Basin by Rudolf Krahmann and Oscar Weiss, followed by intensive exploration drilling of target anomalies by various mining houses in the 1940s.7
The Deffeyes chart covering this transition stage (Fig. 2) shows a turn-around from the established declining trend of p/q to a rising trend, bringing p/q close to 4% yr–1 in 1965 as q reached a total of just over 24 000 t. The declining p/q trend resumes after 1966, although p continues to rise at a slower rate to an absolute production peak of ~1 000 t yr–1 in 1970 (Fig. 1). From this high point, the characteristic feature of the 'late' stage (1966present) is established, namely a general decline in p, initially (1970–1975) quite precipitous, interrupted by only short periods of slight trend reversal (1982–1984 and 1992–1993).
In the historical plot of p against time, the statistical fitting of an ideal normal distribution to all late-stage p data (dashed bell-shaped curve, labelled 'Late-stage p N' in Fig. 1) produces a close match to the data from 1993–2007. In the Deffeyes chart the p/q trend for the late-stage data between 1966 and 2007 is inexorably downward. The corresponding normal curve (dashed curve, labelled 'Late p/q N' in Fig. 2) can be projected beyond the 2007 datum to its intercept at 0% yr–1 p/q around 53 825 t. Compared with the early-stage URR intercept, the late-stage URR indicates that the early Wits gold reserves were nearly doubled in the heroic 1952– 1965 transition, increasing by approximately 26 275 t.
Accepting the late-stage intercept as the current URR estimate for gold, the residual reserve after production through 2007 (q = 50 877 t) is only 2 948 t, a little less than three times the 1970 production figure, and much less than 10% of the officially cited 'reserve'.1 The United States Geological Survey (USGS) conservatively defines the reserve as: '...part of the reserve base which could be economically extracted or produced at the time of determination. The term reserves need not signify that extraction facilities are in place and operative. Reserves include only recoverable materials...' [ref. 8, p. 196]. It currently cites South Africa's gold reserve as ~6 000 t [ref. 8, p. 73], rather than the 36 kt 'reserve base' figure generally cited in South African government yearbooks.1 The gold reserve figure derived here is thus less than half of the current USGS estimate, and places South Africa only fourth in world rank, after Australia (5 000 t), Peru (3 500 t) and Russia (3 000 t).8
Failing the appearance, within a very few years, of a second heroic transition of the 1952–1965 kind—and there are no convincing signs of any such development—it must be accepted that the Witwatersrand goldfields are now ~95% exhausted and production rate will fall permanently below 100 t yr–1 within the coming decade (Fig. 1). Given the energy and environmental problems associated with ongoing groundwater control, water-resource contamination by acid mine drainage9 and the possibility of widespread mercury and other factors of pollution caused by illicit underground ore-processing by the zama-zamas, the glory days of South African gold mining appear to have arrived finally at an ignominious end.
There can be no further illusions, maintained by unrealistic expectation of a future fortune, about the seriousness of the present situation. In their various possible forms, the slow-onset disasters of environmental degradation associated with the death-throes of a formerly illustrious industry now pose a serious threat,9 and may ultimately cost far more than the net present value of ~3 000 t of gold. Sooner rather than later, the issue of a strategically managed retreat to environmental and social sustainability has to be confronted.
1. Conradie A.S. (2008). Gold. In South Africa's Mineral Industry 2007/2008, 25th edn, eds M. Mabuza et al., pp. 27–31. Directorate: Mineral Economics, Department of Minerals and Energy, Pretoria. [ Links ]
2. Chamber of Mines of South Africa (undated). Economics and Statistics – Historical Summary: South African gold output since start of operations. Online at: http://www.bullion.org.za/welcome.htm [ Links ]
3. Hubbert M.K. (1956). Nuclear energy and the fossil fuels. In Drilling and Production Practice, pp. 7–25. American Petroleum Institute, Dallas. [ Links ]
4. Hubbert M.K. (1977). Role of geology in transition to a mature industrial society. Geologische Rundschau 66, 654–678. [ Links ]
5. Deffeyes K.S. (2005). Beyond Oil: The View from Hubbert's Peak, p. 202. Farrar, Strauss and Giroux, New York. [ Links ]
6. Rutledge D. (2008). Hubbert's Peak, the coal question and climate change. Eos Trans. AGU, 89(53), Fall Meet. Suppl., Abstract U42A-04. Online at: http://rutledge.caltech.edu/ [ Links ]
7. Robb L.J. and Robb V.M. (1998). Gold in the Witwatersrand Basin. In Mineral Resources of South Africa, eds M.C.G Wilson and C.R. Anhaeusser, chap. 16, pp. 294–349. Council for Geoscience, Pretoria. [ Links ]
8. U.S. Geological Survey (2008). Mineral Commodity Summaries. U.S. Government Printing Office, Washington. Online at: http://minerals.usgs.gov/ minerals/pubs/mcs/2008/mcs2008.pdf [ Links ]
9. Turton A.R. (2008). Three strategic water quality challenges that decision-makers need to know about and how the CSIR should respond. Intended Keynote Address: CSIR Conference 'Science Real and Relevant' (18 November 2008, Pretoria), CSIR Report No. CSIR/NRE/WR/EXP/ 2008/0160/A. Online at: http://www.saimeche.org.za/files/documents/Turton%20CSIR%20water%20paper.pdf [ Links ]
Figures 1 and 2 are reproduced in colour as supplementary material online at www.sajs.co.za


