


Serviços Personalizados
Artigo
 Inglês (pdf)
 Artigo em XML
 Referências do artigo
Indicadores

Links relacionados
-
 Citado por Google
 -
 Similares em Google
Compartilhar

 Permalink
South African Journal of Science
versão On-line ISSN 1996-7489
versão impressa ISSN 0038-2353
S. Afr. j. sci. vol.105 no.5-6 Pretoria Mai./Jun. 2009
RESEARCH LETTERS
Spatial correlation between lightning strikes and whistler observations from Tihany, Hungary
J. ÖsterI, II, III, *; A.B. CollierI, IV; A.R.W. HughesI; L.G. BlombergII; J. LichtenbergerV
ISchool of Physics, University of KwaZulu-Natal, Durban 4041, South Africa
IISpace and Plasma Physics, School of Electrical Engineering, Royal Institute of Technology, SE-100 44 Stockholm, Sweden
IIIDepartment of Astronomy and Space Physics, Uppsala University, SE-751 20 Uppsala, Sweden
IVHermanus Magnetic Observatory, Hermanus 7200, South Africa
VSpace Research Group, Eötvös University, Budapest Pf 32 H-1518, Hungary
ABSTRACT
A whistler is a very low frequency (VLF) phenomenon that acquires its characteristics from dispersive propagation in the magnetosphere. Whistlers are derived from the intense VLF radiation produced in lightning strikes, which can travel great distances within the Earth-ionosphere waveguide (EIWG) before penetrating the ionosphere, and exciting a duct. Field-aligned ducts of enhanced plasma density guide the propagation from one hemisphere to the other. The location of the duct, relative to the strike that causes the whistler, is unknown. Whistler time series from Tihany, Hungary, have been cross-correlated with lightning data obtained from the World Wide Lightning Location Network (WWLLN). The results show that whistlers observed at Tihany originate mainly from lightning strikes in an area with a radius of approximately 1 000 km surrounding the magnetic conjugate point in the Indian Ocean just east of East London, South Africa. A clear diurnal distinction was seen in that the correlation is maximised when the whistler station and the source region are in darkness. This is believed to relate to the diurnal variation of the ionosphere, which becomes more transparent to VLF waves at night.
Key words: correlation, lightning, magnetosphere, space physics, whistler waves
Introduction
A lightning strike emits electromagnetic radiation with a spectrum that extends from a few Hertz to beyond optical frequencies, with the bulk in the very low frequency (VLF) range.1 The VLF signal initially follows the Earth-ionosphere waveguide (EIWG). However, the waves can, during favourable conditions, penetrate the ionosphere and enter the magnetosphere. Since the magnetosphere is occupied by plasma, the waves suffer dispersion and become smeared out in time, forming a characteristic whistling tone. When the waves have penetrated into the magnetosphere there are two options: the waves can follow a duct of enhanced plasma density which is aligned with the magnetic field lines, or take another curved path that does not perfectly follow the field lines.2 In the latter case the waves are likely to be reflected and not penetrate the ionosphere in the opposite hemisphere. Ducted whistlers can re-enter the EIWG through the ionosphere. Figure 1 shows a typical whistler recorded at Tihany, Hungary.
At very low latitudes the inclination of the magnetic field is not favourable for trapping whistlers in ducts. So even though lightning is most prevalent here, whistlers are very rare. At medium latitudes whistlers become far more common. Whistlers recorded in this region have the general characteristics of higher frequencies arriving before the lower frequencies. These whistlers propagate mainly through the plasmasphere. At higher latitudes the whistlers have a distinct nose-frequency. This means that after the initial frequency a signal of both rising and descending frequencies will be recorded. However, due to the rare occurrence of lightning at high latitudes, whistlers are fairly uncommon compared to middle latitudes.
The specific shape of a whistler is determined by the plasma density and strength of the magnetic field in the duct. Whereas the former principally determines the propagation delay, the latter dictates the frequency of minimum delay. Whistlers generated at higher latitudes spend more time in the duct thus experiencing greater dispersion.
The focus of this study was to examine the relationship between whistlers and lightning strikes. This was achieved by performing correlation calculations between a whistler data set from Tihany and lightning strike data obtained from the World Wide Lightning Location Network (WWLLN).
The WWLLN is a system developed during the last decade to detect global lightning strikes.3 The system is designed to detect the signature of lightning strikes in the VLF band. The small attenuation in the EIWG allows the waves to travel thousands of kilometres with minimal reduction in power, thus a limited number of stations are required to achieve global coverage. However, a drawback of using the VLF portion of the wave is that the wave-front is smeared out into a wave-train, or spheric. This creates a systematic error if using a threshold amplitude for registration since the amplitude is inversely dependent to distance from source. This makes it hard to determine an accurate time of arrival at the recording stations and thus the location of the lightning strike will be biased. The most efficient solution to this problem, which has been implemented in WWLLN, is to record the time of group arrival (TOGA).3 This method has the advantage of enabling WWLLN to register lightning in the VLF band with an accuracy that only mediumfrequency band measurements could previously attain.
Data
The whistler data available for this study were collected between 27 February 2002 and 18 May 2005. Consequently lightning data from the same period were used.
WWLLN data
In 2004 the WWLLN consisted of 18 stations,1 having increased from only 11 stations in 2003.4 The majority of these stations were situated in Japan, Taiwan, Singapore, Australia and New Zealand. This strongly affected the global efficiency of the system and created a significant bias in lightning registered in this part of the world, plus a tendency to favour relatively powerful lightning strikes. However, this discrepancy has gradually been removed with the expansion of the WWLLN. During the time that the whistler statistics used here were collected, WWLLN had a global efficiency of approximately 2%.1 Despite these limitations the WWLLN registers an immense amount of lightning. The number of records in the database used here is in the order of one hundred million, which is sufficient to produce valid and accurate results from a statistical point of view. The TOGA method was fully implemented on 1 August 2003. Before this date, the location accuracy was estimated to have a global mean of 30 km.4 After the TOGA implementation the estimated mean accuracy improved to 3.4 km.1
Whistler data
The whistler data were obtained from a whistler station situated at Tihany, Hungary (46.89EN 17.89EE, L = 1.81). The magnetic conjugate point of Tihany is 33.45ES 28.34EE, which is in the Indian Ocean just off East London, South Africa. The whistler data consisted of a set with 681 107 events. The Automatic Whistler Detector (AWD) has been under development since the beginning of the decade. Its algorithm has a number of tunable parameters, for example trigger levels and time separation, which determine whether or not a given event is identified as an authentic whistler or not. This mechanism is based on a two-dimensional image analysis and it has a weighted-average efficacy of approximately 90%.5 Furthermore, the efficiency of this station is continuously improving as the algorithm is updated, although the station is still considered to be operating in an experimental mode. During the period of this analysis the station had one major breakdown which lasted from 25 August to 30 October 2004.5
Correlation
Definition
The relationship between the two data sets x (lightning) and y (whistlers) was determined by calculating the Pearson product-moment correlation coefficient. The correlation coefficient, r, will always obtain a value between –1 and +1, the latter corresponding to a perfect positive correlation. If r = 1 then the data in y is always moving in the same direction as the data in x which would correspond to, for example, the whistler rate increasing at the same time as the lightning strikes. An r = 0 would correspond to no correlation at all—the lightning rate and whistler rate are independent. Negative r corresponds to the two data sets moving in opposite directions, which means that if the number of lightning strikes is increasing then the number of whistlers is decreasing. The correlation results are interesting both as an absolute value and also on a relative basis. That is, we are also interested in the relative difference in correlations between selected areas of the world.
Methods
The input raw data consisted of a large list of occurrence times (UTC) of the whistlers and an array containing longitude, latitude, and time of lightning. The time between our starting point on 27 February 2002 and the end point on 18 May 2005 was divided into intervals of Δt = 30 s giving us just over 3.3 million intervals. For each interval we recorded whether whistlers occurred or not. A similar approach was taken with the lightning data. However, the spatial dependence in these data was first removed by sorting the strikes into cells with sides of 1°. For each particular cell, the lightning data was divided into the same time intervals as the whistler data. We then had two time series which were correlated, and we obtained the correlation coefficient for each cell on the globe, producing a correlation-coefficient map.
The WWLLN is assumed to more or less function at all times since there are numerous stations in this network. Days when the Tihany whistler station was not functioning, for whatever reason, have been identified and all data for these days removed, in order to avoid false correlation. This was achieved by identifying days when no whistlers were registered. On average, 577 whistlers were received at Tihany every day; in the winter months the average rate decreased to about 100. So it is considered very unlikely that there would be days without whistlers.
Due to the low efficiency of the WWLLN, the data in the time intervals were normed to either one or zero. That is, if there was activity in an interval, regardless of how much, the number of registered events was set to one. If there was no activity, that interval would take the value of zero. This approach implies that our results display correlations based on similarities in activity, but not on the basis of how much activity, which, at least partly, circumvents the WWLLN inefficiency. When looking at the individual time intervals this simplification means that only four possibilities of matching between the two series can occur. If there were both whistler and lightning registrations for a specific time interval, this interval contributed towards a positive correlation. If there was neither whistler nor lightning registration for a time interval, this also contributed towards a positive correlation. This approach would suppress the, mainly tropical, regions from obtaining a false positive correlation due to an abundant occurrence of lightning. If there was lightning registered, but not whistlers (or vice versa), this would contribute towards a negative correlation.
The exact time gap between a lightning strike and detection of a whistler can vary. The time spent in the magnetosphere is in the order of seconds. The size of the time interval must thus be large enough to minimise the risk of a whistler being detected in a different interval to the causative lightning discharge. However, the interval must also be small enough to avoid correlation between lightning strikes and whistlers generated by other lightning strikes. This is a tricky balance and a compromise must be made. If smaller time intervals are to be used it might be necessary to introduce a time lag, i.e. a delay in the whistler series compared to the WWLLN series.
The selection of cell size is based upon the fact that a grid selection that is too coarse won't produce good enough resolution. However, selecting a resolution that is too high, will result in a lower correlation value due to the decreased number of lightning events in each cell, and also increase the risk of lightning being recorded in the wrong grid cell due to the limited location accuracy in WWLLN. A compromise is desirable here as well. With increased WWLLN efficiency smaller cell sizes should be considered for improved validity of the results.
Results
The correlation results, presented in Fig. 2, clearly have a maximum around the magnetic conjugate point of Tihany. One conclusion that can be drawn is that the source region surrounding the magnetic conjugate point for Tihany has a radius of approximately 1 000 km. As might be expected, a weaker positive correlation is also obtained from the rest of southern Africa. Negative correlation is obtained north of the equator due to the seasonal difference in the occurrence of lightning.
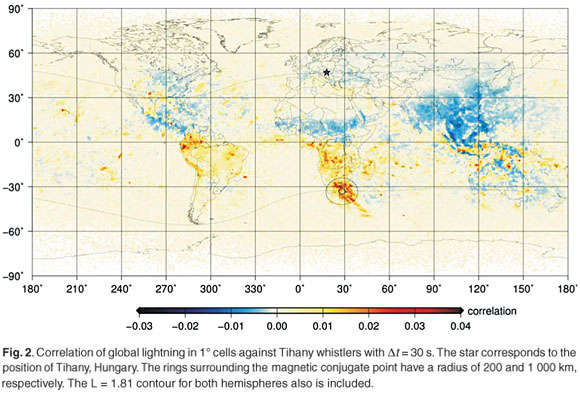
Another pattern seen is a 'tail' attached to the source region surrounding the conjugate point, pointing toward the southeast. This tail is actually parallel to the horizontal projection of the magnetic field, suggesting that the energy from a lightning strike has a higher probability of exciting a duct when aligned in this way. The lack of such a tail pointing northwest from the source region might suggest that the inclination of the magnetic field also plays a role.
Figure 3 presents the correlation calculated for three-hour intervals, giving an indication of what happened to the correlation coefficient on a diurnal basis. When analysing the graphs it was evident that there was a maximum correlation during the hours when Tihany and its conjugate point were in darkness. The positive correlation for the area surrounding the magnetic conjugate point increased between 15:00 and 18:00 UTC, reached a maximum between 21:00 and 00:00 UTC, and then decreased, becoming almost non-existent. Most whistlers are indeed received in darkness, which is believed to relate to the diurnal variation of the ionosphere which becomes more transparent to VLF waves at night. Since there was a strong correlation with the conjugate region during the same time it seems reasonable to draw the conclusion that most of these whistlers indeed originated from that region.
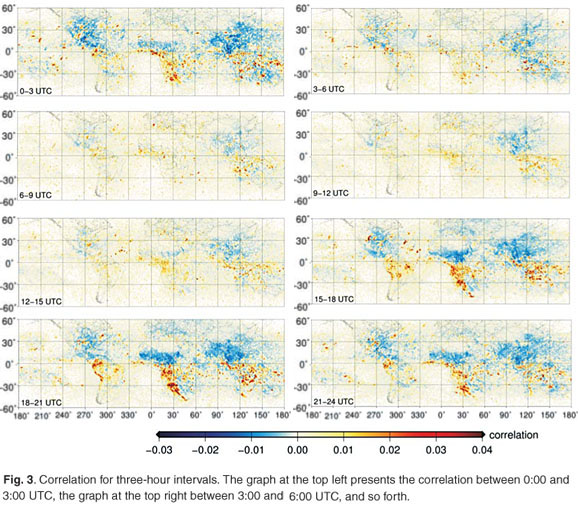
The most surprising result is the high positive correlation obtained over equatorial South America, which is evident in both Figs 2 and 3. Two reasons for this result were considered: 1) VLF pulses originating from these lightning discharges can travel for a long distance in the EIWG before entering a duct around the conjugate point. If the traces were caught by the magnetic field at some other place on Earth and the whistler then travelled a long distance after re-entering the atmosphere a different time pattern would be expected in Figure 3. The tendency of WWLLN to favour relatively powerful lightning strikes implies that this is not completely unlikely. 2) Lightning activity over South America, due to the time difference with Africa, happens to increase at the same time of day as darkness envelops the source region. That would mean that the results have no physical meaning. Further investigation on this question would be desirable. There were also areas of positive correlation over the Maritime Continent.
Conclusions
In this article, whistler time series from Tihany, Hungary, were cross-correlated with data from the WWLLN. The data from Tihany generated a clear correlation image which showed that the dominant source region surrounding the conjugate point in the Indian Ocean just east of East London in South Africa had a radius of approximately 1 000 km. Positive correlations were also obtained from the rest of southern Africa and some regions of South America and the Maritime Continent.
The results in this article cannot be taken as evidence that all whistlers observed at Tihany were generated around the conjugate point. However, it indicates that at least a major portion originated from there.
The authors would like to thank the various WWLLN hosts for keeping this global network functional. Also, the reviewers are acknowledged for scrutinising this paper.
1. Rodger C.J., Brundell J.B. and Dowden R.L. (2005). Location accuracy of VLF World-Wide Lightning Location (WWLL) network: post-algorithm upgrade. Ann. Geophys. 23, 277–290. [ Links ]
2. Helliwell R.A. (1965). Whistlers and Related Ionospheric Phenomena, pp. 43–51. Stanford University Press, Stanford. [ Links ]
3. Dowden R.L., Brundell J.B. and Rodger C.J. (2002). VLF lightning location by time of group arrival (TOGA) at multiple sites. Journal of Atmospheric and Solar-Terrestrial Physics 64, 817–830. [ Links ]
4. Rodger C.J., Brundell J.B., Dowden R.L. and Thomson N.R. (2004). Location accuracy of long distance VLF lightning location network. Ann. Geophys. 22, 747–758. [ Links ]
5. Lichtenberger J., Ferencz C., Bodnár L., Hamar D. and Steinbach P. (2008). Automatic whistler detector and analyzer system: automatic whistler detector. J. Geophys. Res. 113, A12201, doi: 10.1029/2008JA013467. [ Links ]
Received 23 October 2008. Accepted 22 May 2009.
* Author for correspondence E-mail: jonas.oester@live.se

