


Serviços Personalizados
Artigo
 Inglês (pdf)
 Artigo em XML
 Referências do artigo
Indicadores

Links relacionados
-
 Citado por Google
 -
 Similares em Google
Compartilhar

 Permalink
South African Journal of Science
versão On-line ISSN 1996-7489
versão impressa ISSN 0038-2353
S. Afr. j. sci. vol.105 no.5-6 Pretoria Mai./Jun. 2009
REVIEW ARTICLES
Marine fisheries monitoring programmes in South Africa
L. Hutchings*; C.J. Augustyn; A. Cockcroft; C. Van der Lingen; J. Coetzee; R.W. Leslie; R.J. Tarr; H. Oosthuizen; M.R. Lipinski; M.R. Roberts; C. Wilke; R. Crawford; L.J. Shannon; M. Mayekiso
Marine and Coastal Management, Department of Environmental Affairs and Tourism, Private Bag X2, Rogge Bay 8012, South Africa
ABSTRACT
South Africa was an early leader in multidisciplinary studies of marine resources, particularly with the Benguela Ecology Programme in the 1980s and 1990s and catch records are available for some species dating back more than a century. Resources data have focused on trends in catches, fishing effort and changes in distribution and abundance of harvested resources, which often account for a major part of the structure and functioning of marine ecosystems. Data have been collected by means of fishery-dependent and fishery-independent survey techniques appropriate to each particular stock and analysed using traditional single species stock assessment techniques. The data are complemented by comprehensive information on the environment and top predators and have been analysed using trophodynamic models such as Ecopath with Ecosim. Future approaches include a shift to an ecosystem approach to fisheries monitoring and management, in an attempt to reconcile utilisation and biodiversity conservation objectives. Despite these scientific achievements, the single species approach to the management of most resources still persists, with only limited interactions between competing species or predators and prey being formally taken into account when modelling the stock dynamics and providing management advice to the authorities.
Key words: Benguela, resources, long-term monitoring, EAF
Introduction
Marine and Coastal Management (MCM), now a branch of the South African Department of Environmental Affairs and Tourism, and its predecessors in name, the Sea Fisheries Research Institute, the Division of Sea Fisheries and the Government Marine Biologist, have been collecting fisheries information unevenly over the past 112 years. Initially, Gilchrist collected comprehensive data in the period 1897–1907,1 followed by a decline until there was an improvement in the period 1927–1931 when unpublished Fishing Harbour Reports of the Department of Mines and Industries were discovered in the MCM archives. Since 1950, staff and facilities were greatly expanded, in particular by the availability of research vessels. Much of the incentive for data collection and analysis has focused on providing advice to managers for sustainable fisheries management goals, with catch and effort limits being set, together with closed seasons, size limits and bag limits, to ensure stocks are maintained at optimal limits and not depleted. More recently, conservation of marine biodiversity and assessing decadal environmental changes have become important subsidiary targets, particularly with the introduction of an ecosystem approach to fisheries management (EAF).2
South Africa harvests several wild marine resources, which require careful management because of uncertainties relating to productivity and distribution of populations. Initially fisheries were started in the 17th century for top predators such as whales, seals and seabirds (for eggs and guano).3 The rich offshore fishing grounds for hake on South Africa's continental shelf were discovered only early in the 20th century, as powered vessels became available. Inshore fisheries such as west coast rock lobster line fishing and beach-seine netting occurred on a small scale, but over the next few decades, and particularly since 1950, fisheries escalated into full-fledged industrial activities. Considerable international fleet activity occurred in the 1960s and early 1970s and resulted in heavy fishing mortality being exerted upon several stocks, including hake. Declaration of the exclusive economic zone limit of 200 nautical miles in 1977 gave some measure of protection from excessive international fishing effort. Generally, offshore stocks, such as hake and pelagics, have been through severe declines from overfishing but have staged subsequent recoveries; however, several inshore stocks, such as west coast rock lobster, abalone and most linefish species, have remained or become severely depleted. Rock lobster experienced a decline in growth rate and a southward shift in distribution as low oxygen waters on the west coast increased. They consumed many sea urchins in the southern extreme of their range expansion, depriving the juvenile abalone of protective habitat beneath the sea urchin spines.4 Heavy legal and illegal fishing pressure was exerted on abalone and linefish. Other resources, such as squid, have erratic catches but display few long-term trends, while sole have remained stable over decades.
The South African total landed catch varies between 500 000 and 800 000 tonnes whole wet weight per annum, worth some R4.5 billion in 2005. More than half the value is derived from the demersal fishery, principally hake, which constitutes 60–80% of the landed catch in this sector. Highest in tonnage landed and second most valuable resources are the pelagic fish (sardines, anchovy and redeye), where only a small proportion of the catch is used for direct human consumption. The squid, rock lobster, linefish and abalone yield lower tonnages but relatively high value. The South African fishery is only a small proportion of the country's GDP, but has an important role as a provider of employment in arid coastal regions, where alternative employment options are scarce, and as a source provider of protein without using excessive volumes of scarce fresh water. The sea has long been regarded as a commons, but because only limited-rights holders may access the resources for commercial purposes (on the grounds of sustainability), and fishers who do not receive a right protest vociferously (as they see their traditional rights to the commons removed), fisheries have attracted a disproportionate share of controversy, compared with forestry, mining or agriculture.
For wild resources which are hidden from view, assessment of the status of stocks is difficult. Stock status of individual species can be assessed from trends in the fishery itself, in the form of total catches and trends in catch per unit effort, but these are biased by changes in fishing technology, fisher behavioural changes, shifts in distribution of the resource and problems with the accurate assessment of landings. Multiple species targeting, bycatch and discards introduce additional inaccuracies. A variety of fishery-independent methods of assessing the population strength have been invoked in nearly all the major resources to overcome these difficulties. As an ecosystem approach to fisheries has been adapted, the effects of fishing on associated and dependent species, and on the environment, have become more important. As the most abundant, larger organisms decline under heavy fishing pressure; changes in the structure and energy flow in ecosystems may occur, with less valuable and smaller species, lower in the trophic food web, becoming more abundant. Commercial fisheries data are primarily used as a means of controlling catch or effort to ensure sustainable fisheries, but do provide an opportunity to derive indices of the status of the major components and their associated trophic flows at higher levels in the ecosystem. Changes in weather and climate may also play a role in altering marine foodwebs and it is difficult to untangle the anthropogenic and natural effects. Marine resources in South Africa are still largely assessed and managed as single stocks, independent of prey, competitors and predators, although there is a steadily increasing trend towards considering multiple species.2
Table 1 indicates the current generic monitoring efforts for selected resources. Bottom trawls are used to survey demersal fish, acoustics and mid-water trawls for pelagic fish, traps for rock lobster, and diving surveys for abalone. Trends in the population status allow recommendations to be made to maintain stocks at or above certain target levels or to rebuild depleted stocks to a target level. This is done through a combination of input controls such as a total allowable effort, gear restrictions, closed areas and seasons or through output controls, such as a total allowable catch, or bycatch precautionary upper catch limit, daily bag and size limits. These may be broken down further into individual rights allocations, which is beyond the scientific scope of the recommendations. The scientific objective is to maintain sustainable levels of the resource, which means being able to remove approximately the same yield of a resource with the same amount of effort in future decades. Operational management procedures are developed5 whereby the monitoring data are analysed in a prescribed manner after testing the procedure across a wide range of scenarios with computer simulations for the underlying dynamics of the target population. The output from such procedures is generally a modelled stock status, a recommendation of a total allowable catch and sometimes a bycatch. The procedures are slowly incorporating multiple species but as yet no environmental parameters. Butterworth and Plaganyi5 consider the high costs of additional monitoring and the increased uncertainty in additional parameters to be severe obstacles to adaptation of an ecosystem approach to fisheries management. In the interests of brevity, only hake, pelagic fish and rock lobster will be considered in detail, with brief notes on other fishery sectors.
Pelagic resources
Introduction
South Africa's purse-seine fishery for small pelagic species is the country's largest, with average landings of around 380 000 tonnes per annum over the period 1950 to 2005 and more than half a million tonnes annually over the past five years. Juvenile (approximately six months old) anchovy (Engraulis encrasicolus) and adult sardine (Sardinops sagax) are the major targets of the fishery and together account for around 75% of total landings, but adult round herring (Etrumeus whiteheadi) are also targeted, and juvenile horse mackerel (Trachurus trachurus capensis), sardine and round herring are taken as bycatch in anchovy-directed fishing operations. Anchovy and sardine have alternated as the dominant component of the fishery, although in recent years landings of the two species have been similar (Fig. 1). Seventy per cent of the anchovy catch is taken off the west coast and comprises young fish migrating from the west coast nursery grounds to the south coast spawning grounds, whereas sardine have been caught off the west, southwest and south coasts during different periods of the fishery.
Anchovy and sardine stocks show a high degree of inter-annual variability in recruitment strength, which results in high variability in population size. Additionally, decadal-scale variability in population size is also observed, of sardine in particular,6 which may be linked to long-term environmental forcing. This high variability means that accurate estimates of recruitment strength and population size are required annually in order to set total allowable catch levels. Additionally, high bycatch of juvenile sardine with anchovy complicates management and the operational management procedure (OMP-04),7 currently used to manage South Africa's pelagic resources, represents a trade-off between catches of the two species. The operational management procedure, and the anchovy and sardine assessments models, require both fishery-dependent data and fishery-independent data as input, both of which are listed in Table 1 and more fully described below.
Fishery-dependent data
Information collected from pelagic landing sites includes the catch weight, species composition, and catch location (grouped into 10 × 10 mile blocks). Catch weight and numbers data of the major species are used to ensure that South Africa's pelagic resources are used in a sustainable manner (i.e. the recommended total allowable catch, total allowable biomass or precautionary upper catch limit are not exceeded). Since OMP-04 has been designed to maximise catch while minimising risk, it is critical that catches are accurately monitored and reported. Additionally, anchovy catch weight data (both in tonnes and converted into numbers of fish), and the ratio (by weight) of juvenile sardine to anchovy as observed in commercial catches during May, are both used as input in the operational management procedure in the mid-year determination of the revised anchovy total allowable catch and sardine total allowable bycatch. Catch location data are used to monitor spatial trends in fishing patterns and from those infer distribution patterns of pelagic species. For example, anchovy, round herring and sardine appear to have increased substantially in their distribution ranges between mid- to late 1980s and the 1990s8 and, since 1997, the average location of sardine catches has shifted further eastwards each year.9 Additionally, these data may be used in conjunction with other data sources to derive spatial ecosystem indicators such as an index of spatial biodiversity and the exploited fraction of the ecosystem surface for the pelagic fishery.10
Data on fish length, weight, sex, gonad maturity stage and gonad mass, otoliths (for age determination), and condition (equivalent to body lipid content) are collected for sardine from commercial catch samples. Catch-at-age and weight-at-age data for both species are generated from age–length keys derived from commercial catch samples, and are required for the stock assessment models.11,12 Biological data have been used to construct time series of indicators that characterise the state of the target stock and the fisheries they support. For example, some sardine biological parameters have shown significant changes over the past 50 years that appear to be more strongly related to stock size than to environmental variability, indicating a density-dependent response by this stock.13 The mean length of anchovy and sardine taken in commercial catches has been investigated on a spatially disaggregated basis since 1987, as has the annual exploitation rate (a measure of fishing intensity) for sardine since 1984.14 Seasonal cycles and interannual trends in sardine lipid content, and spatial variability therein, have also been examined;15 this indicator is important in an ecological context because the reproductive output of small pelagic fish depends to a large degree on body lipid content. In addition to providing information that adds to our knowledge and understanding of the biology and ecology of South Africa's pelagic resources, these and other indicators may also be useful in facilitating the development of an ecosystem approach to fisheries, and may also promote sustainable fisheries as they could provide a basis for decision-making. Gaps in the biological data time series include the lack of data for anchovy.
Observers on boats have been deployed in the pelagic fishery since 1999, to provide data relating to catch weight and locality, catch composition, and length frequencies of important species, in addition to collecting some biological data. Because observers monitor each haul, their data have an increased spatial and temporal resolution compared to that collected by inspectors and scale monitors, who collect data from one sample per landing, regardless of the number of hauls that that landing represents. Observer data have been used to validate catch data (primarily catch weight and species composition) recorded by fisheries inspectors at landing sites, and to compare the fishing behaviour of observed versus unobserved vessels. This latter analysis has revealed that vessels carrying observers show significantly higher catch rates compared to those that do not have observers over part of the year, which is suggestive of dumping (because of high bycatch levels and/or fish of an inappropriate size for canning) of unwanted catch by vessels without observers.16 The most significant gap in the observer data pertains to the low coverage of the pelagic fleet, which is currently 8% of fishing trips, and should be increased to at least 50% to ensure improved levels of reporting.
Vessel monitoring systems are presently on board every pelagic vessel and provide data on location (with a temporal resolution of six hours), but are currently only used for compliance purposes to ensure that vessels do not fish in restricted areas.16 Should VMS data be made available at a higher temporal resolution (such as half-hourly) for scientific analysis, the high level of spatial resolution that they could provide (i.e. the exact location of each haul as opposed to being recorded in 10 × 10 mile blocks) on fishing operations could be usefully compared to environmental features (such as sea-surface temperature, ocean colour, and mesoscale features such as fronts and eddies) remotely sensed via satellite. Such comparisons can be used to further estimate environmental preferences of local pelagic species,17 which could be used to identify probable fishing grounds as has been done for anchovy (Engraulis ringens) off Chile.18
Fishery-independent data
A hydroacoustic survey programme to estimate pelagic fish biomass was initiated in 1983. These surveys cover much of the continental shelf around South Africa, although the spawner biomass survey has a greater offshore coverage than does the recruitment survey. The first reliable acoustic estimate of anchovy spawner biomass was obtained in November 1984; annual biomass estimates of anchovy and sardine spawner biomass have been made every November since then, resulting in an uninterrupted time series that spans 22 years.19,20 The collection of ichthyoplankton samples during spawner biomass surveys permitted estimates of anchovy spawner biomass using the daily egg production method (DEPM), and between 1984 and 1993 concomitant acoustic and DEPM estimates were made which were combined to obtain a single, unbiased measure of population size. The DEPM estimates and acoustic survey estimates for anchovy spawner biomass showed good agreement over a period of ten years,21 leading to discontinuation of the DEPM due to the additional work load required to produce two essentially similar biomass estimates. Ichthyoplankton data have also been used to identify the location (and changes therein) of the principal anchovy and sardine spawning habitat (see below), and to characterise the spawning habitat of these and other pelagic species.22,23 Such characterisations are used in models of spawning habitat dynamics24 and attempts to predict the location of spawning habitat from remotely-sensed data.25 In addition to estimates of spawner biomass, recruitment strengths of anchovy and sardine have been measured every winter (May/June) since 1985. A third survey programme, initiated in 1992 and known as the pelagic pre-recruit surveys, has been directed at early life history stages (late larvae and pre-recruits), and initially aimed to predict forthcoming anchovy recruitment strength26 by means of a survey covering the west coast nursery area. This aim was not achieved, however, and pre-recruit surveys are now exploratory and/or designed to answer specific ecological questions about pre-recruits.
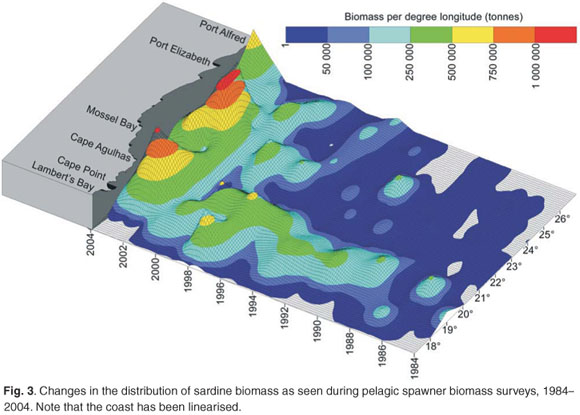
Spawner biomass and recruitment estimates of anchovy and sardine have shown large fluctuations since 1984 (Fig. 2); such large fluctuations in biomass and recruitment are difficult to explain and predict, making direct methods of observation such as the acoustic surveys ideal for monitoring population size changes over relatively short time frames. Results from the two acoustic surveys have served as key inputs for the management of anchovy and sardine, and have enabled optimal harvesting of these resources over more than two decades, despite large and unpredictable annual fluctuations in biomass. The acoustic survey programme has also been important in highlighting distributional changes and migratory behaviour of anchovy and sardine (Fig. 3), particularly in areas not frequently fished by the industry. Some of the prominent features have included a major shift in the distribution of sardine, particularly in recent years, and changes in sardine spawner distributions have been accompanied by changes in location of their principal spawning habitat9 (Fig. 3). Additionally, ichthyoplankton data collected during spawner biomass surveys have suggested that the location of the principal anchovy spawning area have also changed through time27 (Fig. 4).
A wealth of information on temperature, salinities, oxygen and plankton is currently collected during fishery-independent hydroacoustic surveys of pelagic resources, but several important gaps remain. For example, the acoustic surveys provide extensive spatial coverage but have poor temporal resolution in that they occur only twice per year. Hence fish movement and within-season changes in distribution patterns cannot be examined. Additionally, the offshore extent of acoustic surveys would have to be expanded if accurate estimations of round herring (and other important species such as mesopelagic fish) are to be obtained. A better understanding of fish behaviour and the factors (both environmental and inherent) that influence this is also required, as behavioural traits such as diel vertical migration, near-surface schooling and vessel avoidance are likely to significantly impact on biomass estimations.
Cape hakes (Merluccius capensis and M. paradoxus)
Introduction
Two species of Cape hake occur off South Africa: shallow-water Cape hake (Merluccius capensis) and deep-water Cape hake (M. paradoxus).28 In both species there is a tendency for the mean size to increase with increasing depth; thus older (larger) M. capensis co-occur with, and prey upon, younger (and smaller) M. paradoxus. The two species are morphologically similar and are marketed as a single commodity, therefore statistics derived from the commercial fishery (e.g. catch and effort) are not available for the two hake species separately. The demersal fishery started in 1899 with a single steam trawler, and a time series of catches is available from 1917 (Fig. 5). Annual catches remained relatively small until after the Second World War. Annual catches escalated in the early 1960s with the arrival of foreign vessels. The declaration of the 200-nautical mile exclusive economic zone around South Africa in 1977 was followed by the exclusion of almost all foreign effort and a gradual recovery of the resource. Hake are currently fished in the deep-sea hake trawl, inshore south coast trawl, longline and handline fisheries.

Biomass surveys designed primarily to provide a time series of abundance indices of the two hake species and important bycatch species are conducted three times per year (Fig. 6) with the same standard methods. They do not provide direct estimates of the total biomass in absolute terms but track the relative change in biomass (trends) over time. Innovative hake research was undertaken under a BENEFIT/BCLME project to investigate the transboundary nature of hake stocks, in which scientists from Namibia, South Africa and Norway addressed compatibility between biomass surveys conducted in the region; possible origin and migration of M. paradoxus from South Africa to Namibia; and aspects of the early life history of Cape hakes. Hake eggs and larvae were collected and identified to species using genetic techniques. Detailed studies have also been done, of length, abundance progressions through time and space and age of young hakes. It would appear from preliminary unpublished information that two separate spawning populations of shallow-water hake (M. capensis) are found in Namibia and on the Agulhas Bank, with a shared nursery ground on the west coast, while M. paradoxus, the deep water hake, spawn in South African waters in the southern Benguela, have a nursery ground on the west coast, but migrate to feeding areas in both Namibia and South Africa and are therefore also a shared resource requiring regional management.
The Cape hakes are managed as an output control fishery, with a set total allowable catch. The annual total allowable catch recommendation is based on an operational management procedure that incorporates fishery-dependent information (catch, effort, catch per unit effort and catch-at-length) and fishery-independent data (research survey biomass indices, age/length keys, fecundity, depth/hake species ratio relationship, growth and maturity parameters). The annual total allowable catch for the Cape hakes is currently 150 000 tonnes, close to the maximum sustainable yield.
Fishery-dependent data
Annual landings: estimated total annual landed catch (species combined) are available from 1917 to the present. From 1917 to 1960, estimates for west and south coasts were combined, while separate estimates are available from 1960 to the present. From 1978, landings data are available on a trawl-by-trawl level, including depth and position of the trawls. The finer resolution post-1978 allows the application of a depth/species ratio relationship to estimate landings by hake species. From 1978 estimates of annual landings of bycatch are also available from unpublished data records in MCM.
Catch per unit effort (CPUE): catch rate data are available only for the landed catch (i.e. post onboard sorting and discarding). Time series of CPUE standardised using crude power factors is available from 1955 (west coast: t day–1) and 1969 (south coast: t h–1) for the offshore trawl fleet. Time series standardised using modern general linear modelling (GLM) methods are available (for each coast: kg min–1) from 1978 (species combined and species disaggregated) for the offshore trawl fleet. CPUE series are also available for the inshore fleet on the south coast from 1978, although there are concerns over the accuracy of the recorded effort for this fleet and these data are not regarded as being reliable. Catch and effort data are available for the longline fleet from 1994, but a time series of standardised CPUE has not been estimated (MCM, unpubl. data records).
Catch-at-length (CAL) data are available from 1968 (west coast) and 1975 (south coast) separated by fishery.
Age/Length keys (ALK) are available from 1977. However, application of these keys to the CAL data to produce catch-at-age (CAA) reveals a worrying lack of cohort structure, raising serious concerns with respect to the accuracy of the ageing methods employed. Investigation into different ageing methodology over the last two years has failed to resolve this issue.
Observer data provide estimates of catches and discards, as opposed to landings. However, there are problems with estimation of total discards per trawl, as the single observer aboard a fishing vessel can monitor either only the discards, or the retained catch, but not both.
Vessel monitoring systems (VMS): All vessels have been required to carry operational VMS since 2000. These data provide a means of monitoring the activities of vessels and of validating the catch positions reported by the vessels. However, due to administrative and legal (confidentiality) issues, the VMS data have not been made available for such validation to be undertaken. The VMS data are currently used only to ensure that vessels do not enter areas closed to fishing.
Fishery-independent data
Biomass surveys using the swept area method on the R.S. Africana have been conducted since 1986. West coast: summer and winter surveys from 1986–1990, summer only from 1991. South coast: 1986–1987 spring only; 1988–1989 autumn only; 1990 onwards both spring and autumn. The trawl gear was changed in April 2003, which has broken the time series. A calibration factor has been calculated for hakes to enable comparison of the two time series. However, the calibration factor for M. capensis appears to be unrealistic. Further work is being undertaken to clarify this.
Data available from the surveys include: catch (by weight) per fish and cephalopod species per station, relative estimates of abundance for species caught, and catch-at-length for all commercially-important species. For selected species, age material is collected as well as information on maturity and diet. An age-structured production model (Fig. 7), based on a combination of fishery-dependent and fishery-independent surveys, provides estimates of the trends in the underlying spawner biomass, which indicates that the stock is currently at roughly 10–15% of pristine values (original population size) for deep-water hake and 50% for shallow-water hake.29,30
West coast rock lobster
Introduction
West coast rock lobster (Jasus lalandii) are distributed generally close to shore from about 23°S, just north of Walvis Bay in Namibia, to about 28°S, near East London in South Africa.31 Commercial densities are, however, encountered only along the west coast from about 25°S in Namibia to slightly east of the Cape of Good Hope in South Africa. The commercial fishery, which began in the early 1800s, is currently managed via a total allowable catch, minimum size limit, closed seasons and defined fishing zones and areas. Although catching by hoop nets from small boats in shallow water was the most important harvesting method in earlier years, catches by traps from larger vessels in deeper water now accounts for 75% of the annual catch.31
The development of the J. lalandii fishery and the trends in commercial landings are well documented.31–33 Despite the introduction of a minimum carapace length limit of 89 mm in 1933 and a tail-mass production quota in 1946, catches declined during the 1960s, probably because of over-fishing. In 1970, the production quota was cut to the tail-mass equivalent of about 5 513 tonnes and the 89 mm size limit was applied everywhere. The tail-mass production quota was replaced by a whole lobster (landed mass) quota, and management by means of total allowable catches was introduced in the late 1970s. One of the most significant factors affecting the fishery for J. lalandii in the past two decades was the sharp decline in somatic growth rates at the end of the 1980s that resulted in decreased recruitment to the component of the resource above the minimum size.34–37 As a result of poor catches of lobster of legal size and concerns regarding increased discard mortality due to increased handling of undersized lobsters, the minimum size limit was, in essence, reduced from 89 to 75 mm carapace length between the 1991/92 and 1993/94 seasons31,33 and has remained unchanged since then. During this period, the total allowable catch decreased from 3 790 tonnes in 1990/91 to 2 400 tonnes in 1992/93 and further to 1 500 tonnes in 1995/96. The total allowable catch has increased steadily since then, reaching 3 527 tonnes in 2004/05, although decreasing slightly to 3 174 tonnes in 2005/06.
Fishery-dependent data
Estimates of total catch (whole weight) are available since 1891 (Fig. 8). Effort (number of traps used or bakkie days fished) and therefore CPUE data are available since 1974/75. While landed catch was carefully monitored, the reporting of applied effort data was not strictly enforced. The introduction of a new data collection system in the early 1990s and a more rigorous approach to ensuring data compliance have ensured the accuracy of the more recent information (Fig. 8). The catch data are used to ensure that both the overall total allowable catch and individual allocations are not exceeded, a prerequisite for sustainable utilisation. Catch, effort and CPUE are used as inputs into stock assessment models. The commercial CPUE is also used as a relative abundance index for the resource and as an input into the operational management procedure used to set the annual total allowable catch.
All west coast rock lobster trap vessels have been required to carry a VMS on board since 2002. Although these data have been used mainly for compliance purposes (ensuring fishing in correct designated zones and monitoring of activity in restricted areas), their use in fine-scale spatial monitoring of fishing effort is currently being investigated.
Biological data
Biological information including length frequency, sex ratio, reproductive state, moult stage, fecundity, condition factor and annual male somatic growth rate have been collected on an ongoing basis in most of the important fishing zones during both commercial operations and fishery-independent surveys. Time series of biological indices assists in the interpretation of observed fishery trends and are also used as inputs to stock assessment models. Male somatic growth is also a direct input in the operational management procedure used to set the annual total allowable catch.
Observers on board commercial vessels and at landing sites are used to monitor both catch and biological data. This information is used to corroborate commercial catch data and supplement biological information collected during fishery-independent surveys and at commercial landing sites.
Fishery-independent data
Direct surveys
Fishery Independent Monitoring Survey (FIMS)
In order to monitor the possible effects of the reduction in minimum size on the resource, an annual FIMS using traps was introduced at the start of the 1992/93 season. These surveys were designed to monitor the abundance of the west coast rock lobster resource by providing annual relative abundance indices (Fig. 9), providing estimates of the size and sex compositions of the population and to evaluate trends in these characteristics. The FIMS abundance index is used in the operational management procedure to set the annual total allowable catch. As the mesh size in the FIMS traps is smaller than that used in the commercial fishery, they retain a greater number of sub-legal sized lobsters. The use of these data in predicting recruitment to the fishery is currently being investigated.
Rock lobster walkout surveys
Lobster mass strandings, or 'walkouts', which occur during low-oxygen conditions, are a sporadic, but not uncommon feature of the South African west coast.38 While anecdotal information on the severity of these events since the 1960s is available, it is only since the mid-1980s that comprehensive information on the areas affected, biomass stranded and size composition and sex ratios have been recorded.39 This information, coupled to follow-up surveys in the affected areas, is used to assess the short- and long-term implications of these mass strandings on the lobster resource and the commercial fishery in the affected areas.
Indirect surveys
Recreational fishing for west coast rock lobster requires a specific annual permit. A directed telephone survey to monitor recreational lobster take, introduced in 1991/92, provides information on areas and times fished, methods used and total annual recreational landings.40 This information is used to assist in the management of this sector and in the split of the global total allowable catch between the commercial and recreational sectors.
Other resources
South coast rock lobster, squid and linefish are monitored using only fishery-dependent data, while abalone are assessed using an independent diving survey and catch rates. However, heavy abalone poaching has confounded the analyses and the resource is in steep, unabated decline, resulting in a recent CITES listing, which requires strict permitting for international trade as stocks reach dangerously low levels, and more recently in a complete ban on commercial harvests.
Ecosystem monitoring
South Africa has a wealth of large marine animals that feed on fish or planktonic resources and attract attention from tourists. Formerly, several of these animals were among those that were harvested, for example whales, seals and the eggs and guano of seabirds. Some, such as seals, were exploited to low levels of abundance, from which they are recovering (Fig. 10). However, many predators still have an unfavourable conservation status in terms of criteria of the World Conservation Union (IUCN). It is necessary to monitor their status,41,42 advise conservation measures and monitor the impact of conservation interventions.43

The consumptive use of higher marine vertebrates (mammals, seabirds, turtles and some large sharks) in South Africa has now ceased and been superseded by tourism. Monitoring of this new industry is necessary to ensure viewer disturbance and altered behaviour are not detrimental to the population status of these resources.
Some opportunistic predators have benefitted from human activities, e.g. the provision of food from bycatch discarded at sea or at coastal rubbish tips and the provision of new breeding habitat through the removal of mainland predators. Some of these species have become abundant and exert harmful impacts on threatened species and fisheries. The management of these interactions requires monitoring.44,45
Other (often specialist) predators have been adversely influenced by humans, for example, competition with commercial purse-seine fisheries for food and bycatch mortality during long-lining and bottom trawling have proved especially detrimental.46
Monitoring is required to understand how management of fisheries can account for the needs of dependent or bycatch species (Fig. 11) and may provide useful indices of the abundance of stocks of prey that are also exploited by commercial fisheries,47,48 forecasting recruitment to fisheries and providing information on changes in natural mortality rates49 and the distribution50,51 of fished resources. Hence they may provide information useful in the management of prey resources such as pelagic forage fish. Additionally, because of their position at the apex of the food chain and susceptibility to factors such as pollution, top predators have the potential to provide indices of the state of health of marine ecosystems.52
In order to fulfil the commitment at the World Summit of Sustainable Development in Johannesburg in 2002, that measurable progress towards EAF be made by 2010, South Africa has started to draw from its extensive data series and monitoring programmes to provide the necessary inputs for the process, including identifying all major issues affecting ecological and human well-being and threat analyses through expert consultation.46
It is well recognised that changes in ecosystem states are often environmentally driven, but altered fishing pressure has also been found to have major impacts on ecosystem state and the population dynamics,53 as have ecological and behavioural changes.54 In order for these 'regime shifts' or ecosystem changes to be identified and understood, it is important to collect, monitor and analyse time series for as many species as possible, and the environment in which they live. South Africa has a good history for doing just this: the Benguela Ecology Programme55 began in 1981 and succeeded in establishing an extensive knowledge base through collection of environmental and biological data over time (monitoring) and undertaking carefully-focused interdisciplinary research, placing the Benguela region at an advantage in development of an EAF. Van der Lingen et al.6 propose several steps to help identify, monitor and react to (i.e. manage) ecosystem changes. Of particular relevance to this contribution are the following three: i) the identification of different possible states of the ecosystem and evaluation of their desirability on a socio-economic basis, ii) identification of a suite of indicators necessary to describe and quantify ecosystem changes, and iii) synthesis of the information provided by the indicators (e.g. through an expert system approach that can capture many aspects of change56 to monitor key aspects of the ecosystem.
A workshop was convened in Cape Town in December 2002 to introduce and examine the options for implementing an EAF. Several modelling tools that rely on data collected through the monitoring programmes discussed above are potentially useful for an EAF57 and it was recommended that an EAF be implemented in South Africa as an incremental procedure with immediate effect. In mid-2003, a dedicated EAF Task Group (now functioning as a Scientific Working Group) was established by MCM. The options for including ecosystem aspects, such as seabird food requirements, into the management of the small pelagics fishery are being explored, and practical management requirements are being discussed and adopted to minimise gear-related and bycatch effects in the demersal trawl fishery. In addition to this national initiative, a regional (South Africa, Namibia and Angola) EAF project began in 2004, under the auspices of the Benguela Current Large Marine Ecosystem (BCLME, see website www.bclme.org), to investigate the feasibility of EAF management in the BCLME region through examining the existing issues, problems and needs related to EAF. This process is well under way, and in particular, risk assessments have been undertaken to identify ecological and socioeconomic issues in three major South African fisheries, namely the small pelagics, demersal and west coast rock lobster fisheries.46 Research and scientific indicators (calculated from data collected during routine monitoring described above) required to address the ecological issues of priority in the three fisheries have been documented, and possible management options have been identified.58
Conclusions
MCM have developed a powerful capability to collect an abundance of data on a broad range of living organisms from plankton to whales, and their associated environment (Fig. 12). This information can be synthesised into mass balance models (Fig. 13), which can be used to compare different regions or time periods, or be used as dynamic models to investigate future scenarios.59 Not only are they able to provide rational, objective advice and information for critical decision making for consumptive and non-consumptive resource use, but the data can provide valuable insights into long-term changes associated with climate change, changing land use and industrial developments. Long-term datasets indicate whether changes in the populations of wild resources are driven by fishing pressures or are part of long-term cycles and accompanying regime shifts. MCM is an agency with two apparently ambiguous and conflicting roles: promoting sustainable utilisation of natural resources and conserving marine biodiversity. MCM has developed an ecosystem approach in policies, which promote the sustainable use of marine resources but minimise the impact of harvesting practices on the marine ecosystem. In South African waters, as is the case in many other marine areas, fishing activities currently represent by far the biggest threat to marine biodiversity, compared with habitat alteration, pollution, alien invasives and climate change.
Marine protected areas, which can remove the effects of fishing and pollution, provide promising opportunities to gauge the influence of climate change by suitable monitoring procedures, which can then be compared with key areas for resource utilisation, such as St. Helena Bay. It is highly advantageous to have the resources regulation and biodiversity conservation within the same management framework of MCM. Several other countries have discovered, to their detriment, that conservation efforts simply fall by the wayside in the light of economic imperatives from large and powerful fisheries interests.
Long time series of critical components of marine ecosystems provide the essential basis for sustainable management of South Africa's rich marine resources. The ecosystem approach to fisheries management has broadened the scope from the focus on single species to incorporate changes in ecosystem structure and functioning in response to decadal scale variability in the oceans surrounding southern Africa. Analysis of past variability and continued monitoring, modelling and scenario planning, using a broad range of variables from the environment to top predators, will enable South African marine resource managers to recognise change and adapt to future changes in not only the major key harvested resources, but also the structure and functioning of marine ecosystems.
1. Brown A.C. (1997). John D.F. Gilchrist and the early years of marine science in South Africa. Trans. Roy. Soc. S. Afr. 52, 2–16. [ Links ]
2. Cochrane K.L., Augustyn C.J., Cockcroft A.C., David J.H.M., Griffiths M.H., Groeneveld J.C., Lipinski M.R., Smale M.J., Smith C.D. and Tarr R.J.Q. (2004). An ecosystem approach to fisheries in the southern Benguela context. In Ecosystem Approaches to Fisheries in the Southern Benguela Current, eds L.J. Shannon, K.L. Cochrane and S.C. Pillar. [ Links ] Afr. J. Mar. Sci. 26, 9–35. [ Links ]
3. Best P.B., Crawford R.J.M. and van der Elst R.P. (1997). Top predators in southern Africa's marine ecosystems. Trans. Roy. Soc. S. Afr. 52, 177–225. [ Links ]
4. Tarr R.J.Q, Williams P.V.G. and MacKenzie A.J. (1996). Abalone, sea urchins and rock lobster: a possible ecological shift may affect traditional fisheries. Afr. J. Mar. Sci. 17, 311–315. [ Links ]
5. Butterworth D.S. and Plaganyi E.E. (2004). A brief introduction to some approaches to multispecies/ecosystem modelling in the context of their possible application in the management of South African fisheries. Afr. J. Mar. Sci. 26, 53–61. [ Links ]
6. Van der Lingen C.D., Shannon L.J., Cury P., Kreiner A., Moloney C.L., Roux J-P. and Vaz-Velho F. (2006). Resource and ecosystem variability, including regime shifts, in the Benguela Current system. In Benguela: Predicting a Large Marine Ecosystem, eds V. Shannon, G. Hempel, P. Malanotte-Rizzoli, C. Moloney and J. Woods, chap. 8. Large Marine Ecosystems 14, 147–185. [ Links ]
7. Cunningham C.L. and Butterworth D.S. (2005) Re-revised OMP-04. SWG/ DEC2005/PEL/05, MCM (unpublished document). [ Links ]
8. Pecquerie L., Drapeau L., Fréon P., Coetzee J.C., Leslie R.W. and Griffiths M.H. (2004). Distribution patterns of key fish species of the southern Benguela ecosystem: an approach combining fishery-dependent and fishery-independent data. In Ecosystem Approaches to Fisheries in the Southern Benguela, eds L.J. Shannon, K.L. Cochrane and S.C. Pillar. [ Links ] Afr. J. Mar. Sci. 26, 115–139. [ Links ]
9. Van der Lingen C.D., Coetzee J.C., Demarcq H., Drapeau L., Fairweather T. and Hutchings L. (2005). An eastward shift in the distribution of southern Benguela sardine. GLOBEC Int. Newsl. 11, 17–22. [ Links ]
10. Fréon P., Drapeau L., David J.H.M., Moreno A.M., Leslie R.W., Oosthuizen W.H., Shannon L.J. and van der Lingen C.D. (2005). Spatialized ecosystem indicators in the southern Benguela. ICES J. Mar. Sci. 62, 459–468. [ Links ]
11. Cunningham C.L. and Butterworth D.S. (2004). Base case Bayesian assessment of the South African anchovy resource. WG/APR04/PEL/01, MCM (unpublished document). [ Links ]
12. Cunningham C.L. and Butterworth D.S. (2004). Base case Bayesian assessment of the South African sardine resource. WG/APR04/PEL/02, MCM (unpublished document). [ Links ]
13. Van der Lingen C.D., Fréon P., Fairweather T.P. and van der Westhuizen J.J. (2006). Density-dependent changes in reproductive parameters and condition of southern Benguela sardine Sardinops sagax. Afr. J. Mar. Sci. 28, 625–636. [ Links ]
14. Fairweather T.P., van der Lingen C.D., Booth A.J., Drapeau L. and van der Westhuizen J.J. (2006). Indicators of sustainable fishing for South African sardine (Sardinops sagax) and anchovy (Engraulis encrasicolus). Afr. J. Mar. Sci. 28, 661–680. [ Links ]
15. De Goede J. and van der Lingen C.D. (2005). Application of a fat staging technique to examine temporal and spatial variability in lipid content of southern Benguela sardine Sardinops sagax. Afr. J. Mar. Sci. 27, 671–675. [ Links ]
16. Somhlaba S. (2007). Overall results for the effect of the presence of an observer on catches made by the pelagic fleet. SWG/OCT2007/PEL/03, MCM (unpublished document). [ Links ]
17. Agenbag J.J., Richardson A.J., Demarcq H., Fréon P., Weeks S. and Shilllington F.A. (2003). Estimating environmental preferences of South African pelagic fish species using catch size and remote sensing data. In ENVIFISH: Investigating Environmental Causes of Pelagic Fisheries Variability in the SE Atlantic, eds M. Barange and L. Nykjaer. [ Links ] Prog. Oceanog. 59, 275–300. [ Links ]
18. Silva C., Nieto K., Barbieri M.A. and Yáñez E. (2002). Expert systems for fishing ground prediction models: a management tool in the Humboldt Ecosystem affected by ENSO. In Extended Abstracts of the El Niño Symposium and Workshop, August 7–10, Viña del Mar, Chile, eds S. Salinas, H-J. Urban and W.E. Arntz. [ Links ] Invest. Mar. 30, 201–204. [ Links ]
19. Barange M., Hampton I. and Roel B.A. (1999). Trends in the abundance and distribution of anchovy and sardine on the South African continental shelf in the 1990s, deduced from acoustic surveys. S. Afr. J. Mar. Sci. 21, 367–391. [ Links ]
20. Coetzee J.C., Merkle D., Twatwa N.M., Rademan J. and van der Lingen C.D. (2005). Results of the 2005 spawner biomass survey. SWG/DEC2005/PEL/03, MCM (unpublished document). [ Links ]
21. Hampton I. (1996). Acoustic and egg-production estimates of South African anchovy biomass over a decade: comparisons, accuracy and utility. ICES J. Mar. Sci. 53, 493–500. [ Links ]
22. Van der Lingen C.D., Hutchings L., Merkle D., van der Westhuizen J.J. and Nelson J. (2001). Comparative spawning habitats of anchovy (Engraulis capensis) and sardine (Sardinops sagax) in the southern Benguela upwelling ecosystem. In Spatial Processes and Management of Marine Populations, eds G.H. Kruse, N. Bez, T. Booth, M. Dorn, S. Hills, R.N. Lipcius, D. Pelletier, C. Roy, S.J. Smith and D. Witherell, pp. 185–209. University of Alaska Sea Grant, Fairbanks. [ Links ]
23. Twatwa N.M., van der Lingen C.D., Drapeau L., Moloney C.L. and Field J.G. (2005). Characterizing and comparing the spawning habitats of anchovy (Engraulis encrasicolus) and sardine (Sardinops sagax) in the southern Benguela upwelling ecosystem. Afr. J. Mar. Sci. 27, 487–499. [ Links ]
24. Roy C., Penven P. and van der Lingen C.D. (2005). Investigation of interannual dynamics of suitable spawning habitat for anchovy (Engraulis encrasicolus) in the southern Benguela using a 3D hydrodynamic model. In Report of the SPACC Meeting on Small Pelagic Fish Spawning Habitat Dynamics and the Daily Egg Production Method (DEPM), eds L.R. Castro, P. Fréon, C.D. van der Lingen and A. Uriarte. [ Links ] GLOBEC Rep. 22, 4–5. [ Links ]
25. Drapeau L. and van der Lingen C.D. (2005). Predicting spawning habitat location of anchovy and sardine in the southern Benguela using remotely-sensed data. In Report of the SPACC Meeting on Small Pelagic Fish Spawning Habitat Dynamics and the Daily Egg Production Method (DEPM), eds L.R. Castro, P. Fréon, C.D. van der Lingen and A. Uriarte. [ Links ] GLOBEC Rep. 22, 6–8. [ Links ]
26. Van der Lingen C.D. and Huggett J.A. (2003). The role of ichthyoplankton surveys in recruitment research and management of South African anchovy and sardine. In The Big Fish Bang: Proceedings of the 26th Annual Larval Fish Conference, eds H.I. Browman and A.B. Skiftesvik, pp. 303–343. Institute of Marine Research, Bergen. [ Links ]
27. Roy C., van der Lingen C.D., Coetzee J.C. and Lutjeharms J.R.E. (2007). Abrupt environmental shift associated with changes in the distribution of Cape anchovy Engraulis encrasicolus spawners in the southern Benguela. Afr. J. Mar. Sci. 29, 309–320. [ Links ]
28. Payne A.I.L. and Punt A.E. (1992). Biology and fisheries of South African Cape hakes (M. capensis and M. paradoxus). In Hake: Fisheries, Ecology and Markets, eds J. Alheit and A.J. Pitcher, pp. 15–47. Chapman and Hall, London. [ Links ]
29. Payne A.I.L. and Bannister R.C.A. (2003). Science and fisheries management in southern Africa and in Europe. Afr. J. Mar. Sci. 25, 1–23. [ Links ]
30. Rademeyer R.A., Butterworth D.S. and Plaganyi E.E. (2008). Assessment of the South African hake resource taking its two-species nature into account. Afr. J. Mar. Sci. 30(2), 263–290. [ Links ]
31. Cockcroft A.C. and Payne A.I.L. (1999). A cautious fisheries management policy in South Africa: the fisheries for rock lobster. Marine Policy 23, 587–600. [ Links ]
32. Pollock D.E. (1986). Review of the fishery for and biology of the Cape rock lobster Jasus lalandii with notes on larval recruitment. Can. J. Fish. Aquat. Sci. 43, 2107–2117. [ Links ]
33. Pollock D.E., Cockcroft A.C., Groeneveld J.C. and Schoeman D.S. (2000). The commercial fisheries for Jasus and Palinurus species in the south-east Atlantic and south-west Indian Oceans. In Spiny Lobsters Fisheries and Culture, eds B.F. Phillips and J. Kittaka, pp. 105–120. Fishing News Books, Blackwell, Oxford. [ Links ]
34. Pollock D.E. (1994). The fisheries for two Jasus species of the south-east Atlantic and for Palinurus gilchristi off the southern Cape coast of South Africa. In Spiny Lobster Management, eds B.F. Phillips, J.S. Cobb and J. Kittaka, pp. 91–102. Blackwell Scientific Publications, Oxford. [ Links ]
35. Melville-Smith R., Goosen P.C. and Stewart T.J. (1995). The spiny lobster Jasus lalandii (H. Milne Edwards, 1837) off the South African coast: inter-annual variations in male growth and female fecundity. Crustaceana 68, 174–183. [ Links ]
36. Cockcroft A.C. and Goosen P.C. (1995). Shrinkage at moulting in the rock lobster Jasus lalandii and associated changes in reproductive parameters. S. Afr. J. Mar. Sci. 16, 195–203. [ Links ]
37. Cockcroft A.C. (1997). Biochemical composition as a growth predictor in male west-coast rock lobster (Jasus lalandii). Mar. Freshwater Res. 48, 845–856. [ Links ]
38. Cockcroft A.C., Schoeman D.S., Pitcher G.C., Bailey G.W. and van Zyl D.L. (1999). A mass stranding, or 'walk-out' of West Coast rock lobster, Jasus lalandii, in Elands Bay, South Africa: causes, results, and implications. In The Biodiversity Crisis and Crustacea, eds J.C. Von Vaupel Klein and F.R. Schram. [ Links ] Crustacean Issues 12, 673–688. [ Links ]
39. Cockcroft A.C. (2001). Jasus lalandii 'walkouts' or mass strandings in South Africa during the 1990s: an overview. Mar. Freshwater Res. 52, 1085–1094. [ Links ]
40. Cockcroft A.C. and Mackenzie A.J. (1997). The recreational fishery for West Coast rock lobster Jasus lalandii in South Africa. S. Afr. J. Mar. Sci. 18, 75–84. [ Links ]
41. Barnes K.N. (ed.) (2000). The Eskom Red Data Book of Birds of South Africa, Lesotho and Swaziland, pp. 1–18. BirdLife South Africa, Randburg. [ Links ]
42. Birdlife International (2000). Threatened Birds of the World. Lynx Editions and BirdLife International, Barcelona and Cambridge. [ Links ]
43. Crawford R.J.M., Cooper J., Dyer B.M., Upfold L., Venter A.D., Whittington P.A., Williams A.J. and Wolfaardt A.C. (2002). Longevity, inter-colony movements and breeding of crested terns in South Africa. Emu 102, 1–9. [ Links ]
44. Crawford R.J.M., David J.H.M., Williams A.J. and Dyer B.M. (1989). Competition for space: recolonising seals displace endangered, endemic seabirds off Namibia. Biol. Conserv. 48, 59–72. [ Links ]
45. David J.H.M., Cury P., Crawford R.J.M., Randall R.M., Underhill L.G. and Meÿer M.A. (2003). Assessing conservation priorities in the Benguela ecosystem: analysing predation by seals on threatened seabirds. Biol. Conserv. 114, 289–292. [ Links ]
46. Nel D.C., Cochrane K., Petersen S.L., Shannon L.J., van Zyl B. and Honig M.B. (2007). Ecological risk assessment: a tool for implementing an ecosystem approach to southern African fisheries. WWF South Africa Report Series 2007/Marine/002, Published by WWF, Stellenbosch. [ Links ]
47. Berruti A., Underhill L.G., Shelton P.A., Moloney C. and Crawford R.J.M. (1993). Seasonal and interannual variation in the diet of two colonies of the Cape gannet (Morus capensis) between 1977–78 and 1989. Colonial Waterbirds 16, 158–175. [ Links ]
48. Crawford R.J.M. (2003). Population, and size and location, of colonies of swift terns in South Africa's Western Cape, 1987–2000. Waterbirds 26(1), 44–53. [ Links ]
49. Crawford R.J.M., Underhill L.G., Raubenheimer C.M., Dyer B.M. and Martin J. (1992). Top predators in the Benguela ecosystem – implications of their trophic position. S. Afr. J. Mar. Sci. 12, 675–687. [ Links ]
50. Crawford R.J.M. (1998). Responses of African penguins to regime changes of sardine and anchovy in the Benguela system. S. Afr. J. Mar. Sci. 19, 355–364. [ Links ]
51. Crawford R.J.M., Davis S.A., Harding R., Jackson L.F., Leshoro T.M., Meÿer M.A., Randall R.M., Underhill L.G., Upfold L., van Dalsen A.P., van der Merwe E., Whittington P.A., Williams A.J. and Wolfaardt A.C. (2000). Initial impact of the Treasure oil spill on seabirds off western South Africa. S. Afr. J. Mar. Sci. 22, 157–176. [ Links ]
52. Underhill L.G. and Crawford R.J.M. (2005). Indexing the health of the environment for breeding seabirds in the Benguela system. ICES J. Mar. Sci. 62, 360–365. [ Links ]
43. Larkin P.A. (1996). Concepts and issues in marine ecosystem management. Rev. Fish. Biol. Fish. 6, 139–164. [ Links ]
54. Cury P.M., Shannon L.J. and. Shin Y-J (2003). The functioning of marine ecosystems: a fisheries perspective. In Responsible Fisheries in the Marine Ecosystem, eds M. Sinclair and G. Valdimarsson, pp. 103–123. FAO and CABI Publishing, U.K. [ Links ]
55. Moloney C., van der Lingen C., Hutchings L. and Field J. (2004). Contributions of the Benguela Ecology program to pelagic fisheries management in South Africa. In Ecosystem Approaches to Fisheries in the Southern Benguela Current, eds L.J. Shannon, K.L. Cochrane and S.C. Pillar. [ Links ] Afr. J. Mar. Sci. 26, 37–51. [ Links ]
56. Jarre A., Moloney C.L., Shannon L.J., Freon P., van der Lingen C.D., Verheye H.M., Hutchings L., Roux J-P. and Cury P. (2006). Developing a basis for detecting and predicting long-term ecosystem changes. In Benguela: Predicting a Large Marine Ecosystem, eds V. Shannon, G. Hempel, P. Malanotte-Rizzoli, C. Moloney and J. Woods, chap. 11. [ Links ] Large Marine Ecosystems 14, 239–272. [ Links ]
57. Shannon L.J., Cochrane K.L., Moloney C.L. and Freon P. (2004). Ecosystem approach to fisheries management in the southern Benguela: an overview. In Ecosystem Approaches to Fisheries in the Southern Benguela Current, eds L.J. Shannon, K.L. Cochrane and S.C. Pillar. [ Links ] Afr. J. Mar. Sci. 26, 1–8. [ Links ]
58. Shannon L.J., Cury P.M., Nel D., van der Lingen C.D., Leslie R., Brouwer S., Cockcroft A. and Hutchings L. (2006). How can science contribute to an ecosystem approach to pelagic, demersal and rock lobster fisheries in South Africa? Afr. J. Mar. Sci. 28, 115–157. [ Links ]
59. Shannon L.J., Moloney C.L., Jarre A. and Field J.G. (2003). Trophic flows in the southern Benguela during the 1980s and 1990s. J. Mar. Syst. 39, 83–116. [ Links ]
Received 1 October 2006. Accepted 25 March 2009.
* Author for correspondence E-mail: lhutchin@deat.gov.za

