


Services on Demand
Article
 English (pdf)
 Article in xml format
 Article references
Indicators

Related links
-
 Cited by Google
 -
 Similars in Google
Share

 Permalink
South African Journal of Science
On-line version ISSN 1996-7489
Print version ISSN 0038-2353
S. Afr. j. sci. vol.104 n.11-12 Pretoria Nov./Dec. 2008
RESEARCH LETTERS
Mitochondrial DNA diversity and population structure of a forest-dependent rodent, Praomys taitae (Rodentia: Muridae) Heller 1911, in the fragmented forest patches of Taita Hills, Kenya
Silvester NyakaanaI, II, *; Christopher TumusiimeI; Nicholas OgugeIII; Hans R. SiegismundIV; Peter ArctanderV; Vincent MuwanikaI
IInstitute of Environment and Natural Resources, Makerere University, P.O. Box 7298, Kampala, Uganda
IIBotany Department, Makerere University, P.O. Box 7062, Kampala, Uganda
IIIEarthwatch Institute, P.O. Box 10717-00100, Nairobi, Kenya
IVInstitute of Biology, Department of Evolutionary Biology, University of Copenhagen, Universitetsparken 15, DK-2100, Copenhagen, Denmark
VInstitute of Molecular Biology, Department of Evolutionary Biology, University of Copenhagen, Universitetsparken 15, DK-2100, Copenhagen, Denmark
ABSTRACT
The population genetic structure of the forest-dependent rodent, Praomys taitae, sampled from nine indigenous forest fragments distributed over three ranges of the Taita Hills in Kenya, was determined using mitochondrial DNA (mtDNA) control region sequence variation. Thirty-three unique haplotypes were observed in a total sample of 132 individuals, whereas the number of different haplotypes per population ranged from two to 10. An overall low nucleotide diversity of 0.9% was observed in the total sample but varied widely between populations (0.2–1.3%). Significant genetic differentiation was observed in 30 of the 36 possible pair-wise comparisons between populations, while a hierarchical AMOVA revealed significant genetic subdivision between groups of populations on the three hill ranges of Dabida, Mbololo and Kyulu (FCT = 0.404, P < 0.01), among populations on each of the hill ranges (FSC = 0.112, P < 0.01) and among populations in the total sample (FST = 0.471, P < 0.001). Demographic history analyses based on pair-wise nucleotide sequence mismatch distributions revealed that all the populations were in mutation-drift disequilibrium except the populations of the Kyulu and Ronge forest fragments.
Introduction
The Taita Hills in southeast Kenya (3°25'S, 38°20'E) represent the northernmost end of the eastern arch mountain ranges and lie at an altitude of 1500–2230 m above sea level. They are composed of three distinct mountain isolates of Sagalla, Dabida and Mbololo. They have existed since the Oligocene (c. 100 million years ago) and have been forested for most of this period.1 Extensive forest loss over the last four decades, however, fueled by increased demand for agricultural land and hardwood products, has reduced the original indigenous forest cover to a patchwork of eleven forest fragments scattered across the hilltops and ridges totalling less than 400 hectares.2,3 Because of their age, isolated location, and comparatively stable climatic conditions, the Taita Hills are a global biodiversity hotspot characterized by high levels of endemicity.4,5 Some of the endemic fauna include the Taita reed frog (Hyperolius viridiflavus glandicolor), the Taita thrush (Turdus helleri), the Taita white-eye (Zosterops poliogaster silvanus) and the Taita apalis (Apalis thoracica fuscigularis).
One of the attendant consequences of such fragmentation of terrestrial landscapes is the subdivision of a species into small and often localized populations, where mating is more likely to occur among closely related individuals, a phenomenon that culminates in reduced intra-population genetic diversity, increased genetic differentiation between populations, reduced fitness and accelerated local extinction of the populations.6–8 Whereas in highly vagile species the attendant consequences of habitat fragmentation can be mitigated by frequent migration between populations across the heterogeneous landscape,9 sedentary species with limited dispersal ability are particularly vulnerable.
In this study we examined the impact of this habitat fragmentation on the distribution of genetic diversity within and between the little-studied Praomys taitae populations in nine forest patches in the Taita Hills at the northernmost end of the eastern arc mountain ranges. P. taitae is a sedentary species with an average home range of approximately 0.22 hectares.10 Although many ecological and molecular genetic analyses of fauna of the Taita Hills have been accomplished,11–16 no assessment of the genetic status of this forest-dependent murid has been carried out. It is therefore imperative that long-term effective management strategies for species in fragmented habitats be designed with the aim of mitigating the deleterious effects of inbreeding and loss of genetic diversity; and this can be achieved only if an inventory of the genetic parameters of the species in question is carried out.
We used mtDNA control region sequence variation to examine the partitioning of genetic diversity within and between P. taitae populations in the fragmented landscape of the Taita Hills.
Methods
Sample collection and DNA extraction
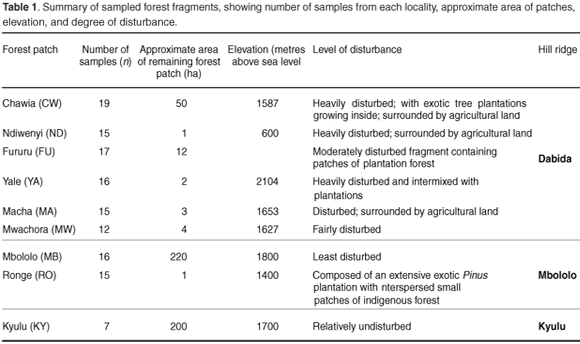
Tissue samples were obtained from toe clips of 132 samples of Praomys taitae trapped using small (7.5 × 9 × 23 cm) Sherman's live traps from eight forest patches distributed on two large ridges of the Taita Hills (Dabida and Mbololo; 3°25'S, 38°20'E) and also from the Kyulu forest fragment (2°47.12'S, 37°52.14'E) located on a volcanic mountain ridge 40 km northwest of the Taita Hills. The study area has been described in detail.17 The spatial distribution of the forest fragments, characteristics of the study areas and number of samples obtained from each locality are summarized in Fig. 1 and Table 1, respectively. Samples were stored in cryo-vial tubes containing 25% dimethylsulphoxide (DMSO) in saturated sodium chloride18 at ambient temperature in the field and at –80°C in the laboratory. DNA extraction was done using the DNeasy tissue kit (Qiagen) following the manufacturer's instructions.

DNA amplification and sequencing
We used primer pairs Ham1 (5'-CCACCATCAGCACCCAAA-3' and Ham2 (5'-CGAGATGTCTTATTTAAGGGGAA-3')19 to amplify a 356-bp fragment of the 5' hyper-variable segment of the mitochondrial control region. Amplifications were done in 50 µl reaction volumes containing 2–5 ng of genomic DNA, 50 mM dNTPs, 10 pmol of each primer, 1 unit of Taq DNA polymerase enzyme and 20 mM of 10X PCR reaction buffer containing 1.5 mM MgCl2. An Eppendorf mastercycler gradient (Eppendorf) was used with the following cycling parameters: an initial denaturation at 94°C for 5 min, 35 cycles at 94°C for 1 min, at 54°C for 2 min, at 72°C for 2 min and a final extension of 5 min at 72°C. Negative control PCR reactions containing all the reactants minus template DNA were included in all amplifications to check for possible contamination. PCR products were cleaned using the QIAquick PCR purification kit (Qiagen) and both strands of template DNA sequenced using an automated ABI 377 DNA sequencer (Applied Biosystems) using the Big Dye Terminator cycle sequencing kit version 2.0 (Applied Biosystems), following the manufacturer's standard protocol. The light and heavy strand sequences of each individual were aligned and combined to produce a consensus sequence using the program SEQUENCHERTM version 4.2 for Windows© (Gene Codes Corporation). Consensus sequences were then manually aligned and analysed using the program BIOEDIT.20
Mitochondrial DNA phylogenetic analyses
We used the computer program package MODELTEST21 to select the appropriate nucleotide substitution model that best fitted our data set. Consequently, the HKY+I+G model was chosen and incorporated in subsequent analyses. The evolutionary relationships between unique mtDNA haplotypes were estimated using distance methods implemented in TREECON version 1.3b,22 taking into consideration the model of DNA evolution identified by MODELTEST. The statistical support of each node in the haplotype tree was estimated using 100 bootstrap replicates of the data set.
Genetic diversity and population structure analyses
Nucleotide diversity within populations (π),23 haplotype diversity HT, inter-haplotype divergences and net percentage sequence divergence between populations were estimated using the program ARLEQUIN version 3.01.24 The net inter-population distances were then used to estimate a distance-based population tree using the Neighbor package of the program PHYLIP version 3.5c.25 A hierarchical AMOVA26 as implemented in ARLEQUIN version 3.0124 was used to analyse the partitioning of genetic diversity within and between populations and also between groups of populations on the three hill ranges of Dabida, Mbololo and Kyulu (see Table 1). The extent of genetic differentiation between populations was quantified using the F-statistics27 based on haplotype frequency and nucleotide sequence variations. The statistical significance of FST estimates was determined using 1000 permutations. We tested for correlation between within-population genetic diversity and forest fragment size using the program XLSTAT Pro version 7.5, a Microsoft Excel© add-in.
Population demographic history analysis
We computed pairwise nucleotide mismatch distributions among haplotypes and tested the data against the population sudden-expansion model28 using the programs ARLEQUIN version 3.0124 and DnaSP version 4.0.29 A scenario of a recent demographic expansion or bottleneck is expected to generate a unimodal distribution of pairwise nucleotide differences between haplotypes, whereas in populations at demographic equilibrium, the pairwise mismatch distribution curve is expected to be multimodal.28,30 We validated the conformity of our data to the chosen population model using Tajima's D31 and Fu's FS32 summary statistics plus the distribution of the SSD test statistic (the sum of squared differences) between the observed and the estimated mismatch distribution. We estimated the significance of the D and FS statistics using a coalescent simulation algorithm under the hypothesis of selective neutrality and population equilibrium.33 We interpreted significantly negative D and FS values as being indicative of recent population expansion, significantly positive values as signifying significant effects of genetic drift (which are normally accentuated under conditions of a bottleneck) and significant SSD values as evidence for significant departure from the demographic model of sudden population expansion.
Results
mtDNA control region sequence variation and evolutionary relationships between haplotypes
Thirty-three unique haplotypes defined by 22 polymorphic sites were identified among the 132 individuals sampled from the nine localities. The individual sequences have been submitted to GenBank (FJ606713–FJ606745). The frequencies and distribution of the haplotypes observed in the different localities are shown in Fig. 2. Within-population haplotype diversities were relatively high (0.3–0.9), while the number of haplotypes per population ranged from two (MW) to ten (CW) (Table 2). Twenty-four of the haplotypes were locality specific, of which 19 were singletons. The most frequent haplotype was CW693, occurring in 22% of all the individuals sampled and distributed across five localities in the same hill range of Dabida. Only two haplotypes occurred on more than one hill range, haplotype YA692 (shared between Dabida and Mbololo) and CW704 (occurred in all three hill ranges of Kyulu, Dabida, and Mbololo).

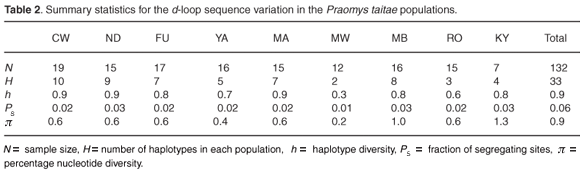
Six out of the seven individuals from Kyulu (KY) shared a locality-specific A/G transition and T/G transversion at positions 220 and 221, respectively, while three out of the seven individuals from the same population had a unique insertion of thymine at position 242 and four individuals had a unique A/G transition at position 243 (Fig. 2). These population-specific substitutions are indicative of limited or complete absence of contemporary gene flow between this forest patch and the rest of the fragments. Likewise, a population-specific A/T transversion substitution at position 7 was found in 53% of the individuals from the Mbololo population. An overall transition: transversion ratio of approximately 4:1 was observed. The overall nucleotide diversity in the total sample was 0.9% but varied widely across populations, ranging from 0.2% in Mwachora (MW) to 1.3% in Kyulu (KY) (Table 2). A significantly positive correlation was observed between the amount of genetic diversity in the different populations and the forest patch size (as indicated in Table 1) from which they were sampled (r = 0.84; P < 0.01).
While the neighbor-joining tree showed no locality-specific structuring of the different haplotypes (Fig. 3), the population tree grouped the populations in three distinct clades concordant with the three hill ranges from which they were sampled (Fig. 4).


Population structure
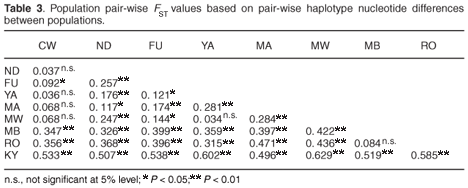
Inter-population genetic divergence quantified using FST statistics showed significant genetic differentiation (P < 0.05) in 83% of the 36 possible pair-wise population comparisons, with all comparisons of populations from different hill ranges being significant, thus suggesting limited gene flow between the contemporary populations in the different forest patches on each hill range and complete isolation of the populations on the different hill ranges (Table 3). A hierarchical analysis of molecular variance (AMOVA) also confirmed the highly significant genetic subdivision between the forest fragments on the three hill ranges of Dabida, Mbololo and Kyulu (FCT = 0.404, P < 0.01), among populations on each of the hill ranges (FSC = 0.112, P < 0.01) and among populations in the total sample (FST = 0.471, P < 0.001). The AMOVA attributed 53% of the total variation to variations between populations sampled from the same hill range.
Demographic history of the populations
The mismatch frequency spectra for the nine populations are shown in Fig. 5. The observed unimodal mismatch frequency distributions of all the populations sampled from the Dabida hill range (CW, ND, FU, YA, MA and MW) showed excesses of mutations that appeared in only a few individuals and a deficiency of mutations shared by many individuals in the population—a scenario in conformity with the recent expansion model. On the other hand, the mismatch distributions of populations sampled from Kyulu Hills (KY) and Mbololo Hill range (MB and RO) were bimodal and fitted poorly with their corresponding distributions expected under the recent expansion model.
Fu's Fs neutrality test,32 however, revealed significant signatures of recent population expansion in only two populations; Chawia (Fs = –4.81; P < 0.01) and Ndiwenyi (Fs= –4.32; P < 0.01). Tajima's D and SSD statistics were in contrast not significant (Table 4). Conversely, the populations of Kyulu and Ronge had mismatch frequency spectra that significantly deviated from what would be expected under the sudden expansion model as indicated by the significantly positive values of the SSD test statistics (Table 4).

Discussion
Population genetic structure
An overall nucleotide diversity of 0.9% observed in this study is less than what has previously been found in other rodents such as the subterranean mole rats (Spalax ehrenbergi, π = 3.86%; Heterocephalus glaber, π = 2.9%; Cryptomys hottentotus, π = 1.8%),34 Amazonian spiny rats (Proechimys steerei, 7.1%; Proechimys simonsi, 11.8%),35 the Siberian lemming (Lemmus sibiricus, 1.8–2.8%),36 and the dusky-footed woodrat (Neotoma fuscipes, π = 1.0–3.9%).37 However, this value is higher than what was recently observed in the plains woodrat, Neotoma micropus (π = 0.8%).38 The low nucleotide diversity indices observed in most of the studied populations (Table 2) indicate that the populations possess a large number of closely related haplotypes, a scenario that would be expected after a recent demographic event such as a bottleneck or a population expansion. Although the spatial distribution of the haplotypes indicated that they were locality-specific (Fig. 2), they exhibited a shallow and poorly resolved phylogenetic structure (Fig. 3), confirming their very recent common ancestry.
Our data show limited female dispersal between populations as evidenced by the observed significant genetic differentiation between most of the populations. The observed limited gene flow, high haplotype diversity, low nucleotide diversity and a significant correlation between nucleotide diversity and fragment size all suggest that genetic drift is the key factor controlling the distribution of genetic diversity in these fragmented populations. These observations contradict the previously reported panmixia and absence of differentiation in P. taitae populations that was based on morphometric and cytogenetic studies.4 Genetic studies on other co-distributed avian species present differing scenarios: strong differentiation between fragments and mutation-drift disequilibrium have been reported for the endangered Taita thrush (Turdus helleri),14 whereas habitat fragmentation was found to have no apparent effect on the dispersal of the white-starred robin (Pogonocichla stellata) between different forest fragments.15 The occurrence of significant genetic differentiation between fragmented populations of P. taitae coupled with reduced intra-population diversity has serious conservation implications for such a non-dispersing, resource-limited and forest-dependent species. It is a well-established ecological fact that altered edge effects due to forest habitat fragmentation favour invasions of fragmented patches by highly competitive grassland generalist species with no specialized requirement for habitat use. Therefore, any intensive inter-specific competitive interaction between the invasive generalists and the forest-dependent P. taitae is bound to impact negatively on the survival of the latter, and may even act as a major driving force for local extinctions of the species in some of the forest patches.
In the event that some of the populations become locally extinct, rapid recolonization from nearby populations is unlikely given the limited dispersal ability of the species plus the human-induced loss of connectivity between the different forest patches.
Population demography
Tajima's and Fu's tests for neutrality of mutations used in this study have been reported to be unable to disentangle the effects of true selective departures from neutrality (such as those caused by purifying selection and genetic hitchhiking) from those due to demographic processes such as population expansion on mismatch distribution profiles. For example, both statistics can be significantly negative due to purifying selection, genetic hitchhiking or population expansion while both of them can be significantly positive under scenarios of population bottlenecks and balancing selection at linked loci.31,39 However, because the data used in this study are derived from the selectively neutral non-coding region of the mitochondrial genome (control region), it is highly unlikely that the observed significant deviations from neutrality are due to selection. The high haplotype diversity, low nucleotide diversity, unimodal mismatch distributions, and significantly negative values of Fu's Fs statistic (see Table 2, Fig. 5 and Table 4) all support a recent population expansion from a smaller founder population as the most plausible explanation for the observed significant deviations from neutrality in the Chawia and Ndiwenyi populations. The observation that population expansion in the Chawia and Ndiwenyi populations was detected by Fu's Fs but not Tajima's D statistic attests to the fact that Fu's Fs statistic is a more powerful tool for detecting deviations from neutrality when testing for population expansion and genetic hitchhiking in populations.40–42
This research was funded by the Danish International Development Agency (DANIDA) under the Wildlife Genetics Project, a collaborative project between the University of Copenhagen (Denmark) and Makerere University (Uganda). DNA samples were obtained through research collaboration with the Zoology Department, Kenyatta University, Kenya.
1. Rogo L. and Oguge N. (2000). The Taita Hills forest remnants: a disappearing world heritage. AMBIO 29(8), 522–523. [ Links ]
2. Beentje H.J. (1987). An ecological and floristic study of the forests of the Taita Hills, Kenya. Utafiti 1, 23–66. [ Links ]
3. Brooks T., Lens L., Barnes J., Barnes R., Kihuria J.K. and Wilder C. (1998). The conservation status of the forest birds of the Taita Hills, Kenya. Bird. Cons. Int. 8, 119–139. [ Links ]
4. Bytebier B. (2001). Taita Hills Biodiversity Project Report, pp. 40–41. National Museums of Kenya, Nairobi. [ Links ]
5. Myers N., Mittermeier R.A., Mittermeier C.G., da Fonseca A.B. and Kent J. (2000). Biodiversity hotspots for conservation priorities. Nature 403, 853–858. [ Links ]
6. Saccheri I., Kuussaari M., Kankare M., Vikman P., Fortelius W. and Hanski I. (1998). Inbreeding and extinction in a butterfly metapopulation. Nature 392, 491–493. [ Links ]
7. Brooks B.W. Tonkyn D.W., O'Grady J.J. and Frankham R. (2002). Contribution of inbreeding to extinction risk in threatened species. Cons. Ecol. 6, 16. [ Links ]
8. Frankham R., Ballou J.D. and Briscoe D.A. (2002). Introduction to Conservation Genetics, pp. 309–335. Cambridge University Press, Cambridge. [ Links ]
9. Hanski I. (1999). Metapopulation Ecology. Oxford University Press, Oxford. [ Links ]
10. Rosevear D.R. (1969). The Rodents of West Africa. British Museum (Natural History), London. [ Links ]
11. Lens L., Galbusera P., Brooks T., Waiyaki E. and Schenck T. (1998). Highly skewed sex ratios in the critically endangered Taita thrush as revealed by CHD genes. Biodiv. Cons. 7, 869–873. [ Links ]
12. Lens L. and Van Dongen S. (1999). Evidence for organism-wide asymmetry in five bird species of a fragmented afro tropical forest. Proc. R. Soc. Lond. B 266, 1055–1060. [ Links ]
13. Lens L., Van Dongen S., Wilder C.M., Brooks T.M. and Matthysen E. (1999). Fluctuating asymmetry increases with habitat disturbance in seven bird species of a fragmented afro tropical forest. Proc. R. Soc. Lond. B 266, 1241–1246. [ Links ]
14. Galbusera P., Lens L., Waiyaki E., Schenc, T. and Matthysen E. (2000). Genetic variability and gene flow in the globally, critically endangered Taita thrush. Cons. Genet. 1, 45–55. [ Links ]
15. Galbusera P., Githiru M., Lens L. and Matthysen E. (2004). Genetic equilibrium despite habitat fragmentation in an Afrotropical bird. Mol. Ecol. 13, 1409–1421. [ Links ]
16. Githiru M. and Lens L. (2006). Demography of an Afrotropical passerine in a highly fragmented landscape. Anim. Cons. 9, 21–27. [ Links ]
17. Oguge N., Hutterer R., Odhiambo R. and Verheyen W. (2004). Diversity and structure of shrew communities in montane forests of southeast Kenya. Mammal. Biol. 69, 289–301. [ Links ]
18. Amos W. and Hoelzel, A.R. (1991). Long-term preservation of whale skin for DNA analysis. In Genetic Ecology of Whales and Dolphins, ed. A. R. Hoelzel, pp. 99–104. Report of the International Whaling Commission (special issue 13). [ Links ]
19. Okello J.B.A., Nyakaana S., Masembe C., Siegismund H.R. and Arctander P. (2005). Mitochondrial DNA variation of the common hippopotamus: evidence for a recent population expansion. Heredity 95, 206–215. [ Links ]
20. Hall T.A. (1999). BIOEDIT: a user-friendly biological sequence alignment editor and analysis program for Windows 95/98/NT. Nucl. Acids Symp. 41, 95–98. [ Links ]
21. Posada D. and Crandall A.K. (1998). MODELTEST: testing the model of DNA substitution. Bioinform. Appl. Notes 14, 817–818. [ Links ]
22. Van de Peer Y. and De Wachter R. (1994). TREECON for Windows: a software package for the construction and drawing of evolutionary trees for the Microsoft Windows environment. Comp. Appl. Biosci. 10, 569–570. [ Links ]
23. Nei M. (1987). Molecular Evolutionary Genetics. Columbia University Press, New York. [ Links ]
24. Excoffier L., Laval G. and Schneider S. (2005). ARLEQUIN version 3.01: An integrated software package for population genetics data analysis. Evol. Bioinform. 1, 47–50. [ Links ]
25. Felsenstein J. (1993). PHYLIP (Phylogeny Inference Package version 3.5c). Distributed by the author. Department of Genetics, University of Washington, Seattle. [ Links ]
26. Excoffier L., Smouse P.E. and Quattro J.M. (1992). Analysis of molecular variance inferred from metric distances among DNA haplotypes, application to human mitochondrial DNA restriction data. Genetics 131, 479–491. [ Links ]
27. Wright S. (1951). The genetic structure of populations. Annal. Eugen. 15, 323–354. [ Links ]
28. Rogers A.R. and Harpending H. (1992). Population growth makes waves in the distribution of pair-wise genetic differences. Mol. Biol. Evol. 9, 552–569. [ Links ]
29. Rozas J. and Rozas R. (1999). DnaSP version 4.0: an integrated program for molecular population genetics and molecular evolution analysis. Bioinformatics 15, 174–175. [ Links ]
30. Harpending H., Batzer M., Gurven M., Jorde L., Rogers A. and Sherry S. (1998). Genetic traces of ancient demography. Proc. Natl Acad. Sci. USA 95, 1961–1967. [ Links ]
31. Tajima F. (1989). Statistical methods for testing the neutral mutation hypothesis for DNA polymorphism. Genetics 123, 585–595. [ Links ]
32. Fu Y.X. and Li W. (1993). Maximum likelihood estimation of population parameters. Genetics 134, 1261–1270. [ Links ]
33. Hudson R.R. (1990). Gene genealogies and the coalescent process. In Oxford Surveys in Evolutionary Biology, eds D.J. Futuyama and J.D. Antonovics, pp. 1–44. Oxford University Press, New York. [ Links ]
34. Nevo E., Rodney L.H., Hiromichi Y. Kimberlyn, N. and Naoto H. (1993). Mitochondrial DNA polymorphisms in subterranean mole rats of the Splax enhenbergi super species in Israel and its peripheral isolates. Mol. Biol. Evol. 10(3), 590–604. [ Links ]
35. Matocq M.D., Patton J.L. and Dasilva M.N.F. (2000). Population genetic structure of two ecologically distinct Amazonian spiny rats: separating history and current ecology. Evolution 54, 1423–1432. [ Links ]
36. Ehrich D. and Stenseth N.C. (2001). Genetic structure of Siberian lemmings (Lemurs sibiricus) in a continuous habitat: large patches rather than isolation by distance. Heredity 86,716–730. [ Links ]
37. Matocq M.D. (2002). Phylogeographical structure and regional history of the dusky-footed woodrat, Neotoma fuscipes. Mol. Ecol. 11, 229–242. [ Links ]
38. Méndez-Harclerode F.M., Delton H.J., Charles F.F., Mary L., Milazzo M.L., Ruthven D.C. and Bradley R.D. (2005). Genetic diversity within the southern plains woodrat (Neotoma micropus) in southern Texas. J. Mammal. 86,180–190. [ Links ]
39. Tajima F. (1989). The effect of change in population size on DNA polymorphism. Genetics 123, 597–601. [ Links ]
40. Braverman J.M., Hudson R.R., Kaplan N.L., Langley C.H. and Stephan W. (1995). The hitchhiking effect on the site frequency spectrum of DNA polymorphisms. Genetics 140, 783–796. [ Links ]
41. Simonsen K.L., Churchill G.A. and Aquadro C.F. (1995). Properties of statistical tests of neutrality for DNA polymorphism data. Genetics 141, 413–429. [ Links ]
42. Fu Y.X. (1997). Statistical tests of neutrality of mutations against population growth, hitchhiking and background selection. Genetics 147, 915–92. [ Links ]
Received 21 July 2007. Accepted 14 October 2008.
* Author for correspondence. E-mail: snyakaana@muienr.mak.ac.ug

