


Serviços Personalizados
Artigo
 Inglês (pdf)
 Artigo em XML
 Referências do artigo
Indicadores

Links relacionados
-
 Citado por Google
 -
 Similares em Google
Compartilhar

 Permalink
South African Journal of Science
versão On-line ISSN 1996-7489
versão impressa ISSN 0038-2353
S. Afr. j. sci. vol.104 no.11-12 Pretoria Nov./Dez. 2008
RESEARCH IN ACTION
Ocean currents south of Africa from drifters
J.V. Durgadoo; I.J. Ansorge; J.R.E. Lutjeharms
Department of Oceanography, University of Cape Town, Private Bag, Rondebosch 7701, South Africa
ABSTRACT
The ocean currents and their variability south of Africa are known to cover a wide spectrum, spatially and possibly temporally. Hydrographic observations in this vast ocean region are logistically demanding and expensive. In recent years the prevalence of drifting buoys has allowed one to infer certain current characteristics for the region that otherwise would be difficult. Observations from satellite-tracked drifters drogued at a depth of 15 m, collected between 1988 and 2005, were used to infer the mean surface circulation and kinetic energy distributions of the surface flow in the African sector of the Southern Ocean between 30 and 60°S. Regions of intensified flow and of higher levels of eddy kinetic energy were identified and agree fairly well with those established from remote sensing products. These results confirm the value of these observations and indicate the increasing usefulness of this data set as the number of drifter tracks increases.
Introduction
The ocean currents south of Africa are unusual in the respect that they cover a very wide range of different current types. On the east coast of southern African the main western boundary current of the southern hemisphere, the Agulhas Current,1 exhibits high speeds over a width of about 100 km. South of Africa this current terminates in a retroflection2 that has some of the highest observed variability in the world ocean. It sheds large Agulhas rings by loop occlusion that have been estimated to be the largest eddies in the world.3 Subsequent to spawning, these rings move into the South Atlantic, where they undergo interaction among themselves and with Cape Basin cyclones in a region that has become known as the 'Cape Cauldron'.4
That part of the water masses of the Agulhas Current that is not taken up by new Agulhas rings moves eastward along the Subtropical Convergence as the Agulhas Return Current.5 This current also exhibits enhanced mesoscale turbulence up to 70°E, where its flow is spent. South of the Subtropical Convergence the wide expanse of the Southern Ocean is dominated by the eastward flowing Antarctic Circumpolar Current (ACC). Increased speeds in this current are found at the zonal fronts6 that form part of this current and where it crosses prominent features of the bottom topography.7 The sensitivity of the potential vorticity of the ACC to shallow bathymetry is responsible for enhanced mesoscale variability7 directly downstream of mid-ocean ridges,8 suggesting that the geographic distribution of such turbulence is inhomogeneous. Indeed, direct measurements near the Drake Passage,9 south of Africa,10 south of Tasmania11 and south of New Zealand12 have shown consistent meridional eddy fluxes across the ACC that are of considerable climatological importance. It has also been shown that this eddy creation in the ACC is particularly evident at the South-West Indian Ridge near the Prince Edward Islands, where eddies are formed10,13 that have a big impact on the biological environment of these islands.14,15
To improve our knowledge of the surface currents in the ocean and their variability, the Global Drifter Program maintains a worldwide 5° × 5° array of satellite-tracked surface-drifting buoys. Satellite-tracked drifters have become invaluable tools for studying ocean circulation especially in high latitude regions, where data collection is severely limited for logistical reasons. Deployed in large numbers, surface drifters enable a mapping of the near-surface circulation and associated mesoscale features. A substantial drifter database is now available in the African sector of the Southern Ocean. Although South Africa was among the pioneers to use and deploy drifters,16,17 only a few localized studies using drifters have been undertaken to date.10,18–20
The Southern Ocean's eddy kinetic energy field was first documented using drifter data obtained during the FGGE experiment.21–23 These results were qualitatively consistent with earlier estimates and the general circulation was in good agreement with contemporary knowledge. Some discrepancies in values were noted also, however, mainly because of the differences in data sets used to compare results. Such an investigation, with a considerably enhanced data set acquired later, has not been repeated south of Africa until now.
Data and methods
Drifter data for the study reported here were acquired from the Data Assembly Center (DAC) at the Atlantic Oceanographic and Meteorological Laboratory (AOML) of the US National Oceanic and Atmospheric Administration. Observations are transmitted via Service Argos to the AOML, where they are quality-controlled, interpolated in 6-hour intervals and then publicly distributed. In June 2005, data from approximately 2110 drifters were available for the Southern Ocean (south of 30°S). Each drifter is equipped with a holey-sock drogue, centred at a depth of ~15 m, and a drogue indicator, which is designed to indicate when the drogue has become detached. When that happens, the drift of the buoy is no longer dominated by the movement at 15 m. Only data from drogued drifters have been used, making the data set uniform while, at the same time, not compromising the spatial resolution of available data. The resulting data set encompasses about 1140 drifters for the entire Southern Ocean, which is almost four times bigger than the FGGE drifter data set.
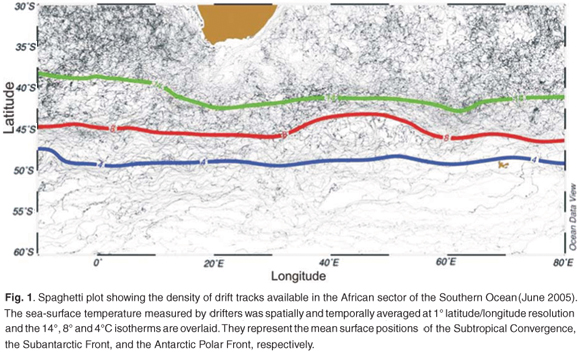
The focus for this study, however, is the African section of the Southern Ocean (10°W–80°E; 30–60°S); the distribution of drift tracks in this region is shown in Fig. 1. As might be expected, the density of drifter tracks is geographically inhomogeneous. In the Southern Ocean there is a significant meridional decrease poleward, with few drifters south of 50°S. Densities in the relatively sluggish currents of the south-eastern Atlantic and the south-eastern Indian oceans are relatively high. There is an indication that tracks bunch at the Subtropical Convergence southeast of Africa. As the drifters indicate motion in the Ekman layer, convergence at this front is not unexpected.
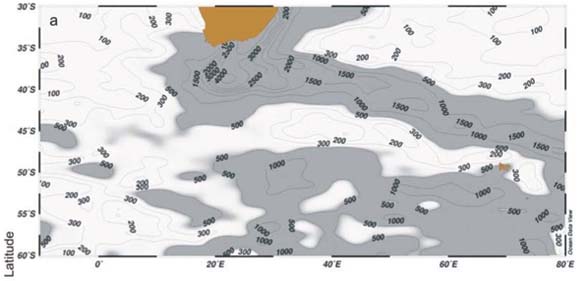
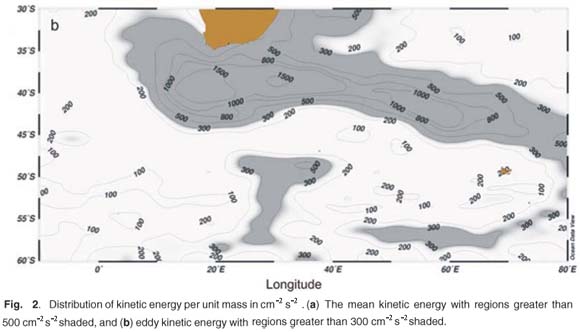
The mean kinetic energy (MKE) and eddy kinetic energy (EKE) per unit mass were calculated for each 1° latitude/longitude square (Fig. 2) as follows:
where u and n are the velocity components. The over-bar indicates the temporal mean and the prime the deviation from the mean.
Results and discussion
Figure 1 shows the average surface positions of the three main frontal features associated with the ACC. The structure of the fronts is known to be complex south of the African continent. Demarcating the northern boundary of the ACC, the Subtropical Convergence is extremely energetic (see Fig. 2) as a result of its juxta- position to the Agulhas Return Current. Further south, in the vicinity of the South-West Indian Ridge, the Subantarctic Front (SAF) and the Antarctic Polar Front (APF) usually show very stochastic behaviour.24 Multiple filaments of the SAF and APF have been observed24,25 and often these branches merge, resulting in strong biological barriers26 in that region. Notwithstanding this temporal variability, the average positions of the fronts portrayed in Fig. 1 are consistent with previous work of this kind.6,25 Analysis of the FGGE collection of drifters has shown three bands of high buoy density corresponding to the locations of the three major frontal features of the ACC,27 suggesting convergence of the upper water column at all these fronts.
The mean near-surface velocity at 1° × 1° resolution is shown in Fig. 3. The relatively sluggish currents in the subtropical gyres hardly ever exceed speeds of 30 cm s–1. By contrast, the speeds in the Agulhas Current, close to the eastern and southern shelf of South Africa, exceed 30 cm s–1 on average. This compares well with in situ observations by current meter arrays28 that show current speeds in the core of the current exceeding 160 cm s–1. There are also indications that the current speeds in the Agulhas Current increase downstream, a result that agrees with observations that the volume flux in the current increases downstream.1
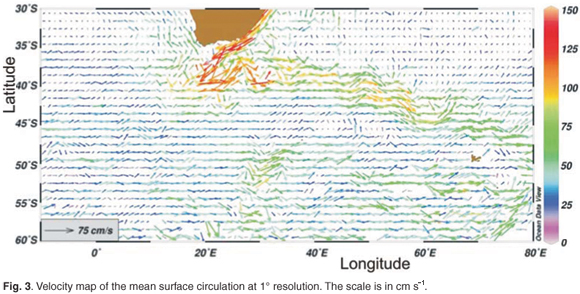
The mean position of the Agulhas retroflection lies at 19°E, where a more complex circulation can be noted (Fig. 3). There also is some indication that there is enhanced equatorward motion south-west of the southern tip of Africa. This enhancement has been shown19 to arise due to mesoscale products of the Agulhas Current passing by the western side of the Agulhas Bank, the wide continental shelf south of Africa. Bottom topography determines the meandering path of the Agulhas Return Current, which typically lies along 39°S after retroflection and along 45°S further downstream. Several steady-state meanders have been recently observed28 along the axis of the current. The surface velocity gradually decreases in the Agulhas Return Current from 125 cm s–1, between 20–30°E, to 75 cm s–1 at the termination of the current at 70°E. The zonal flow of the Antarctic Circumpolar Current is disturbed by quasi-meridional topographic features. Examples of this are observed at the South-West Indian Ridge (50°S, 30°E) and immediately downstream of the Kerguelen Plateau (55°S, 75°E), where surface speeds exceeding 70 cm s–1 can be noted in both cases.
The kinetic energy (per unit mass) associated with the mean flow shows a similar pattern (Fig. 2a). The Agulhas retroflection is distinctly the most energetic region south of Africa, where the mean energy is of the order of 3000 cm–2 s–2. However, the energy of the variability (Fig. 2b) at the retroflection is lower at 1500 cm–2 s–2. The Agulhas Return Current exhibits mean and eddy kinetic energy of the same order of magnitude along its entire axis. The mean kinetic energy associated with the ACC between 50–60°S is generally greater than 500 cm–2 s–2. The southwest Indian sector of the Southern Ocean is energetic both in its mean flow and in its variability. By contrast, the Atlantic sector is relatively quiescent. Prominent shallow bathymetry in the Southern Ocean affects the potential vorticity of the ACC. As a result, energetic mesoscale variability is observed downstream of ocean ridges and plateaux. Notably, disturbances to the mean flow have been observed to be dominant at the South-West Indian Ridge with EKE in excess of 500 cm–2 s–2. Mesoscale features shed at the ridge13 have been shown to move from a gap in the ridge in a north-easterly direction, creating a distinctive pattern of mesoscale variability. Qualitative comparison of kinetic energy derived from altimetry7,30 reveals that the results shown in Fig. 2 are consistent with previous knowledge. Quantita- tively, however, there are some discrepancies resulting from the inherent differences in the data sets. Furthermore, the energy associated with the turbulent part of the circulation presented here combines the effect of both low and high frequency variations.
Conclusions
Logistical constraints make it difficult to reach certain regions of the ocean, particularly in the Southern Ocean. Even in regions that have been studied, regular monitoring observations subsequently are hard to come by. Satellite remote sensing offers various different products that help to overcome these limitations, but now the Global Drifter Program as well as the ARGO float network31 offer an alternative option of obtaining direct hydrographic observations in such remote areas. Our study shows that the drifter data set now available has the potential to provide further insight into the circulation around the southern African subcontinent. The collection of drifter data analysed here highlights regions of dynamic flow as well as areas of energetic variability. The kinetic energy and circulation of the African sector of the Southern Ocean are adequately represented. Very few localized studies10,18–20 have hitherto been undertaken in South African waters, highlighting the usefulness of drifters. Our study demonstrates the value and efficacy of drifter observations. The drifter database will progressively grow in the next few years. This will allow deeper study of the variability of the surface circulation, possibly on different time scales in the region discussed here.
Furthermore, this analysis gives substantial confidence that observations by drifters are representative of the disparate current characteristics of the region. Whereas satellite observations of altimetry give Eulerian descriptions, drifters can in principle give Lagrangian descriptions of the movement in the Ekman layer. This allows one to backtrack to find out whence water at a certain location comes and track forward to show whither water from a particular region is dispersed. We judge that the growing drifter data set is rapidly becoming adequate to carry out analyses of this nature.
The data used in this study were compiled, quality controlled and interpolated by the Drifter Data Assembly Center (DAC) at NOAA AOML and made freely available at www.aoml.noaa.gov/phod/dac/dactata.html Analyses were carried out using the free software made available by R. Schlitzer (Ocean Data View, www.awi-bremerhaven.de/GEO/ODV). This study was partially funded by the University of Cape Town and the South African National Antarctic Programme. J.R.E.L. thanks the Stellenbosch Institute for Advanced Studies for a special fellowship during which a part of his contribution to this study was made.
1. Lutjeharms J.R.E. (2006). The Agulhas Current. Springer-Verlag, Heidelberg. [ Links ]
2. Lutjeharms J.R.E. and van Ballegooyen R.C. (1988). The retroflection of the Agulhas Current. J. Phys. Oceanogr. 18, 1570–1583. [ Links ]
3. Olson D.B. and Evans R.H. (1986). Rings of the Agulhas. Deep-Sea Res. 33, 27–42. [ Links ]
4. Boebel O., Lutjeharms J.R.E., Schmid C., Zenk W., Rossby T. and Barron C. (2003). The Cape Cauldron: a regime of turbulent inter-ocean exchange. Deep-Sea Res. II 50, 57–86. [ Links ]
5. Lutjeharms J.R.E. and Ansorge I.J. (2001). The Agulhas Return Current. J. Mar. Syst. 30, 115–138. [ Links ]
6. Nowlin W.D. and Klinck J.M. (1986). The physics of the Antarctic circumpolar current. Rev. Geophys. Space Phys. 24, 469–491. [ Links ]
7. Gille S.T., Yale M.M. and Sandwell D.T. (2000). Correlation of mesoscale ocean variability with seafloor roughness from satellite altimetry. Geophys. Res. Lett. 27, 1251–1254. [ Links ]
8. Lutjeharms J.R.E. and Baker D.J. (1980). A statistical analysis of the meso-scale dynamics of the Southern Ocean. Deep-Sea Res. 27, 145–159. [ Links ]
9. Johnson G.C. and Bryden H.L. (1989). On the size of the Antarctic Circumpolar Current. Deep-Sea Res. 36, 39–53. [ Links ]
10. Ansorge I.J., Lutjeharms J.R.E., Swart N.C. and Durgadoo J.V. (2006). Observational evidence for a cross frontal heat pump in the Southern Ocean. Geophys. Res. Lett. 33, L19601, doi: 1029/2006 GL026174. [ Links ]
11. Phillips H.E. and Rintoul S.R. (2000). Eddy variability and energetics from direct current measurements in the Antarctic Circumpolar Current south of Australia. J. Phys. Oceanogr. 30, 3050–3076. [ Links ]
12. Bryden H.L. and Heath R.A. (1985). Energetic eddies at the northern edge of the Antarctic Circumpolar Current in the southwest Pacific. Prog. Oceanogr. 14, 65–87. [ Links ]
13. Ansorge I.J. and Lutjeharms J.R.E. (2003). Eddies originating from the South-West Indian Ridge. J. Mar. Syst. 39, 1–18. [ Links ]
14. Nel D.C., Lutjeharms J.R.E., Pakhomov E.A., Ansorge I.J., Ryan P.G. and Klages N.T.W. (2001). Exploitation of mesoscale oceanographic features by grey-headed albatross Thalassarche chrysostoma in the southern Indian Ocean. Mar. Ecol. Prog. Ser. 217, 15–26. [ Links ]
15. Ansorge I.J., Froneman P.W., Pakhomov E.A., Lutjeharms J.R.E., Perissinotto R. and van Ballegooyen R.C. (1999). Physical-biological coupling in the waters surrounding the Prince Edward Islands (Southern Ocean). Polar Biol. 21, 135–145. [ Links ]
16. Gründlingh M.L (1977). Drift observations from Nimbus IV satellite-tracked buoys in the southwestern Indian Ocean. Deep-Sea Res. 24, 903–913. [ Links ]
17. Gründlingh M.L (1978). Drift of a satellite-tracked buoy in the southern Agulhas Current and Agulhas Return Current. Deep-Sea Res. 25, 1209–1224. [ Links ]
18. Ansorge I.J. and Lutjeharms J.R.E. (2005). Direct observations of eddy turbulence at a ridge in the Southern Ocean. Geophys. Res. Lett. 32, L14603, doi: 10.1029/2005GL0225 88. [ Links ]
19. Lutjeharms J.R.E., Durgadoo J.V. and Ansorge I.J. (2007). Surface drift at the western edge of the Agulhas Bank. S. Afr. J. Sci. 103, 63–67. [ Links ]
20. Durgadoo J.V., Lutjeharms J.R.E., Biastoch A. and Ansorge I.J. (2008). The Conrad Rise as an obstruction to the Antarctic Circumpolar Current. Geophys. Res. Lett. 35, L20606, doi: 10.1029/2008 GL035382. [ Links ]
21. Patterson S.L. (1985). Surface circulation and kinetic energy distributions in the Southern Hemisphere oceans from FGGE drifting buoys. J. Phys. Oceanogr. 15, 865–883. [ Links ]
22. Daniault N. and Ménard Y. (1985). Eddy kinetic energy distribution in the Southern Ocean from altimetry and FGGE drifting buoys. J. Geophys. Res. 90, 11877–11899. [ Links ]
23. Piola A., Figueroa H.A. and Bianchi A.A. (1987). Some aspect of the surface circulation south of 20°S revealed by First GARP Global Experiment drifters. J. Geophys. Res. 92, 5101–5114. [ Links ]
24. Pollard R.T. and Read J.F. (2001). Circulation pathways and transports of the Southern Ocean in the vicinity of the Southwest Indian Ridge. J. Geophys. Res. 106, 2881–2898. [ Links ]
25. Holliday N.P. and Read J.F. (1998). Surface oceanic fronts between African and Antarctica. Deep-Sea Res. 45, 217–238. [ Links ]
24. Pakhomov E.A., Froneman P.W., Ansorge I.J and Lutjeharms J.R.E. (2000). Temporal variability in the physico-biological environment of the Prince Edward Islands (Southern Ocean). J. Mar. Syst. 26, 75–95. [ Links ]
27. Hoffman E.E. (1985). The large scale horizontal structure of the Antarctic Circumpolar Current from FGGE drifters. J. Geophys. Res. 90, 7087–7097. [ Links ]
28. Beal L.M. and Bryden H.L. (1999). The velocity and vorticity structure of the Agulhas Current at 32° S. J. Geophys. Res. 104, 5151–5176. [ Links ]
29. Ochoa J. and Niiler P.P. (2006). Vertical vorticity balance in meanders downstream of the Agulhas retroflection. J. Phys. Oceanogr. 37, 1740–1744. [ Links ]
30. Wilkin J.L. and Morrow R.A. (1994). Eddy kinetic energy and momentum flux in the Southern Ocean: comparison of a global eddy-resolving model with altimeter, drifter, and current-meter data. J. Geophys. Res. 99, 7903–7916. [ Links ]
31 Gille S.T. (2003). Float observations of the Southern Ocean: Part 1, Estimating mean fields, bottom velocities and topographic steering. J. Phys. Oceanogr. 33, 1167–1181. [ Links ]
Author for correspondence. E-mail: jdurgadoo@gmail.com

