Services on Demand
Article
Indicators
Related links
-
 Cited by Google
 -
 Similars in Google
Share
South African Journal of Science
On-line version ISSN 1996-7489
Print version ISSN 0038-2353
S. Afr. j. sci. vol.104 n.9-10 Pretoria Sep./Oct. 2008
RESEARCH LETTERS
The effect of nitrogen on the co-segregation with molybdenum in a Fe–3.5wt%Mo–N(100) single crystal
W.A. JordaanI, II; J.J. TerblansI, *; H.C. SwartI
IDepartment of Physics, University of the Free State, P.O. Box 339, Bloemfontein 9300, South Africa
IINational Metrology Institute of South Africa, Private Bag X34, Pretoria 0040, South Africa
ABSTRACT
In this study, the co-segregation of molybdenum and nitrogen to the (100) surface of an iron single crystal was investigated by studying a Fe–3.5wt%Mo–N single crystal. Ternary segregation systems are considerably more complex than binary systems in the sense that there are seven unknown segregation parameters to determine, as opposed to three for a binary system. A novel approach was undertaken to minimize the number of unknown variables and thus reduce the calculation time needed for the ternary system, by first analysing the segregation behaviour of molybdenum in a binary system [Fe–3.5 wt%Mo(100)] that was exposed to a nitrogen ambient. Exposing the binary crystal to nitrogen at high temperatures, the molybdenum segregated to the surface. The segregation profiles of the two systems were acquired at constant temperatures in the range 797–888 K using Auger electron spectroscopy (AES). The segregation profiles were fitted with the modified Darken model and the segregation parameters, namely, the pre-exponential factor (D0), activation energy (E), segregation energy (ΔG) and the interaction energies (ΩFe-Mo, ΩFe-N, and ΩMo-N) for molybdenum and nitrogen, were determined. For the binary system the segregation parameters for molybdenum were: D0,Mo = 2.4 ×100±1 m2 s–1, EMo = 323 ± 16kJ mol–1, and ΔGMo = –38 ± 5 kJ mol–1. These segregation parameters were then used as initial values to fit the experimental data of the ternary system. The segregation parameters for molybdenum in the ternary system were determined as: D0,Mo = 1.9 ×10⁻⁴±1 m2 s–1, EMo =271 ± 11kJ mol–1 and ΔGMo= –32 ± 5 kJ mol–1. The segregation parameters for nitrogen in the ternary system were D0,N = 2.8 ×10–0±3 m2 s-1, EN = 323 ± 43 kJ mol–1 and ΔGN = –19 ± 3 kJ mol–1. The interaction energy between molybdenum and nitrogen was ΔΩMo-N = –19 ±3 kJ mol–1.
Introduction
During the manufacturing process of automotive components, metallic alloys are often heated for prolonged periods. At such high temperatures, elements of low bulk concentration (even a few ppm) have high mobilities and tend to diffuse to the surface and grain boundaries. This phenomenon is known as segregation and it may be a significant hurdle for manufacturers, as it can cause failure of components that were heated, welded or operating at elevated temperatures, to name a few examples.1–3 Segregation studies thus had their origin in finding solutions to temper embrittlement caused by grain boundary segregation and it has been extensively investigated by pioneers such as McLean.4 With the advent of surface analysis techniques, these studies became experimentally viable and indispensable.
Segregation is defined as the exchange of atoms between the surface layer and bulk solid until equilibrium is reached. Traditionally, the concentration gradient was seen as the driving force behind segregation and diffusion equations such as that of Fick were used to derive segregation models.5 However, the only parameters that can be determined via Fick's equation are the pre-exponential factor (D0) and the activation energy (E). Today, an all-encompassing thermodynamic view of segregation demands that the excess energy of the system is rather viewed as the driving force behind segregation. From this premise, the set of modified Darken differential equations can be derived. Using the Darken approach, additional parameters, namely the segregation energy and the interaction coefficients, can be calculated. One of the main advantages of the Darken model is that it describes both the kinetic and equilibrium parts of the segregation profile unlike other theories, which describe only one or the other.
In recent years, there has been an increased interest in multicomponent-and co-segregation. Often, it is found that non-metallic strong segregants, such as carbon and nitrogen, segregate with metals such as titanium, molybdenum and chromium which themselves are weak or non-segregating species. This behaviour can be explained by an attractive interaction between the segregants. The formation of epitaxially stable, two-dimensional, surface compounds often takes place during co-segregation.
Theory
One of the earliest theories to explain and predict equilibrium segregation for binary system was that of McLean4 and for ternary systems it was Guttman's equation.6 The Guttman equation includes the interaction (Ωx-y) between the segregating species as well as the interaction between segregating species and the matrix element (Ωx-M, Ωy-M) ). This study focused on both segregation kinetics and segregation equilibrium. The Darken model has proved to be quite successful and easy to apply to binary systems, but for ternary systems the number of unknown variables and the computing power required to resolve the segregation profiles to extract the segregation parameters can be daunting. To shorten the calculation time, Fick's equation was used to determine diffusion parameters D0 and E, which in turn were used as initial estimates in the Darken calculations.
Fick's equation
During segregation, atoms move to the surface via diffusion. One can therefore use Fick's second law5 to describe the kinetics of segregation. If it is assumed that there is no interaction between the atoms that segregate to the surface, then the rate at which atoms are transferred from the bulk layer to the surface will be independent of the surface concentration of the segregated atoms at the surface. It can be seen as if the atoms are removed from the surface as soon as the atoms arrive there. Mathematically, it means that the surface concentration is kept zero at all times. It is also assumed that the bulk concentration of the segregating species is constant throughout the crystal at time t = 0.
Solving Fick's equation for the boundary conditions
C = CB for x > 0 and t = 0
C = 0 for x = 0 and t = 0
the following equation can be derived:10

where Cφ is the surface concentration, CB is the bulk concentration, x is the distance from the surface, t is time, D is the diffusion coefficient, and d is the thickness of the segregated layer.
Modified Darken theory
Most other theories, such as the Fick equation, consider the concentration gradient to be the driving force behind segregation. However, this is contradictory to physical reality, as the diffusion of atoms takes place from a low concentration in the bulk to a high concentration on the surface. Segregation takes place because the total energy of the system is not a minimum when the surface and bulk have the same concentration values. It can be shown that only the Gibbs free energy needs to be considered in this case and that the change in concentration for each atomic layer can be expressed as7
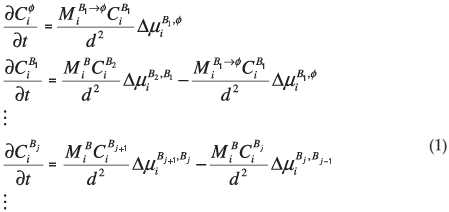
where d is the thickness of the segregated layer, t is time,  is the fractional concentration of species i in the surface layer,
  is the fractional concentration of species i in bulk layer j, Mi is the mobility of the atoms. For an ideal solution the mobility is related to the diffusion coefficient Di by Di = MiRT,
  is the difference in chemical potential of species i in layers Bj+1 and Bj. This system of differential equations can be solved numerically, by using the variable step size Gear method.8
Experimental setup
The crystals used in this study were acquired from the Max-Plank-Institut für Eisenforschung. The crystals were made according to the Bridgman method and contained 96.5 wt% Fe and 3.5 wt% Mo. The ternary crystal contained 10 wt.ppm N determined via atomic absorption. The samples (5 mm ×5 mm ×1.5 mm) were cut with spark-erosion to ±1° of the desired crystallographic orientation. Prior to analysis, the crystals were mechanically polished to 0.05 µm using alumina paste until a mirror-like finish was obtained. The crystals were placed in an Auger UHV-system for analysis.
The Auger UHV-system, equipped with a Physical Electronics PHI 25-110 single pass cylindrical mirror analyser (CMA), a PHI 18-085 electron gun and a Perkin Elmer 04-303 ion gun was used for the measurements reported in this paper. The Auger measurements on each crystal were performed with the following instrumental settings: base pressure 5.1 ×10⁻⁹ torr, primary electron beam of energy 3 keV with a beam current of 15 µA, modulation energy of 4 eV and a scan rate of 2 eV/s. Segregation profiles of the two segregating systems were recorded at constant temperatures ranging from 797–888 K using Auger electron spectroscopy (AES). AES was used to monitor the surface concentration of Fe, Mo and N as a function of time at different temperatures. All these measurements were performed by computer using VisiScan software.9
A calibrated infrared (IR) thermometer was used to measure the true surface temperature of the crystals in the UHV-system. The IR thermometer could be calibrated by using a substitute Fe single crystal and a calibrated type K thermocouple that was mounted on the surface of the dummy Fe single crystal. To ensure that the emission characteristics were the same for all the samples, the substitute crystal, used to calibrate the IR thermometer, was also mechanically polished to 0.05 µm.
The samples inside the UHV-system were first cleaned of contaminants (C, S, O) using the following procedure: 1) The sample was sputtered using 2-keV Ar+ ion bombardment and rastered over an area of 5 mm ×5 mm at room temperature for 10 minutes. 2) It was then annealed at 1100 K and sputtered again for ~10 minutes. 3) It was further annealed at 1100 K for ~20 minutes without sputtering to level off any concentration gradients of the bulk dopants and to restore the crystalline structure. Steps 1, 2 and 3 were repeated several times to ensure a clean sample for the remainder of the investigation.
The segregation profiles were recorded by using the following procedure: In the case of the binary alloy, nitrogen was leaked into the system until the pressure in the chamber was 5.0 ×10⁻⁷ torr. First, the sample was heated to the required temperature. This was done automatically by the computer, using the IR thermometer as reference. Once the temperature was stable (~10 minutes), the sample was sputter cleaned for 400 seconds and data acquisition started immediately after the sputtering. The Auger peaks for Fe (701 eV), Mo (221 eV) and N (380 eV) were recorded as a function of time. The data recording was stopped once equilibrium was reached and then a full Auger spectrum was acquired to ensure that no other species segregated or that oxidation had occurred. A large number of Auger peak shapes were collected, which decreased the scattering in the data and therefore increased the accuracy of the fits.
Results
The Auger peak-to-peak heights were converted to surface concentration using the Tanuma, Powell and Penn (TPP-2)10 approximation for the inelastic mean free path and the backscattering of Shimizu11 for electrons. It was also assumed that the Mo and N layer that formed on the surface was a monolayer.
Binary system
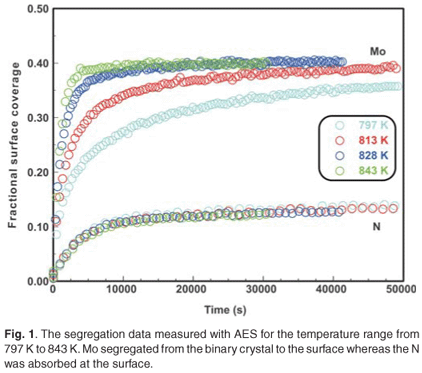
When the Fe–3.5 wt%Mo(100) single crystal was exposed to a nitrogen ambient of 5 ×10⁻⁷ torr at temperatures ranging from 797–871 K, it was observed that Mo segregated to the surface (Fig. 1). (The Mo segregated only in the presence of nitrogen on the surface.) As can be seen, the Mo concentration is dependent on the N concentration and during the initial segregation up to 1000 seconds, it was observed that the Mo segregation rate (the slope of the curve) was temperature dependent, but that the nitrogen adsorption rate was almost constant for all temperatures. At equilibrium, the Mo concentration was approximately four times that of N (40 at% and 10 at%, respectively).
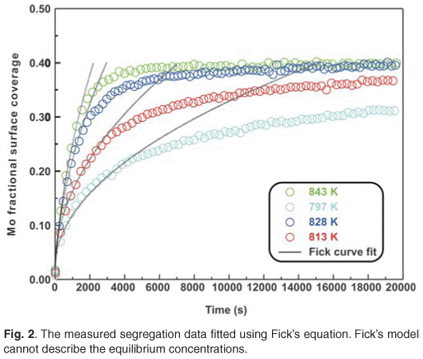
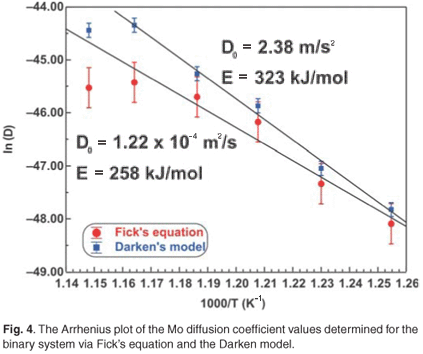
The experimental data were fitted with the Fick Constant Temperature software package as shown in Fig. 2. The values of all fitting parameters (Mo bulk concentration 2.2 at%, and the distance between the atomic layers 2.886 Å) were left unchanged, except the period over which the curve fits were done. From the curve fits, the diffusion coefficients of Mo in Fe were calculated for the temperature range 813–871 K (as shown in Table 1). The calculated diffusion coefficients were then plotted on an Arrhenius graph and fitted with the Arrhenius equation  as shown in Fig. 3. From the intercept, the pre-exponential factor D0 was calculated to be 1.2 ×10⁻⁴ ± 2 m2 s–1 and from the slope the activation energy E was calculated to be 258 ± 33 kJ mol–1.
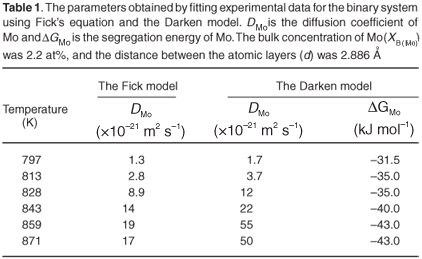
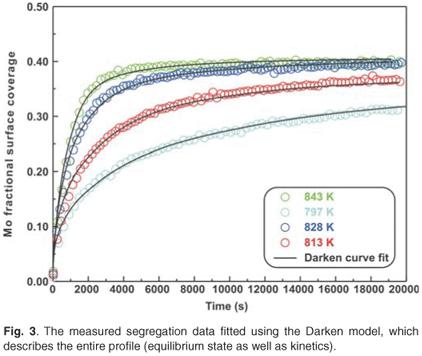
The experimental data were also fitted with the binary Darken model using the Darken 2C software package.12 The diffusion coefficients determined with the Fick curve fits were used as starting values for the Darken curve fits. The latter are shown in Fig. 4. From the graph it is clear that the Darken model describes both the equilibrium and kinetic parts of the segregating profile. In addition to the segregation parameters that were determined using the Fick curve fits, the Darken model has the advantage of providing the segregation energy ΔG as well. The value was found to be in the range of –31.5 kJ mol–1 to –43.0 kJ mol–1 and compares favourably with the value of –15 kJ mol–1 determined by Uebing et al.13 Figure 3 shows the Arrhenius plot of the diffusion coefficients that were determined (Table 1). From the regression line, the pre-exponential factor D0 was determined to be 2.4×100±1 ms–1 and the activation energy E as 323 ± 16 kJ mol–1. These values are in good agreement with those determined via radioactive tracer methods,16 which are 7.8 ×10⁻¹ m2 s–1and 306 kJ mol–1, respectively.
Ternary system
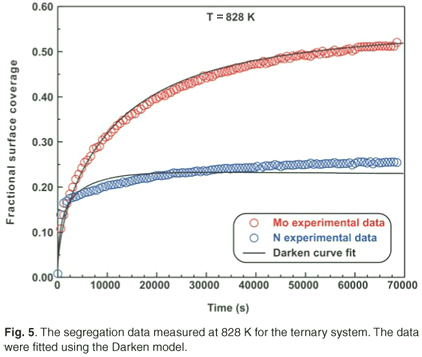
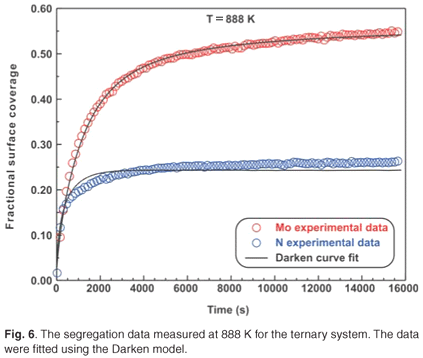
The ternary system analysed in this study was a Fe–3.5 wt% Mo(100)–N single crystal. When exposed to high temperatures ranging from 828 K to 888 K, it was observed that Mo and N co-segregated to the surface. The segregation data measured at 828 K are shown in Fig. 5. The experimental data for the ternary system were also fitted using the modified Darken approach with the Darken 3C software package.14 For the sake of conciseness, only the curve fits for the highest temperatures are shown (see Figs 5 and 6). While the segregation of the two elements depends on each other, it was observed that the segregation rate of N was considerably higher than that of Mo. At equilibrium, the Mo concentration was 50 at% and the N concentration was 25 at%, corresponding to a Mo:N ratio of 2:1.
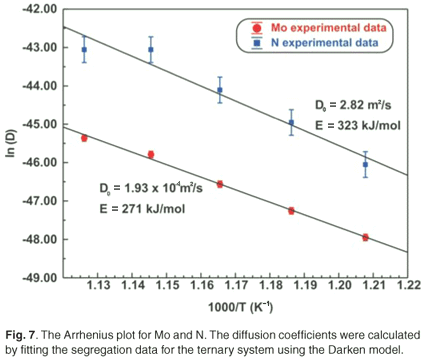
Fick's equation does not describe co-segregation as it is assumed that surface species do not interact with each other, yet it is still useful in determining the diffusion coefficients of the segregating species. The D values of Mo and N are summarized in Table 2. The Arrhenius plots of the two species are shown in Fig. 7. From the linear regressions the pre-exponential factor for Mo was calculated as 3.6 ×10²±1 m2 s–1 and for N it was found to be 4.1×10⁻¹±2 m2 s–1. The activation energies were calculated as 308 ± 20 kJ mol–1 and 210 ± 40 kJ mol–1 for Mo and N, respectively.
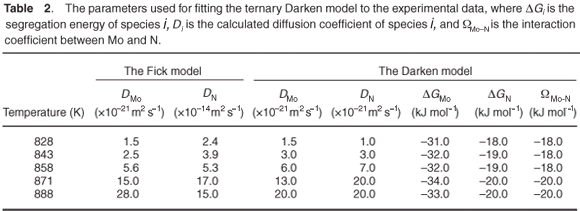
The segregation parameters determined using the Darken model are listed in Table 2. The model describes both the kinetics and equilibrium state and, in the case of the ternary system, additional information is acquired, namely the segregation energies of Mo and N, ΔGMo and ΔGN, as well as the interaction coefficient between the two elements, ΩMo-N. The average ΔGMo value was determined to be –32 kJ mol–1 and the average value of ΔGN was –19 kJ mol–1. The average interaction coefficient, ΩMo-N , was determined to be –19 kJ mol–1. A summary of the effect of the different parameters involved in the segregation process can be found in Swart et al.15 Simulations were conducted for different interaction parameters, different bulk concentrations of the species, different segregation energies of the species and different mobilities (diffusion coefficient and activation energy).
The Arrhenius plots for the Mo and N diffusion coefficients are shown in Fig. 7. From the linear regressions, the activation energies for Mo and N in Fe were calculated to be 271 ± 11 kJ mol–1 and 323 ± 43 kJ mol–1, respectively. The pre-exponential factors were calculated to be 1.9 ×10⁻⁴±1 m2 s–1 and 2.8 ×100±3 m2 s–1, respectively.
Conclusions
The number of unknown variables for the ternary system was minimized by analysing the segregation behaviour of molybdenum in a binary system [Fe–3.5 wt%Mo(100)] that was exposed to a nitrogen ambient. From the binary system the pre-exponential factor D0 and activation energy E were calculated for molybdenum diffusing in an iron matrix. It was assumed that the diffusion behaviour of molybdenum in the ternary system would be nearly the same as in the binary system. The segregation values of the binary system were therefore used as starting values for the ternary Darken fits. It should be mentioned, however, that for the binary system the diffusion coefficient at high temperature deviated from the expected values due to nitrogen desorption (see Fig. 3). Though the Darken method could not exactly model the ternary system, the results were encouraging.
For comparison, the Mo Arrhenius plots for both systems are shown in Fig. 3. The D0 values of Mo vary between 1.2 ×10⁻⁴ m2 s–1 and 5.5 ×100 m2 s–1 and the E values between 258 kJ mol–1 and 345 kJ mol–1. These values are comparable to 7.8 ×10⁻¹ m2 s–1 and 306 kJ mol–1, determined using radioactive tracer methods.16 The segregation energy of Mo was also determined for the binary system and was found to be –38 kJ mol–1. Maruyama et al.17 found it to be –28 kJ mol–1 using the Langmuir-McLean equilibrium method. For the ternary system, it was calculated as –32 kJ mol–1 and Uebing et al.18 found it to be –15 kJ mol–1, also using equilibrium methods.
For nitrogen, the pre-exponential factors were in the range 4.1 ×10⁻¹ m2 s–1 to 2.82 ×100 m2 s–1. The activation energies (E), in these cases, were found to be between 210 kJ mol–1 and 323 kJ mol–1. The segregation energy of N was determined by the Darken model as –19 kJ mol–1. The interaction coefficient between Mo and N was determined as –19 kJ mol–1. This value compares favourably with the value of –35 kJ mol–1 determined by Uebing et al.18
This new fitting procedure has greatly shortened the calculation time to fit the ternary segregation data.
The contributions of J. du Plessis and E.C. Viljoen are greatly acknowledged as well as the financial contribution of the National Research Foundation.
1. Samson Y., Rousset J.L., Bergeret G., Tardy B., Bertolini J.G. and Laroze G. (1993). On the surface segregation of silicon in Cu3Si. Appl. Surf. Sci. 72, 373–379. [ Links ]
2. Guy A.G. (1972). Introduction to Materials Science. McGraw-Hill Kogokusha, Tokyo. [ Links ]
3. Guy A.G. (1976). Essentials of Materials Science. McGraw-Hill Kogokusha, Tokyo. [ Links ]
4. McLean D. (1957). Grain Boundaries in Metals. Oxford University Press, Oxford. [ Links ]
5. Crank J. (1975). The Mathematics of Diffusion, 2nd edn. Oxford University Press, Oxford. [ Links ]
6. Guttman M. (1975). Equilibrium segregation in a ternary solution: A model for temper embrittlement. Surf. Sci. 53, 213–227. [ Links ]
7. du Plessis J. (1990). Diffusion and defect data – Surface segregation. Solid State Phenomena 11, 74. [ Links ]
8. NAG Routines Mark 11. Numerical Algorithm Group, Oxford. [ Links ]
9. Terblans J.J. (1997). Die ontwikkeling van 'n sagtewarepakket vir die beheer van en die dataverwerking vanaf 'n skandeeraugermikroskoop. M.Sc. thesis, University of the Free State, Bloemfontein. [ Links ]
10. Tanuma S., Powell C.J. and Penn D.R. (1991). Calculations of electron inelastic mean free paths. II. Data for 27 elements over the 50–2000 eV range. Surf. Interf. Anal. 17(13), 911–926. [ Links ]
11. Shimizu R, (1983). Quantitative analysis by Auger electron spectroscopy. Jpn. Appl. Phys. 22, 1631–1642. [ Links ]
12. Terblans J.J. (2003). Darken 2C fitting software. University of the Free State, Bloemfontein. [ Links ]
13. Eltester B. and Uebing C. (1996). Surface segregation phenomena on Fe–3.5%Mo–N(100): the formation of a MoN surface compound. Surf. Sci. 347(1-2), 39–45. [ Links ]
14. Terblans J.J. (2004). Darken 3C fitting software. University of the Free State, Bloemfontein. [ Links ]
15. Swart H.C., Roos W.D. and Terblans J.J. (2004). Surface segregating kinetics in a ternary system. Surf. Interf. Anal. 36(4), 285–289. [ Links ]
16. Lide D.R. (1997). Handbook of Chemistry and Physics, pp. F48–F50. CRC Press, New York. [ Links ]
17. Maruyama N., Smith G.D.W. and Cerezo A. (2003). Interaction of the solute niobium or molybdenum with grain boundaries in α-iron. Mat. Sci. Eng. A 353(1–2), 126–132. [ Links ]
18. Uebing C. and Viljoen E.C. (1998). Effect of nitrogen and sulphur on the segregation of molybdenum on single crystalline Fe–3.5%Mo–N,S alloys. Surf. Sci. 410(1), 123–131. [ Links ]
Received 4 August. Accepted 20 October 2008.
* Author for correspondence. E-mail: terblansjj.sci@ufs.ac.za


