Services on Demand
Article
Indicators
Related links
-
 Cited by Google
 -
 Similars in Google
Share
South African Journal of Science
On-line version ISSN 1996-7489
Print version ISSN 0038-2353
S. Afr. j. sci. vol.104 n.9-10 Pretoria Sep./Oct. 2008
RESEARCH ARTICLES
Frequency dependence of dispersive phonon images
K. Jakata‡; A.G. Every
School of Physics, University of the Witwatersrand, Private Bag 3, WITS 2050, South Africa
ABSTRACT
In the past, lattice dynamics models have been used in interpreting dispersive phonon focusing patterns of crystals. They have had mixed success in accounting for observed images and, moreover, different models applied to the same crystal tend to differ significantly in their predictions. In this paper we interpret observed phonon focusing images of two cubic crystals, germanium and silicon, through an extension of continuum elasticity theory that takes into account the first deviation from linearity of the phonon dispersion relation. This is done by incorporating fourth-order spatial derivatives of the displacement field in the wave equation. The coefficients of the higher-order derivatives are determined by fitting to phonon dispersion relations for the acoustic branches measured by neutron scattering in the [100], [111] and [110] symmetry directions. With this model we simulate phonon images of Si and Ge projected onto the (100), (110) and (111) observation planes. These are able to account well for the observed phonon images.
Introduction
At liquid helium temperatures, acoustic phonons in non-metallic crystals acquire macroscopic mean free paths, and can be observed with heat pulse techniques to travel ballistically through a sample, rather than diffusively as in heat conduction. Phonon imaging is a technique for studying the pronounced directionality of ballistic phonon flux in crystals (see Fig. 1). In this technique a highly focused pulsed laser or an electron beam is used to excite non-equilibrium phonons at a small spot on the surface of a crystal immersed in a liquid helium bath at a temperature of about 2 K.1 The ballistic phonon flux emanating from this heated spot is detected on the opposite face of the crystal with a bolometric or frequency-selective tunnel junction detector. Small detector sizes are required, 10–30 µm2, for good angular resolution of the ballistic phonon flux.1
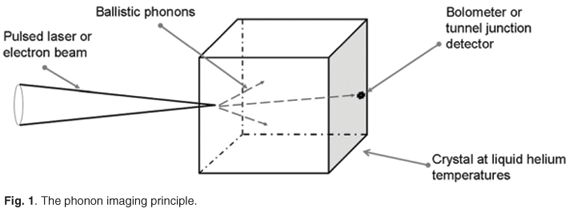
Raster scanning the phonon source with the detector at a fixed position (the converse is less convenient) results in a two-dimensional 'phonon image' representing the spatial anisotropy of the heat flux in the crystal. Phonon images reveal pronounced anisotropy of the phonon flux, mainly due to an effect called phonon focusing, which is the central theme of this paper. A number of calculated and experimental phonon images for germanium and silicon are shown later in the paper. All of the measured images have been reproduced with permission from the authors. Brighter regions in these images correspond to higher phonon intensity, with the very intense sharp lines being caustics where the phonon flux is mathematically infinite.
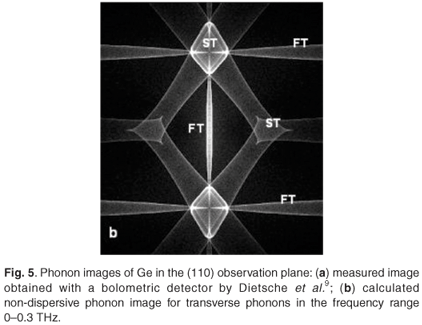
The detected signal in phonon imaging consists of a number of pulses corresponding to the arrival of phonons belonging to the fast transverse (FT), slow transverse (ST) and longitudinal (L) acoustic branches. The labels in the phonon image in Fig. 5(b) refer to structures due to the FT and ST modes of phonon propagation. The longitudinal mode is not included in our phonon imaging calculations for reasons explained in a later section.
The wave equation and effects of dispersion
The propagation of long wavelength phonons in a crystal is well accounted for by continuum elasticity theory. Assuming homogeneity of the elastic constant tensor, Cijlm, and density ρ, the wave equation for the displacement field ui in a general anisotropic solid is

Equation (1) admits harmonic plane wave solutions of the form ui = Uiexp[i(k·r – ωt), where k is the wave vector and ω the angular frequency, subject to
ρω2Ui = CijlmkjkmU1.
This is usually written in the form known as Christoffel's equation,

where
Γil = Cijlmnjnm / ρ,
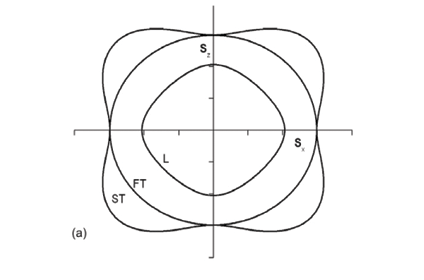
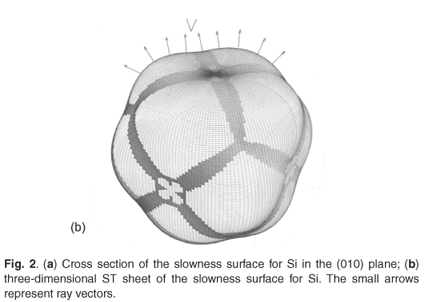
is the Christoffel matrix and ni are the direction cosines of k, i.e. n = k/k, and δil is the Kronecker delta. This is a set of three equations for the components of the unit polarization vector Ui. The eigenvalues of Equation (2), ν2, are the squares of the phase velocities of the three modes of polarization of the acoustic waves. The slowness or inverse phase velocity vector is defined as s = k/ω = n/ν with direction along k. A radial plot of the locus of the slowness vectors gives the slowness surface. This surface has the shape of the constant frequency surface in k-space. A cross section of the three sheets of slowness surface in the (010) plane for Si is shown in Fig. 2(a). Except for the longitudinal sheet, which is entirely convex, three-dimensional slowness sheets have regions of convex, concave and saddle curvature. The lines separating these regions are parabolic lines where the Gaussian curvature is zero. A three-dimensional plot of the ST sheet of the slowness surface of Si is shown in Fig. 2(b). Shaded regions are of saddle curvature and unshaded regions are of convex or concave curvature.
The group velocity or ray vector of a phonon in an elastically anisotropic medium is given by the gradient of ω(k),

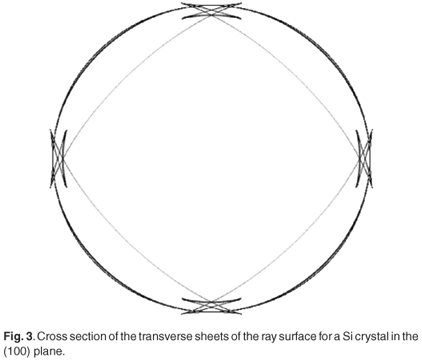
Equation (3) implies that rays are normal to their constant frequency or slowness surface, as depicted in Fig. 2(b) by the arrows. The collection of these rays defines the ray surface. The ray surface has a complicated shape with folds corresponding to parabolic lines on the slowness surface as shown in Fig. 3, which depicts a (100) cross section of the transverse sheets of the ray surface of Si. The cusps in this figure arise from the sectioning of the folds in the ray surface.
The wave vectors near parabolic lines have nearly the same rays, which cluster strongly at the folds, and these map onto lines of infinite phonon intensity in the phonon image, the caustics.2 The acoustic surfaces of Si and Ge are similar in shape but differ in size by about a factor of 2.
Dispersive phonon imaging
In order to accommodate the effects of the first onset of spatial dispersion within continuum elasticity theory for centrosymmetric crystals such as Ge and Si, the wave equation is modified to include fourth-order spatial derivatives of the displacement field (see DiVincenzo3),

The coefficients of the first term on the right, cijlm, are the conventional non-dispersive elastic constants, while the coefficients of the higher-order term, fijlmnk, are the dispersive elastic constants.
Assuming a plane wave solution to Equation (4) of the form ui = Uiexp[i(k·r – ωt)], we obtain the linear equations for the polarization vector Ui,

and associated secular equation

which represents the dispersion relation Ω(k, ω) = 0.
For crystals of cubic symmetry, the elastic tensor cijlm has three independent components, which in the Voigt notation are C11, C12 and C44. The f tensor has six independent components called f1, f2, f3, f4, f5 and f6.3
Writing Equation (5) in the form ρω2Ui = DijUj, the components of the dynamical matrix are given by3

and

Using Equations (7) and (8), one can derive expressions relating the wave vector and the frequency along the symmetry directions of a centrosymmetric cubic crystal, which we fit to published neutron scattering data to obtain the values of the Cαβ and the fi terms. For the longitudinal and two degenerate transverse modes in the [100] direction, these expressions are

Along the [111] direction, the expressions for the L and the two degenerate T modes are
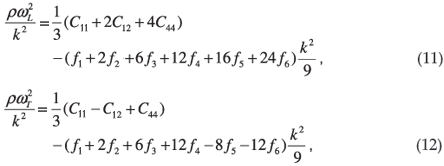
and finally, the dispersion relations for the [110] direction, where the transverse modes are not degenerate, are
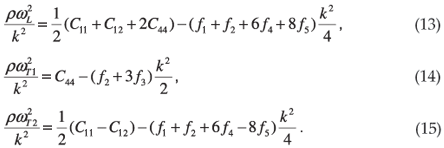
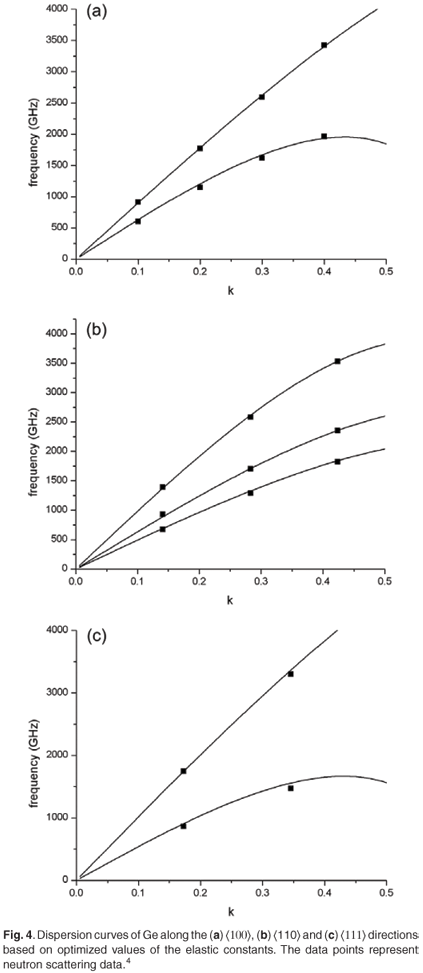
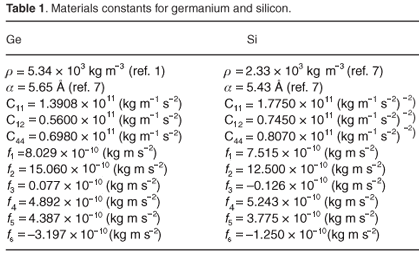
In fitting these dispersion relations to neutron scattering data for these symmetry directions, we are confronted with two over-determined problems. One is for the non-dispersive elastic constants for which there are seven equations for the three parameters, derived from the initial slopes of the measured dispersion relations of the acoustic branches. The other is for the six dispersive elastic constants for which there are again seven equations, derived from the initial curvatures of the measured dispersion relations. We have obtained the values of the parameters from optimized fitting to neutron scattering data for frequency ω, versus reduced wave vector k up to 0.4 (in units of 2π/α, where α is the lattice parameter of the crystal). For germanium, data were obtained from Nilsson and Nelin.4 Data for silicon along the [100] and [111] directions and for the longitudinal and one of the transverse acoustic modes in the [110] directions was obtained from Dolling.5 For the remaining transverse acoustic mode in silicon, data were extracted from Nilsson and Nelin.6 The value of the parameter fits are listed in Table 1.
The fit of the calculated dispersion curves to neutron scattering data for germanium is shown in Fig. 4. The data points represent neutron scattering data extracted from ref. 4. Generalized continuum elasticity theory fits well the experimental dispersion relation data up to about k = 0.4 but not much beyond that. This is because the extension of continuum theory involves a truncated Taylor series expansion of the real microscopic lattice dynamics and must eventually fail.3,7,8 This model is therefore limited to the first bending over of the dispersion curves. It does not apply to phonons near the Brillouin zone boundary, which do not in any case have a significant effect in phonon imaging because of their small group velocities and high scattering probabilities. Similar quality fits to Fig. 4 have been obtained for neutron scattering data on Si.
Dispersive phonon images of Ge and Si
A program has been developed to calculate dispersive phonon images of cubic crystals in accordance with the following procedure: A random distribution of wave vectors in three-dimensional k-space up to |k| = 0.3 is generated. For each wave vector, the roots of the cubic equation in ρω2, Equation (6), are calculated. The ray vectors are then calculated from (3) and for each ray we find its point of intersection with the chosen imaging plane. The imaging plane is divided into 500 by 500 bins and the numbers of rays falling into each of the bins are collected in a matrix. This matrix is then plotted as a grey-scale image with high phonon intensity, i.e. high count, represented by bright areas whereas dark regions represent low phonon intensity. Using this program, we can simulate phonon images for a chosen range of frequencies, or wave vectors and also velocity-gated images.
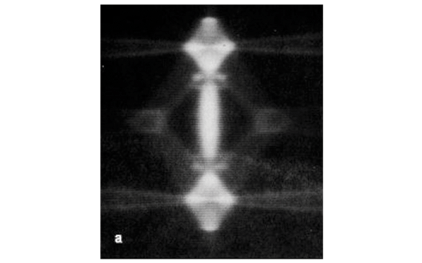
Figure 5(a) shows a phonon image of germanium in the (110) observation plane with the [110] direction at the centre of the image, that was measured with a bolometric detector by Dietsche et al.9 and shows little effect of dispersion. Figure 5(b) was calculated for the same geometry and by selecting phonons with frequencies ranging from 0.0 THz to 0.3 THz and using the parameters from Table 1 for Ge. The phonon focusing structures labelled ST and FT are due to slow transverse and fast transverse phonons, respectively. The variation in intensity in these phonon images is mainly due to phonon focusing, which is the clustering of phonon rays due to the non-spherical shape of the slowness surface. This focusing of phonon trajectories becomes infinite where the curvature of the slowness surface is zero, and this is the origin of the sharp line caustics in the images.
The longitudinal sheet of the slowness surface is separated from the ST and FT slowness sheets and is entirely convex, without any parabolic lines. The corresponding wave surface of the L mode does not have any folds and is also entirely convex, which means that it does not produce any caustics in the phonon image.10 For this reason the longitudinal mode is rarely included in phonon imaging observations or calculations and is disregarded in this paper.
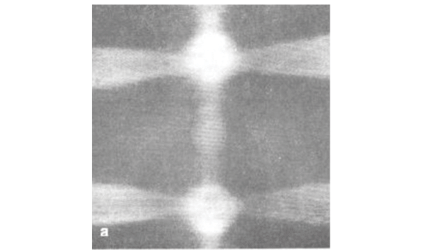
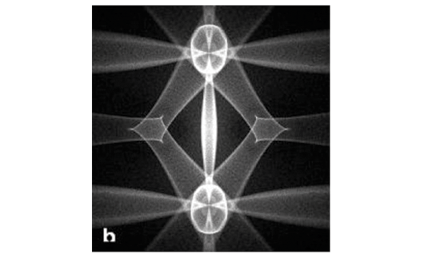
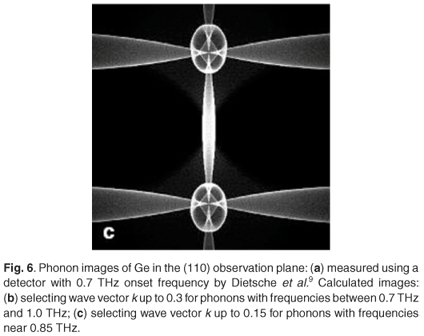
Figure 6(a) shows an experimental image of Ge for the same geometry obtained with a tunnel junction detector sensitive to frequencies above 0.7 THz. There are changes in the focusing pattern due to phonon dispersion. The diamond-shaped structures centred on the 〈100〉 directions near top and bottom centre have become rounded. The curved horizontal and vertical caustics due to fast transverse caustics have become more widely separated. The threefold symmetric ST structure around the 〈111〉 directions is absent from the measured image at this frequency. A calculated phonon image of Ge for the 0.7–1.0 THz frequency range in the (110) plane is shown in Fig. 6(b). The distance between the FT caustics in the calculated image has increased in conformity with the experimental image. Compared with the non-dispersive phonon image in Fig. 5(b), the outer diamond has become rounded and the inner structure has become much smaller at the higher frequencies. Another image was calculated for frequencies around 0.85 THz and selecting phonons with wave vector k up to 0.15 [Fig. 6(c)]. This wave vector selection results in the exclusion of phonons with smaller wavelengths, which are more susceptible to scattering, and this has the greatest effect on phonons near the slow 〈111〉 directions. This may explain the absence of the ST phonon focusing structures around the 〈111〉 directions in the measured image.
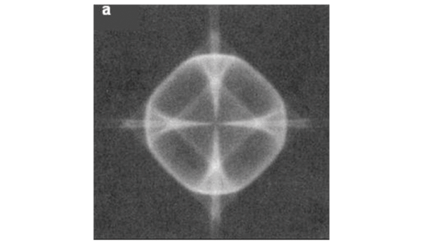
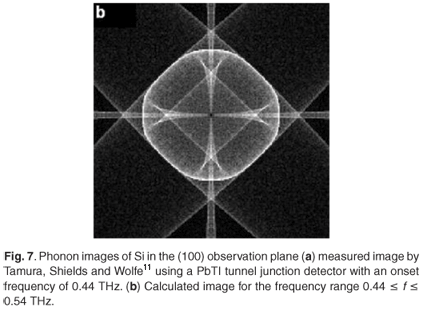
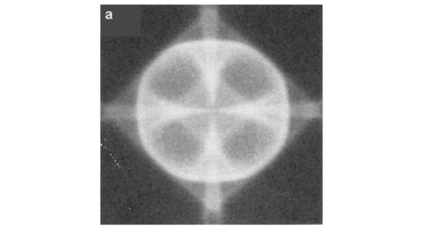
A comparison between a low-frequency experimental image obtained with a silicon crystal and a continuum model calculation is shown in Fig. 7. These images are for the (100) observation plane of the crystal with the [100] direction at the centre of the image. The measured phonon image in Fig. 7(a) was obtained with the use of a tunnel junction detector with an onset frequency of 0.44 THz.9 A frequency range of 0.44–0.54 THz was used in the calculation of the phonon image in Fig. 7(b). There is qualitatively good agreement between the experimental image and the calculated image. The inner box structure in the calculated image is just about the same size as the one in the experimental image. The blurring in the experimental image has been attributed to the scattering of phonons.11
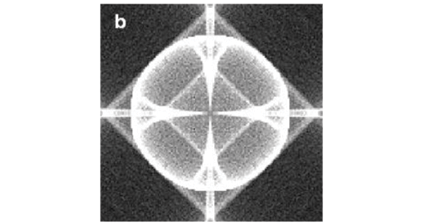
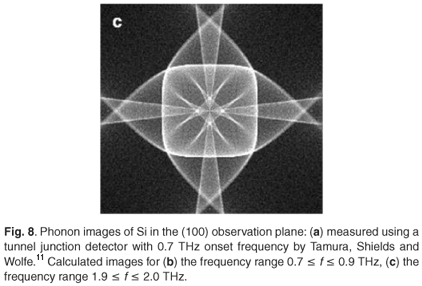
Figure 8 shows phonon images for Si for the same geometry as in Fig. 7, but for higher frequencies. Figure 8(a) is an image measured by Tamura et al.11 using a tunnel junction detector with an onset frequency of 0.7 THz. The effects of dispersion at these frequencies are less than for Ge, because the Si vibrational spectrum is scaled up by about a factor of 2 compared with that of Ge. Nevertheless, there are noticeable changes to the image above 0.7 THz. The outer box structure is slightly more rounded and the inner box slightly smaller. These effects are reproduced in Fig. 8(b), which is a calculated image for the frequency range 0.7 < f < 0.9 THz. Going to the much higher frequency range 1.9 < f < 2.0 THz, shown in Fig. 8(c), there are pronounced changes to the calculated image.
Conclusions
The changes in the phonon focusing patterns of Ge and Si predicted on the basis of modified continuum elasticity theory using data from neutron scattering dispersion relations agree well with experimental observation.
J. P. Wolfe is thanked for his interest in this work, and for permission to reproduce some of his measured phonon images. This work has been supported by the National Research Foundation.
1. Wolfe J.P. (1998). Imaging of Phonons. Cambridge University Press, Cambridge. [ Links ]
2. Every A.G. (1986). Formation of phonon-focusing caustics in crystals. Phys. Rev. B 34, 2852–2862. [ Links ]
3. DiVincenzo D.P. (1986). Dispersive corrections to continuum elastic theory in cubic crystals. Phys. Rev. B 34, 5450–5465. [ Links ]
4. Nilsson G. and Nelin G. (1971). Phonon dispersion relations in Ge at 80 K. Phys. Rev. B 3, 364–369. [ Links ]
5. Dolling G. (1963). Inelastic Scattering of Neutrons in Solids and Liquids. IAEA, Vienna. [ Links ]
6. Nilsson G. and Nelin G. (1972). Study of the homology between silicon and germanium by thermal neutron spectrometry. Phys. Rev. B 6, 3777–3786. [ Links ]
7. Kittel C. (1953). Introduction to Solid State Physics. John Wiley, New York. [ Links ]
8. Krumhansl J.A. (1968). Mechanics of Generalized Continua, ed. E. Kroner. Springer, Berlin. [ Links ]
9. Dietsche W., Northrop G.A. and Wolfe J.P. (1981). Phonon focusing of large-k acoustic phonons in germanium. Phys. Rev. B 47, 660–664. [ Links ]
10. Every A.G. (1981). Ballistic phonons and the shape of the ray surface in crystals. Phys. Rev. B 24, 3456–3467. [ Links ]
11. Tamura S., Shields J.A. and Wolfe J.P. (1991). Lattice dynamics and elastic phonon scattering in silicon. Phys. Rev. B 44, 3001–3011. [ Links ]
Received 26 May. Accepted 17 August 2008.
Author for correspondence. E-mail: kudakwashe.jakata@students.wits.ac.za


