Servicios Personalizados
Articulo
Indicadores
Links relacionados
-
 Citado por Google
 -
 Similares en Google
Compartir
South African Journal of Science
versión On-line ISSN 1996-7489
versión impresa ISSN 0038-2353
S. Afr. j. sci. vol.104 no.9-10 Pretoria sep./oct. 2008
SCIENCE POLICY
South African research in the context of Africa and globally
Mohammed JeenahI, *; Anastassios PourisII
INelson Mandela Metropolitan University, P.O. Box 77000, Port Elizabeth 6031, South Africa
IIInstitute for Technological Innovation, University of Pretoria, Pretoria 0002, South Africa
ABSTRACT
The quality and quantity of research publications are used as benchmarks to monitor the performance of South Africa's national system of innovation. The indicators are pertinent to the policies of the Department of Education, which distributes funds for research at institutions of higher education by measuring the volume of research outputs. In this article, we present a scientometric assessment of research in South Africa in the context of the rest of Africa and in comparison with Brazil and India—two countries with which South Africa aims to develop strong scientific ties. We find that South Africa has published a significant number of papers in all 22 disciplines represented in the ISI's Essential Science Indicators. The largest numbers of journal articles in a 10-year period (1996–2005) were published in the categories Clinical Medicine, and in Plant and Animal Sciences, with over 7000 papers each. Three groupings, namely, Chemistry, Geosciences, and Environmental/Ecology, form the second cluster of disciplines in terms of the highest number of publications (2966, 2488 and 2386, respectively). In all 22 subject categories, India and Brazil are rated higher than South Africa in terms of number of publications, but South Africa is ranked above these countries in relation to citations per paper in all disciplines. Egypt outranked South Africa in three disciplines in the period 1995–2004, namely, Chemistry, Engineering, and Materials Science, as did Nigeria in Agriculture in 1996–2005. In addition to the three disciplines in the earlier period, Egypt outranked South Africa in 1996–2005 in Physics, Agricultural Sciences, and Pharmacology/ Toxicology. However, South Africa scored higher than both African countries in all disciplines in terms of citations per paper.
Introduction
The South African government recognizes the value of the contribution of science and research to the improvement of the quality of life of its people and wealth creation.1 Since 2002, the government's focus shifted from organizing the system that underpins science and technology to substantially increasing the expenditure on research and development as a percentage of gross domestic product (GDP), from 0.6% to 1% by 2010. In line with this commitment, the government has, amongst other measures, introduced the National Research and Development (R&D) Strategy2 in 2002, the National Biotechnology Strategy3 in 2003, and the South African Research Chairs initiative in 2005. These policies all aim to increase the level of scientific and innovation activity.
In addition to the efforts of the Department of Science and Technology, the Department of Education has modified the way it funds higher education institutions in South Africa. While not completely ignoring input measures, outputs are factored into the funding formula in the case of research activity at all 23 higher education institutions.4
The number of publications emanating from a country and their impact through citations are familiar indicators to assess research output and quality for the purposes of country assessments5–7 and discipline evaluations.8,9 A publication is attributed to a particular country if at least one author includes it in his or her address. Moreover, the number of publications is a proxy for the level of scientific activity. Citation counts indicate the number of times a paper is referenced by other scholars in their publications, and are therefore a measure of the impact a particular study has had in its field and possibly of its quality. The evaluation of South African research capacity, both in absolute terms and in relation to other countries, is a benchmark through which the effect of changes within the national science and technology system can be measured. Governments regularly monitor their expenditure on R&D and volume of publications to assess their performance and issue monitoring documents.10,11
In this article, we present a scientometric assessment of research in South Africa in the context of Africa and in comparison with Brazil and India, two countries with which South Africa aims to develop scientific ties. It is therefore desirable to recognize the strengths of these countries to take advantage of their potential in developing joint R&D programmes.
Methods
We used the Thomson ISI databases for the purposes of country assessments and discipline evaluations. These sources provide statistics on publications in journals that they index. A journal has to meet a minimum set of criteria that reflect the quality of the periodical and its penetration within the scientific community.
A product offered by Thomson ISI and used for this analysis is the Essential Science Indicators (ESI),12 which provides rankings in terms of volume of publications and number of citations per article to rank institutions, countries and journals over 10-year periods. To compensate for varying publication and citation rates across scientific fields, different thresholds are applied to each discipline. The thresholds are set to reflect the same proportion of entities from each field. These percentages translate into a specific frequency cut-off for each field. For countries and journals, this percentage is 50%, whereas for institutions and authors it is 1%. The number of citations required for a country to be included in the database varies from as few as 22 in Multidisciplinary Sciences to as many as 1644 citations in Clinical Medicine (for the period ending 1 May 2005).
Information was obtained from the ISI databases on the number of papers, total citations and citations per paper in respect of different countries, as well as average citations per article for the different disciplines. The information so gathered for this study represents publications that appeared between November 1995 and November 2004, and from November 1996 to November 2005. These periods were selected to provide a baseline to track the impact of changes introduced by the South African government through the departments of Education and of Science and Technology in the first half of the present decade. Two periods were chosen to establish the baselines because both the numbers of publications and citations can fluctuate from year to year.
South Africa's research performance
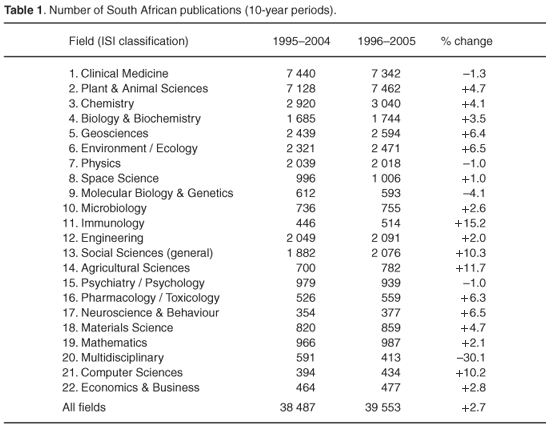
Table 1 shows the number of publications produced by South African researchers during the two 10-year periods ending November 2004 and November 2005. The country has a presence in all 22 disciplines in the ESI database, indicating that it reaches the minimum thresholds in all disciplines. In the 1996–2005 period, the disciplines with the largest number of papers, as defined by ESI, were Plant and Animal Sciences, and Clinical Medicine, with 7462 and 7342 publications, respectively.

The difference in numbers between the two top disciplines in Table 1 and the next cluster of subjects is striking. There are seven fields that can be grouped together, with publication numbers ranging from 3000 in Chemistry to 1700 in Biology and Biochemistry. A third group of disciplines can be grouped together with fewer than 1000 papers. The numbers of entries in the last group of six disciplines range from 377 to 593.
Even though research productivity is field specific, it is important to monitor the number of publications and activity within a field to assess the trends over time. In comparing the data over the two adjacent periods, the number of publications in Plant and Animal Sciences increased from 7128 (1995–2004) to 7462 (1996–2005), while those in Clinical Medicine decreased from 7440 (1995– 2004) to 7342 (1996–2005). It is the first time that more South African papers were published in Plant and Animal Sciences than in Clinical Medicine. The decline in the number of publications in the latter category is possibly related to the increase in clinical workload. Since 1994, the health system has been expanded and the number of patients visiting public tertiary teaching hospitals has increased greatly.13
The fall in publication numbers could also be related to changes in the provision of laboratory services in South Africa. The establishment of the National Health Laboratory Service (NHLS) has resulted in a greater emphasis on laboratory services than on academic research.
As in the case of Animal and Plant Sciences, the number of publications in the two survey periods has grown in 17 of the 22 disciplines. One of the areas with the highest increase was Social Sciences, by more than 10%, whereas publication numbers decreased in five disciplines— Clinical Medicine, Psychiatry/Psychology, Molecular Biology and Genetics, Physics, and Multidisciplinary. It is noteworthy that Molecular Biology and Genetics have contracted at a time when biotechnology has been declared a national priority, especially with the launch of the National Biotechnology Strategy in 2001. It is possible that the emphasis on the commercialization of research resulted in a decline in new knowledge production, as reflected in research papers in the public record. However, the increases in the other 17 disciplines should to be viewed against the background of a global expansion in publications in all fields. In the last two decades, South African research papers increased by 2.4% whereas international science, as reflected by the volume of publications in the ISI database, increased by 3.5%.6
The fall in the level of activity in three of the five disciplines was also noted by Molatudi and Pouris,14 who reported a 22% decrease in Clinical Medicine, a 6.8% drop in Molecular Biology and Genetics, and a 7.2% decline in Multidisciplinary between the periods 1990–1994 and 1996–2000.
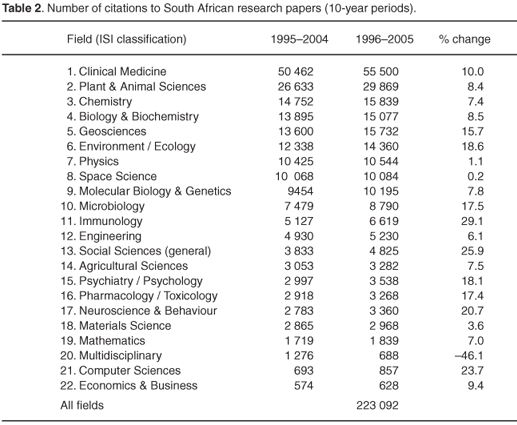
Table 2 shows the citations received by South African publications during the two periods under review. Citations are a measure of the usefulness of publications in the generation of new knowledge. There has been an improvement in the citation record in the two survey periods in 21 of the 22 disciplines. The increases range from a marginal improvement of 1.1% in Physics to a healthy 26% in Social Sciences. In 12 of the disciplines, the increase was equal to or less than 12%. In Multidisciplinary, however, citations declined by over 45%, reflecting also a decrease of 30% in the corresponding number of publications.

The general increase in citations can partly be attributed to South Africa's changed political status. Prior to 1994, an international academic boycott was in place to protest against the policies of the apartheid government so that collaboration between South African scientists and academics abroad was limited. The establishment of a democracy has resulted in closer links between South African researchers and their international counterparts.
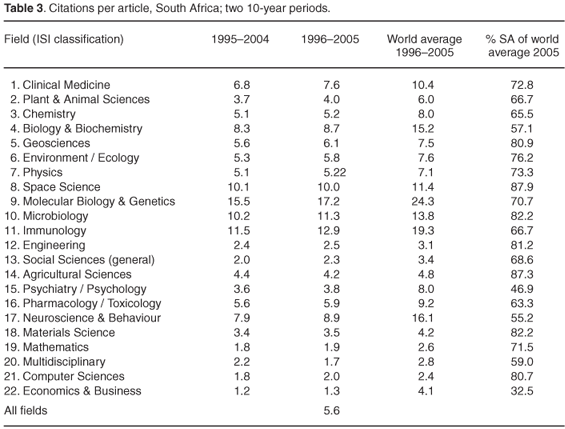
Table 3 shows the citations per article for the different scientific disciplines for the two 10-year periods.

For all but three disciplines (Multidisciplinary, Agricultural Sciences, and Space Science) citations improved. This trend was noted also by Molatudi and Pouris.14 In the periods 1990–94 and 1996–2000, citations in 12 of the disciplines increased, perhaps reflecting an improvement in the quality of research since 1994 or else the rise in the volume of publications and therefore more citations. Despite this improvement, however, South Africa performed unfavourably compared with global trends. The percentage of citations received by South African articles relative to the world average varied from 87% for Agricultural Sciences to 33% for Economics and Business. Even in fields in which the country has published extensively, citations per paper fall short of the corresponding average by more than 25%—for example, in Animal and Plant Sciences (by 33%), Clinical Medicine (27%), and Chemistry (34%). In Psychiatry/Psychology, and Economics and Business, the level is more than 50% below the discipline average. Space Science and Agricultural Sciences are the two fields where South African publications come closest to the global average. In both these cases, however, the citations per publication were 12% and 13%, respectively, below the global average for the discipline. We have argued earlier that the increase in citations could possibly be due to the 'freedom dividend' of 1994 and that in terms of global averages this dividend might not have been fully realized. The fewer citations may also be attributed to publications by South Africans concentrating on issues specific to this country, which might not be relevant to academics in other countries.
International comparisons
Table 1 provides absolute values of publication numbers and provides a measure of research activity. However, these numbers have to be interrogated against international trends as well as taking account of the discrepant volumes of publications across different disciplines. Researchers' productivity varies according to scientific field. Moreover, publication practices differ widely across disciplines in terms of co-authorship practices, the typical number of publications per year, and even the definition of what counts as a scientific article. In some disciplines, researchers are not expected to produce more than one article per year, while in others the typical annual output is in the range of 10 to 20 articles.
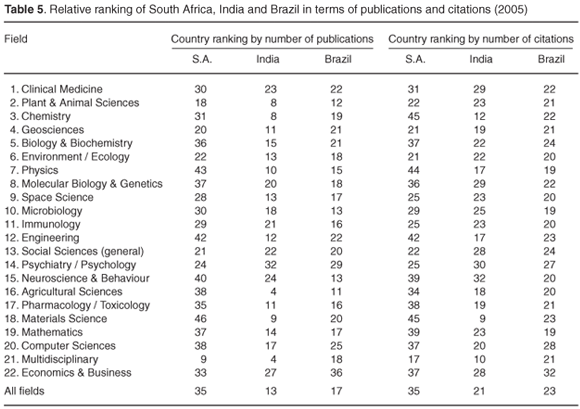
South Africa produces almost three times more papers in Clinical Medicine than in Geosciences yet is ranked 30th in the former and 20th in the latter category. Thus, although South African scientists produce more than 7000 publications annually, as a percentage of the global output this total is relatively less impressive than the 2594 publications in Geosciences in a decade. Furthermore, although the country produced about six times more papers in Chemistry than in Immunology, the two disciplines are ranked almost equally in global terms (31st for Chemistry and 29th for Immunology).
In terms of the number of publications, South Africa is rated in the top 20 countries in two disciplines, Plant and Animal Sciences at position 18 and Geosciences at number 20. In national terms, the two disciplines are ranked first and fourth, respectively. Plant and Animal Sciences therefore represents an area of excellence in South Africa. Not only do researchers in the field produce most of the national publications by category, the discipline is also highly ranked.
In seven other disciplines, South Africa is rated in the global top 30. However, in four of these, the rankings range from 28th to 30th, the ranking of the 13 other disciplines range from 31st for Chemistry to 46th for Materials Science. It should be a concern that Clinical Medicine and Chemistry, which are placed second and third in South Africa in terms of the number of publications, are ranked so low internationally.
These listings allow comparisons to be made with developments globally and within Africa.
South Africa compares unfavourably with two other countries from the group of developing nations that are considered innovative, India and Brazil. Brazil is ranked in the top 20 countries in 12 disciplines, with a high of 11th position in Agricultural Sciences. India is among the top 20 countries in 13 disciplines, with five of the disciplines in the top ten in the world.
The higher volume of publications generated by India and Brazil can be partially attributed to these countries having more researchers as well as spending more money on R&D than South Africa. However, the appropriate parameter to measure the value for money is complicated. To normalize the data it is necessary to use purchasing price parity (PPP), which allows aggregates of national accounts to be compared in terms of the purchasing powers of the currencies in their respective domestic markets free from differences in price levels among countries. Table 4 in supplementary material online reveals that in the three cases of publications per GDP,15 publications per PPP, and publication per spending on R&D, the South African performance is much more favourably reflected than absolute publication numbers. Although South Africa produces 21% of India's papers, and less than 36% of Brazil's, it generates more articles per dollar when comparing GDP in terms of purchasing price parity.
Although Brazil and India produce more papers than South Africa in all 22 ISI disciplines, their quality is not necessarily better. South Africa is ranked higher than both countries in terms of citations per paper across all 22 disciplines (Table 5 in supplementary material online).
Among African nations, Egypt outranks South Africa in six disciplines: Chemistry (29 vs 31), Engineering (29 vs 42), Materials Science (29 vs 46), Physics (40 vs 43), Agricultural Sciences (37 vs 38) and Pharmacology and Toxicology (26 vs 35). On the other hand, Nigeria outranks South Africa only in Agricultural Sciences (27 vs 38) (see Table 6 online).
South Africa is falling behind some African countries. In the period 1995–2004, Egypt outranked South Africa in only three areas: Chemistry, Engineering, and Materials Science. South Africa continues to outrank both Egypt and Nigeria in all disciplines in terms of citations per paper. However, compared with Kenya, a much smaller country with fewer resources, South Africa is outranked in 14 disciplines in terms of discipline-specific citations. Kenya's higher rankings can be partly attributed to the smaller number of papers and greater collaboration with industrialized countries. In all but one field South Africa produces substantially more publications than the east African country (at least three times more) and this higher value distorts the comparisons of citations per paper. The Kenyan articles that are highly cited are limited, and the senior authors are collaborators from Europe and America. The country is primarily a field site with only limited capacity being developed within its borders. It is in only one field (Pharmacology/Toxicology) that the number of publications is similar: 412 (Kenya) and 514 (South Africa) (Table 6).
Conclusion
This article presents the results of an effort to establish a baseline with which one can compare the impact of the changes that are arising within the South African research and development landscape. The study shows that the volume of research publications in most disciplines is increasing, with a few exceptions. This expansion, however, takes place against the backdrop of a general increase in global output.
It appears that South Africa's growing research productivity does not reflect global trends. As we have argued in the discussion, what is of importance in assessing a country's research performance is its position in relation to its competitors. A nation may raise its publication output and its world share, yet still lose ground in its scientific standing. Scientific competition is like running a marathon race. As long as the participant keeps running as fast as or faster than the other runners, he or she may stay in the leading group and competitors will have to keep trying to catch up. If, however, the researcher (or discipline) slackens off, the rest of the field will pass and he or she will join the stragglers.
South Africa is the dominant producer of research publications on the African continent, yet we have shown that the country is being outranked by Egypt and Nigeria in some disciplines. It is also clear that the South African research community has increased its international exposure and its work is more highly cited than elsewhere in Africa. The citations per publication have been steadily increasing in most disciplines, although the country's average for all disciplines is below the global average. In establishing the benchmarks and examining the impact of policy changes, it is important to consider both the absolute numbers of publications and citations and international comparisons.
1. Department of Science and Technology (1996). White paper on South African Science and Technology. Pretoria. [ Links ]
2. Department of Science and Technology (2002). National Research and Developmental Strategy. Pretoria. [ Links ]
3. Department of Science and Technology (2003). National Biotechnology Strategy. Pretoria. [ Links ]
4. Minister of Education (2004). Statement on Higher Education Funding: 2004/05 to 2006/7. Government Printer, Pretoria. [ Links ]
5. King D.A. (2004). The scientific impact of nations. Nature 430, 311–316. [ Links ]
6. Pouris A. (2003). South Africa's research publication record: the last ten years. S. Afr. J. Sci. 99, 425–428. [ Links ]
7. Rojo R. and Gomez I. (2005). Analysis of the Spanish scientific and technological output in the ICT sector. Scientometrics 66(1), 101–121. [ Links ]
8. Braun T., Schubert S. and Zsindely S. (1997). Nanoscience and nanotechnology in the balance, Scientometrics 38(2), 321-325. [ Links ]
9. Dastidar P.G. and Ramachandran S. (2005). Engineering research in ocean sector: an international profile. Scientometrics 65(2), 199–213. [ Links ]
10. National Science Board (2002). Science and Engineering Indicators. Government Printing Office, Washington, DC. [ Links ]
11. European Commission (1997). Second European Report on S&T Indicators. Office for Official Publications of the European Communities, Luxembourg. [ Links ]
12. www.scientificthomson/products/esi [ Links ]
13. Department of Health (2003). Annual report. Government Printer, Pretoria. [ Links ]
14. Molatudi M. and Pouris A. (2006). Assessing the knowledge base for biotechnology in South Africa: A bibliometric analysis of South African microbiology and molecular biology and genetics research. Scientometrics 68(1), 97–108. [ Links ]
15. www.worldbank.org/data/ICP [ Links ]
Received 6 May. Accepted 12 September 2008.
This article is accompanied by supplementary material online at www.sajs.co.za
* Author for correspondence. E-mail: mohammed.jeenah@nmmu.ac.za
Supplementary material to:
Jeenah M. and Pouris A. (2008). South African research in the context of Africa and globally. S. Afr. J. Sci. 104, 351–354.


