Services on Demand
Article
Indicators
Related links
-
 Cited by Google
 -
 Similars in Google
Share
South African Journal of Science
On-line version ISSN 1996-7489
Print version ISSN 0038-2353
S. Afr. j. sci. vol.104 n.9-10 Pretoria Sep./Oct. 2008
COMMENTARY
A target for South Africa's business expenditure on research and development based on industry structure
David Walwyn
Graduate School of Technology Management, University of Pretoria, Pretoria 0002, South Africa. E-mail: dwalwyn@arvir.co.za
The importance of migrating the South African economy from its present dependence on resource-based industries towards more knowledge-intensive economic activities has been repeatedly emphasized in many policy documents over the last decade. A higher business expenditure on research and development (BERD) is fundamental to this restructuring. Although the present level of expenditure, expressed as a percentage of total research and development (R&D) expenditure is higher than in most countries with similar levels of per capita gross domestic product (GDP), this comparison is misleading. BERD, as a percentage of industry value added, is low by international standards, especially when one considers that many of South Africa's leading industries, such as in the highly important sectors of food, metal products and petrochemicals, compete in a global market place and should be investing at levels equivalent to or even higher than their direct competitors. I analyse the structure of South African industry at sub-sector level in this paper and develop a target for manufacturing BERD, based on the industry structure and international benchmarks for such industries. As a result, I propose that manufacturing BERD should be at least R12.5 billion (an 85% increase on the 2004 values), equivalent to 0.9% of GDP (2004 rand values). I recommend that this target be incorporated into the strategic plans of the departments of Trade and Industry and of Science and Technology as an important goal for this sector and in the monitoring of their existing policy instruments, such as the recently introduced tax credit for R&D.
Introduction
The recent Organisation for Economic Cooperation and Development (OECD) review of South Africa's innovation policy is one of several documents to emphasize the 'importance of restructuring the South African economy away from its present heavy dependence on resource-based industries towards more knowledge intensive economic activities'.1 Similar sentiments are expressed in the National Industrial Policy Framework (NIPF), which identifies the main weakness in the economy as being 'the relatively poor performance of non-traditional tradable goods and services that are generally the most low-medium skill-intensive sectors'2 and then defines a number of strategic programmes aimed at overcoming this weakness.
Innovation in the broader sense, and especially research and development (R&D) in its narrower sense, has an important role in this restructuring, a role that has been stated clearly in the National R&D Strategy published in 2002.3 This document called for a doubling of government investment in science and technology over the period 2004–8,4 with more gradual increases thereafter, thereby raising the gross expenditure on R&D (GERD)/gross domestic product (GDP) to just above 1%. Although this value is not as large as many of the developed countries, the additional expenditure as outlined by the strategy sent a strong signal to South African researchers and others of the government's commitment to building a comprehensive and sustainable public R&D sector in support of a knowledge economy. This would raise the national investment to somewhat over 1%, not yet as large as many of our competitors, but enough to signal an appropriate, comprehensive and sustainable strategy for a knowledge economy, South Africa's current research community and the new generation that will be required to achieve our goals.
Subsequent to the publication of the National R&D Strategy, government expenditure on R&D (GovERD) has indeed increased substantially, rising from R2.268 billion in 2001/25 to R3.855 billion in 2004/56 and R5.404 billion in 2005/6.7 Similar targets have not been determined for the level of South Africa's business enterprise expenditure on research and development (BERD). Although this level has been rising, BERD as a percentage of value added (referred to as the R&D intensity) has been falling. Furthermore, this intensity within much of the sector is only a fraction of the equivalent sector in other high and middle income countries, and is certainly well below the levels required to support the Department of Science and Technology's (DST's) Ten Year Plan, presently under development.8
This discussion on the total BERD, and especially business R&D intensity, raises a number of important questions such as: what is the appropriate level of BERD for South Africa, and especially at this juncture in the economy's restructuring? A high level of expenditure may well be an imperative, but how much higher? What is the desired level of R&D intensity and hence expenditure in order to reach the targets of the Advanced Manufacturing Strategy, the National R&D Strategy, the Ten Year Plan, the National Industrial Policy Framework and other similar strategic documents?
This paper outlines an approach to determining the desired BERD for South Africa, based on its present industrial structure and a set of assumptions in respect of the country's transition to a knowledge economy. It is noted that R&D intensity is defined as the ratio of R&D expenditure to manufacturing value added, following the approach of the IDEA project9 (see following section), and not R&D expenditure to turnover or sales, which is the normal use of the term. In all other cases, the standard definitions for the various expenditures on R&D, such as BERD and GovERD, are applied; more information on the definition of these terms can be obtained from the source references.1,6
Methods
The method used for this analysis has been developed as part of the Indicators and Data for European Analysis (IDEA) project, which was funded by the European Union and looked broadly at Methodologies, Tools and Approaches Relevant for the Preparation, Monitoring and Evaluation of Science and Technology Policies.9–11 The project has identified, in particular, a number of deficiencies with the GERD/GPP indicator and has pointed out various ways in which the comparison of R&D expenditures across different countries could be improved.9 For instance, we note that the direct comparison of BERD across different countries is 'problematic' due to differences in industrial structure. A method for normalizing BERD data based on the structure of a country's manufacturing industries has been proposed.
The principal assumption of the approach is that R&D intensity is dependent on the industry sub-sector. A firm operating in the food sub-sector will, on average, allocate a different percentage of turnover or value added from one in the pharmaceuticals sector. Decisions on R&D expenditure at firm level are based on factors such as product life cycles, product margins, R&D gain, industry-level competition, cluster-level resources and research incentives.12 Many of these factors are consistent within a specific industry sub-sector and it is thus reasonable to define a characteristic or expected R&D intensity for a particular sub-sector based on data derived from manufacturing and R&D surveys.
Although the approach is simple in concept, its execution is complicated by the fact that the value-added and R&D data for a large cross section of countries is for the most part unavailable, or if it is available, is not directly comparable. Different countries use different industry classifications and many countries do not undertake regular manufacturing surveys. Fortunately, the OECD does collect and manage an excellent database covering R&D expenditure, although this covers only the OECD countries and some nations with observer status.13,14 The data for manufacturing value added were obtained from a variety of sources, including web sites for the national statistics agencies (such as www.ssb.no/english/).
A benchmark R&D intensity has been calculated for each sub-sector, based on actual ratios of R&D expenditure to manufacturing value added for a number of countries. This value has then been compared with the equivalent sub-sector in South Africa and an 'expenditure differential' calculated, where this differential represents the additional R&D expenditure which is recommended for that sub-sector. The recommended manufacturing BERD is calculated by adding each differential over the total sector.
The validity of this approach depends in turn on the soundness of its various assumptions. First, it assumes that the prevailing national industrial structure is largely rational and reflective of the resources and competitive strengths of the country. This is a valid perspective, given that it is generally easier to succeed in areas where there are existing competencies than in areas where one needs to build new competencies from an initially low level of expertise.
Second, it assumes that the R&D requirements for success or dominance of a sub-sector within a developing country are equivalent to a similar company operating in a developed country. Comparative studies of R&D intensity by country, with reliance on data from mostly the rich nations, are often questioned from this perspective. The large companies, however, which in turn form part of the main sub-sectors, must compete internationally, whether they are located in a developing or a developed country. In South Africa, companies such as SAB Miller, De Beers and Sasol are major international players and need to set their benchmarks against their competitors in the main economies, if they are to compete successfully.
Third, it assumes that the average sub-sector level R&D intensity is representative of the majority of the firms within the relevant sub-sector. For instance, if the distribution of R&D expenditure is highly skewed within any single sub-sector and across its full range of member companies, the average R&D intensity will not accurately reflect the average performance in that category. Unfortunately, this assumption cannot be validated without obtaining firm-level R&D expenditure through individual surveys. However, it is highly likely that the median and the average R&D intensities are somewhat different in certain sub-sectors due to the dominance by a single large company. The weakness of the assumption, namely, that the R&D expenditure distribution is normal, is also highlighted in the original publication.9
Finally, this approach assumes that the benchmark R&D intensity represents a sufficiently large comparative sample of countries, and hence can be used safely as a benchmark. It could be argued that the benchmark should not be the median or the average of the country sample, but the highest intensity within the sample. This is a valid position for two countries whose R&D intensities across a range of industry sub-sectors are largely similar. In this analysis, however, the South African level of R&D intensity is on average only 20% of the average within the comparator sample. Attaining only the average will be a large adjustment for South African manufacturing companies and it is considered unrealistic to use the best-in-class as a target benchmark.
Industry structure
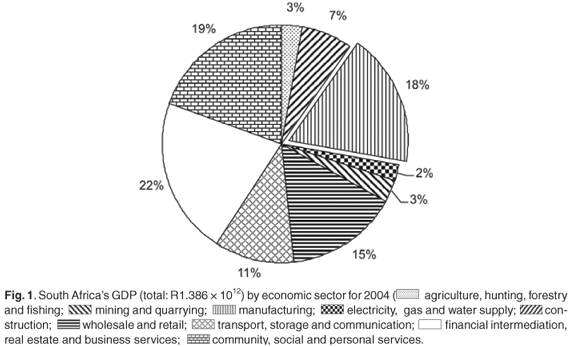
It is necessary to discuss the structure of the South African economy briefly, and in particular the manufacturing sector, before presenting the South African R&D intensity data. The latter is a dominant sector and has been so for over fifty years, accounting for about 18% of the GDP (2004 data15; see Fig. 1).
The manufacturing sector, the values for which are reported using the International Standard Industry Classification (ISIC) revision 3, is dominated by the major sub-sectors of food products and beverages (ISIC 15 and 16), refined petroleum, chemicals, coke and nuclear fuel (ISIC 23–25) and base metals, fabricated metals, machinery and equipment (ISIC 27 and 28) (2004 data16; see Fig. 2). Manufacturing BERD shows a rather different profile (2004/5 data6; see Fig. 2), indicating that R&D intensity does not correlate with sub-sector size.

The most research-intensive sector is that of radio, television and communication equipment (ISIC 32 and 33), although the level of R&D intensity is only one third of the international average for this sector (see Fig. A in supplementary material online for a comparison of all the sub-sectors against the U.S. data). The industry structure and its R&D intensity reflect the economic history of the country, and its predominantly resource-based and low-to-medium skills structure. Almost absent are the high R&D intensity industries of telecommunications, instruments, pharmaceuticals and transport equipment (especially aircraft). The dominant sectors generally have a low R&D intensity, leading to the overall conclusion that South Africa's BERD is well below the international benchmarks. This aspect of BERD is discussed in more detail in the next section.
An international comparison of manufacturing research intensity
Several countries have been analysed in order to develop a benchmark R&D intensity for each manufacturing sub-sector, as mentioned in the previous section on methods. Ideally, the countries in the sample should have included a range of middle and high income countries, and especially those nations with which South Africa is normally grouped for comparative purposes (such as Brazil, India, Poland, Greece and Spain). The sample is severely constrained by the availability of suitable data, however. Despite the seeming importance of manufacturing value added, there are very few published data on sub-sectors for many countries. As a result, the following states are selected (references for the sources of the data, in all cases for 2004, are given in brackets): U.S. (BERD14,17 and manufacturing value added18); Norway (BERD14 and manufacturing value added19); Germany (BERD14 and manufacturing value added20); Australia (BERD14 and manufacturing value added21).
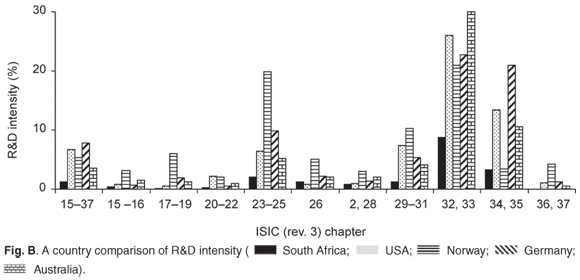
The derived R&D intensities confirm the observations of similar studies9,10 of this nature, these having noted the large variation in R&D intensity both across industry sub-sectors and between countries (see Fig. B in supplementary material online). Moreover, the distribution is not normal and it has been recommended previously that the median, rather than the mean, should be used in order to calculate the benchmark or comparator value.9 However, the mean of the four countries is used in this study, owing to the small sample size, with the exception of 'textiles, clothing and leather goods', where Norway has been excluded because of its outlier status.
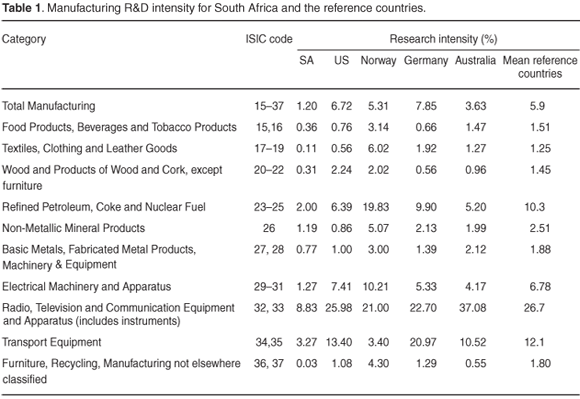
Table 1 (online) shows the R&D intensities across the manufacturing sector for South Africa, the average of the reference countries and for a previous study.9 As may be expected, the technology-intensive industries of radio, television and communication equipment, refined petroleum, and transport equipment have high R&D intensity, whereas the more mature and low-technology sectors such as textiles, food and wood products have much lower R&D intensities (in the order of 1.5%), especially when compared with total manufacturing (average R&D intensity of 5.9% in the reference countries). The most R&D intensive industries within each of the sub-sectors are air transport, pharmaceuticals and 'instruments' (as defined by ISIC), with calculated values of about 30%, 25% and 20%, respectively.9
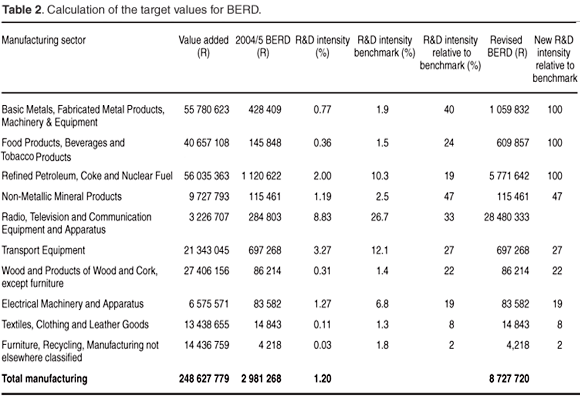
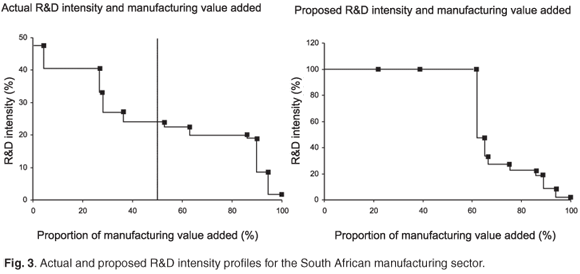
The South African manufacturing R&D intensity is on average about 20% of the benchmark value, which confirms the earlier observation that R&D expenditure in the business sector is considerably below the international norms, and especially when compared with those countries against which we compete in international markets. It is unrealistic and even non-strategic to expect that the total manufacturing sector should engage in R&D at the international norm; indeed, very few countries would follow such an approach, even while having the resources and infrastructure that would make it possible. I propose that a more selective approach is followed with this analysis, which is based on the principle that the R&D intensities of three dominant sub-sectors (accounting for 60% of the manufacturing sector) should be at 100% of the benchmark value. Plotting the sub-sector intensity data against the cumulative value added, as shown in Fig. 3 and Table 2 (online), has followed this approach.
The role of other actors
Clearly the business sector, which includes both the private sector and state-owned enterprises, has an essential role to play in the migration of the South African economy to a knowledge economy. This transformation is not dependent only on the business sector and the BERD, however. It requires the simultaneous and often leading contribution from other actors including government departments, the higher education sector and public research institutions. For instance, increased government expenditure on R&D (GovERD) can be an important stimulus for BERD, as has been shown in the analysis of other economic growth success stories such as the Finnish mobile phone industry.22
The OECD review1 on South Africa's innovation policy makes several (perhaps an overwhelming number of) recommendations for the various actors. Notwithstanding the need for initiatives to address issues such as 'increasing the degree of specialization and differentiation between functions within the vertical structure of government' within the context of a call for increased BERD, the following three priorities are considered as requiring the most urgent attention:
-
Re-examining the major national innovation priorities and missions.
-
Improving the funding of university research by government.
-
Strengthening the human resource base for science, technology and innovation through addressing the problems in the higher education sector.
A re-examination of the national innovation priorities and missions is already under way and has given rise to the formulation of the DST's Ten Year Plan for South Africa (2008–2018).8 This plan proposes four 'grand challenges' that in its view are 'opportunity spaces where South Africa can achieve a competitive position, if an aggressive programme of R&D is driven over the next ten years'. The grand challenges are an important addition to the present policy initiatives, and will contribute to the efforts of government in general to drive the economy towards more knowledge-intensive, high-growth and high-income production of goods and services.
The ten-year plan is a bold document in several respects; it sets a stretching target for the GERD/GDP ratio from its present levels of around 1% to a new level of 2% by 2018. Furthermore, it calls for a 80% increase in the export of high and medium technology products and services as a proportion of total exports, a 150% increase in U.S.-registered South African patents, and a 130% increase in the number of PhD graduates per year, reaching 2200 graduates by 2018. In the words of the OECD reviewers, it is 'government pointing with the whole hand'.23
The improved funding of university research is perhaps even more important than a clear articulation of the main national innovation priorities. The universities are absolutely central to an effective and efficient national system of innovation. These institutions are the dominant performers of basic research, the results of which have an unexpected and sometimes radical impact on existing markets and social structures, and also feed the subsequent activities of the research and innovation value chain. The overall system cannot function without fundamental or basic research, and the associated training of young scientists, engineers and technologists in research practice and methods.
The increasing reliance of many universities on contract income, the generally below-market remuneration rates of academics, and the precarious financial situation of many of these institutions are all strongly indicative of the under-funding within this sector. Although the DST, through its Research Chairs and Centres of Excellence programmes, has attempted to address the problem, the controversy of inadequate funding remains a Department of Education issue. It is essential that the department articulates a clear vision for the tertiary education sector, that it stabilizes the funding mechanisms, and motivates from Treasury for increased grant funding of university research, based on its well-proven social and economic returns.
As has been argued in this paper, it is important that the business sector responds to the need for increased BERD and expands its R&D programmes. However, this increased expenditure will not happen in the absence of the required human resources, which brings us to the third and final priority as identified by the OECD review. The higher education sector faces a number of problems in respect of its output of research qualifications, including the recruitment of a suitably gifted and motivated cadre of post-graduate students, adequate grants for doctoral students, the conversion of higher-degree registrations into actual qualifications and the adequate supervision of post-graduate students. All of these issues need to be addressed by bodies such as Higher Education South Africa, the Department of Education and the institutions themselves.
The existing initiatives by the DST to grow and strengthen R&D within all parts of the system will almost certainly act as an important stimulant to its other components. R&D is, after all, a bet on the future; it is a prospect but not the guarantee of a future return. The clear signal by government to share this risk and shoulder its portion should help to bring in the business sector. It is now time for such a response, if we are to reach the goals of advanced manufacturing and knowledge-intensive goods and services. The support of the business sector through increased R&D expenditure is essential and urgent.
Recommendations
It is apparent from this analysis of South Africa's BERD based on industry structure that the business sector is under-investing in R&D and it is recommended that BERD should be increased to R12.5 billion (an 85% increase on the 2004 values), thereby raising the important ratio of BERD/GDP to 0.9%. The present values of both parameters are R6.77 billion and 0.49%, respectively (2004/5 values6). In particular, the BERD within the important sub-sectors of basic metals, fabricated metal products, machinery & equipment; food products, beverages and tobacco products; and refined petroleum, coke and nuclear fuel, should be increased by R631 million, R464 million and R4.6 billion, respectively.
The need for a higher BERD has already been recognized by government and underlies motivation for the recent introduction of a tax credit system for R&D expenditure. Although it is too early to judge, the current response by South African companies to the tax scheme has been slow, and the pace of uptake certainly needs to be increased if the migration of the economy to a knowledge economy is to be realized. It will be important to study and learn from the experiences of other countries with tax credit systems In this regard. Three reviews of such systems, operating in Canada,24 Norway25 and Spain,26 have recently been published. The Norwegian study is especially relevant, showing that subsidies for applied research do indeed stimulate and improve the quality of private sector R&D, but subsidies or credits for experimental development (used here in the strict sense of the OECD's Frascati Manual) tend to substitute private R&D. Also of interest to the South African case is that the Canadian study concluded that a mixture of R&D grants and tax credits (as presently exists in South Africa) is more effective than grants alone. The Spanish study concluded that businesses receiving R&D tax credits achieved a value-added growth rate that was higher than businesses that did not receive the credits, although the growth rate difference was rather small (3–5%).
Close monitoring of the tax credit system will be important over the next few years. Despite strong overall expenditure on innovation activities,27 South African companies continue to show resistance to investing in R&D, and especially 'far from market' research, the benefits of which are hard to quantify, and take many years to realize. We show in this paper that there is an important need to stimulate BERD, which is presently somewhat below its benchmark levels. Based on the experiences of other countries, the tax credit system should help to raise the level of this important indicator, thereby facilitating the achievement of economic transformation targets which have been so clearly articulated in all of the recent industrial policy documents.
1. Organisation for Economic Co-operation and Development (2007). OECD Review of Innovation Policy, South Africa. Paris. [ Links ]
2. Department of Trade and Industry (2007). National Industrial Policy Framework. Pretoria. Available online at:www.thedti.gov.za/nipf/NIPF_ r2.pdf [ Links ]
3. Department of Arts, Culture, Science and Technology (2002). South Africa's National R&D Strategy. Pretoria. Available online at www.dst. gov.za/publications-policies/strategies-reports/ reports/sa_nat_rd_strat.pdf [ Links ]
4. There are some inconsistencies within the National R&D Strategy on the exact time frame for this doubling of investment. However, the DST Ten Year Plan (available online at www.dst.gov.za/ publications-policies/strategies-reports) confirms that the 2008 target for GERD/GDP was 1% and sets a new target of 2% by 20018.
5. Department of Science and Technology (2004). South African National Survey of Research and Experimental Development (2001/2 Fiscal Year). Human Sciences Research Council, Pretoria. [ Links ]
6. Centre for Science, Technology and Innovation Indicators (2006). National Survey of Research and Experimental Development (2004/5 Fiscal Year). Human Sciences Research Council, Pretoria. Available online from: www.hsrc.ac.za. [ Links ]
7. Centre for Science, Technology and Innovation Indicators (2007). High Level Key Results, National Survey of Research and Experimental Development (2005/06). Department of Science and Technology, Pretoria. Available online from: www.hsrc.ac.za [ Links ]
8. Department of Science and Technology (2007). Innovation towards a Knowledge Economy; the Ten Year Plan for South Africa (2008 to 2018). Pretoria. Available online from: www.nstf.org.za/content_main/ 10_year_innovation_plan14_august_2007.pdf [ Links ]
9. Smith K. (1998). Science, Technology and Innovation Indicators. IDEA Paper Series No. 5, STEP Group, Oslo. Available online from: www.step.no/old/ Projectarea/IDEA/Idea5.pdf [ Links ]
10. Sandven T and Smith K. (1998). Understanding R&D Intensity Indicators. IDEA Paper Series No. 14, STEP Group, Oslo. Available online from: www.step.no/old/Projectarea/IDEA/Idea14.pdf [ Links ]
11. Sirilli G. (1998). Conceptualising and Measuring Technological Innovation. IDEA Paper Series No. 1, STEP Group, Oslo. Available online from: www. step.no/old/Projectarea/IDEA/Idea1.pdf [ Links ]
12. Hartmann G.C., Myers M.B. and Rosenbloom R.S. (2006). Planning your firm's R&D investment. Research Technology Management 49(2), 25–36. [ Links ]
13. Organisation for Economic Co-operation and Development (2007). Main Science and Technology Indicators, vol. 2007-1. Paris. [ Links ]
14. Organisation for Economic Co-operation and Development (2006). Analytical Business Enterprise Research and Development Database (ANBERD). Paris. [ Links ]
15. Statistics South Africa (2007). Gross Domestic Product; First Quarter 2007. Statistical Release P0441, Pretoria. Available online from: www. statssa.gov.za. [ Links ]
16. The South African 2004 data for manufacturing value added are simply not available. For the purposes of this article, the data were obtained by assuming the same industry structure as reported in 2001 (Statistics South Africa's 'Large Sample Survey of the Manufacturing Industry', Report No. 30-02-01) and adjusting the value added for the increase in GDP as reported in Statistical Release P0441.
17. Wolfe R.M. (2007). Research and Development in Industry: 2003. National Science Foundation, Division of Science Resources Statistics, NSF 07-314, Arlington, VA. [ Links ]
18. US Census Bureau (2006). Annual Survey of Manufactures; Statistics for Industry Groups and Industries 2005. Economics and Statistics Administration, US Census Bureau, Washington, D.C. [ Links ]
19. Statistics Norway (2007). Annual National Accounts 1970 to 2006; Output by Kind of Main Activity at Basic Prices. Statistics Norway, Oslo. Available online at: www.ssb.no/english/subjects/09/01/ nr_en/tabe-06.html [ Links ]
20. Statistisches Bundesamt (2007). NACE Rev. 1, 1991–2003, Berlin. Database obtainable from www.destatis.de/themen/e/thm_accounts.htm [ Links ]
21. Australian Bureau of Statistics (2006). Manufacturing Industry Manufacturing Industry: Industry Performance by ANZSIC Class, 2001-02 to 2004-2005. Australian Bureau of Statistics Cat. No. 8221.0. Available online from: www.abs.gov.au/ [ Links ]
22. Walwyn D. (2007). Finland and the mobile phone industry: a case study of the return on investment from government-funded research and development. Technovation 27, 335–341. [ Links ]
23. This expression was used in reference to the Korean innovation policies during the plenary discussion of the OECD workshop on its report covering South Africa's innovation policy.
24. Berube C. and Mohnen P. (2007). Are Firms That Received R&D Subsidies More Innovative? Working Paper Series No. 2007-015, United Nations University–MERIT, Maastricht. [ Links ]
25. Clausen T.H. (2007). Do Subsidies have Positive Impacts upon R&D and Innovation Activities at the Firm Level? TIK Working Paper on Innovation Studies No. 20070615, Centre for Technology, Innovation and Culture, University of Oslo, Oslo. [ Links ]
26. Duchc N., Montoliod D. and Mediavillae M. (2007). Evaluating the Impact of Public Subsidies on a Firm's Performance: a Quasi-Experimental Approach. Document de Treball 2007/3, Institut d'Economia de Barcelona, Universitat de Barcelona, Barcelona. Available online from www.pcb.ub.es/ieb [ Links ]
27. Department of Science and Technology (2007). South African Innovation Survey 2005 Highlights. Pretoria. Available online from www.hsrc.ac.za/ CCUP-59.phtml [ Links ]
Received 11 October 2007. Accepted 20 April 2008.
This article is accompanied by supplementary tables and figures online at www.sajs.co.za
Walwyn D. (2008). A target for South Africa's business expenditure on research and development on industry structure. S. Afr. J. Sci. 104, 340–344.

