


Services on Demand
Article
 English (pdf)
 Article in xml format
 Article references
Indicators

Related links
-
 Cited by Google
 -
 Similars in Google
Share

 Permalink
South African Journal of Science
On-line version ISSN 1996-7489
Print version ISSN 0038-2353
S. Afr. j. sci. vol.104 n.9-10 Pretoria Sep./Oct. 2008
RESEARCH IN ACTION
The first oceanographic survey of the Conrad Rise
I.J. AnsorgeI, *; R. RomanI; J.V. DurgadooI; P.G. RyanII; L. DlaminiI, Z. GebhardtI; S. RainierI; M. SmithI; T. MtonstiIII; J.R.E. LutjeharmsI
IDepartment of Oceanography, University of Cape Town, Private Bag, Rondebosch 7701, South Africa
IIPercy FitzPatrick Institute, University of Cape Town
IIISAEON Egagasini Node, Private Bag X2, Roggebaai 8012, South Africa
ABSTRACT
This article presents data collected during the first hydrographic survey of the Conrad Rise, South-West Indian Ocean. Past investigations have shown that the Conrad Rise acts as an obstacle to the flow of the Antarctic Circumpolar Current (ACC). Numerical modelled data suggest that two eastward-flowing jets are formed on the northern and southern extremities of the rise as a result of the bifurcation of the ACC. Hydrographic data collected during the research cruise corroborate the model findings and provide a wealth of empirical data for further investigation of this dynamic ocean region. Counts of seabirds conducted during the cruise revealed unusually large numbers of penguins and diving petrels associated with the frontal jets, suggesting that the area is important for the large populations of penguins breeding at the Prince Edward and Crozet islands farther north.
Introduction
Hydrographic conditions in the Southern Ocean are modulated by the eastward-flowing Antarctic Circumpolar Current (ACC), which is embedded with numerous circumpolar fronts.1 Past investigations based on satellite altimetry2 have shown that mesoscale turbulence in the Southern Ocean is concentrated within these frontal bands. Regions of high mesoscale variability correlate closely where the fronts associated with the ACC interact with prominent bottom topography such as at the Crozet and Kerguelen Plateaux3 and the South-West Indian Ridge.4,5
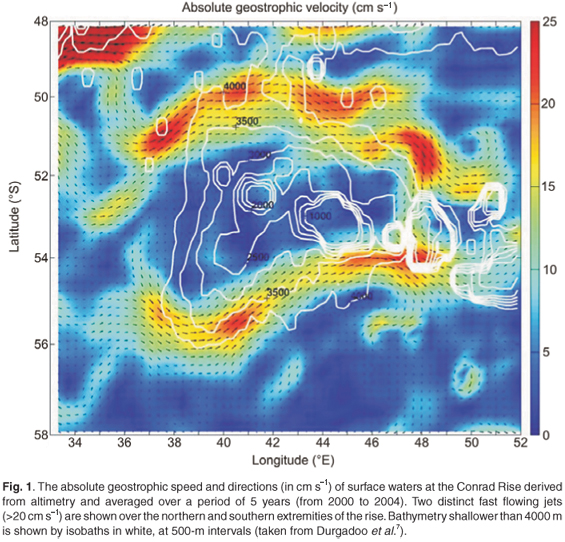
Recent investigations into the pathways of all surface drifters in the South-West Indian Ocean6 have identified an obstacle to the flow of the ACC. Known as the Conrad Rise, this is a relatively shallow feature (<3000 m depth) lying within the southern core of the ACC between 52–54°S and 39–47°E, and characterized by two seamounts, the Ob and Lena. Examination of altimetry data and the simulated velocities from a numerical model, suggest that the ACC bifurcates at the western side of this rise, forming jets to the north and south that converge again on its eastern side.7 The two intense jets that form along the meridional extremities of the rise enclose a relatively stagnant water body over the rise itself (Fig. 1). Until now, the Conrad Rise has received very little attention from the oceanographic community and the nature of the circulation associated with this region is unknown.
Realising the need to investigate this region hydrographically and to corroborate the findings of a desktop-based study,7 a high-resolution oceanographic survey was undertaken of the Conrad Rise and surrounding waters in April 2008. In this article we present the preliminary results obtained during this survey.
Data and methods
The mesoscale distribution of physical variables in the vicinity of the Conrad Rise were measured in the austral autumn, from 3–18 April 2008, during voyage 142 onboard the South African research and supply vessel the S.A. Agulhas. The survey encompassed three meridional transects across the Conrad Rise between 49–57°S and 38–48°E, with a fourth line crossing the interior of this region to assess the influence on the local physical environment of the two shallowest areas (<300 m), the Ob Bank and Lena Seamount (Fig. 2).

A total of 68 CTDs (conductivity, temperature and depth profiles) were undertaken, with 80% of the casts extending to 2000 m, while shallow casts ranging in depth between 240 and 690 m were taken over the Ob and Lena seamounts. At each CTD station, vertical profiles of salinity, temperature, dissolved oxygen and pressure were obtained with a Seabird SBE 9/11 sensor. Water samples were collected during the upcast on average at nine standard depths (2000, 1500, 1000, 750, 500, 200, 100, 50, and 20 m) and analysed onboard for dissolved oxygen. In addition, nutrient (silicate, phosphate, nitrate and nitrite) samples were collected at each depth and frozen for later analysis on land. A total of 92 XBTs (expendable bathythermographs) were deployed between CTD stations at 15' intervals and surface drifters were deployed at 13 locations on the north and south extremities and directly over the Conrad Rise and its associated seamounts.
Seabirds and marine mammals were counted during daylight while steaming between oceanographic stations. Counts were made for 80 hours, covering a total of 1612 km of transects. Counts were also made of birds attending the ship at 35 oceanographic stations.
Vertical water and velocity structure
Durgadoo et al.7 identified two jets at speeds ranging between 25 and 18 cm s–1 along the northern and southern boundaries of the Conrad Rise. Close examination of this data set suggests that these jets may be a result of a split in the ACC due to the current 'wrapping' itself around this shallow feature. However, without detailed hydrographic data, the true nature of these jets remains speculative. Past investigations8,9 indicated that the main jet along the northern edge of the Conrad Rise was associated with that of the Antarctic Polar Front (APF). Indeed, Pollard and Read10 observed a concentrated flow along the northern edge of the Conrad Rise and suggested that most of the ACC transport passes here as the APF.
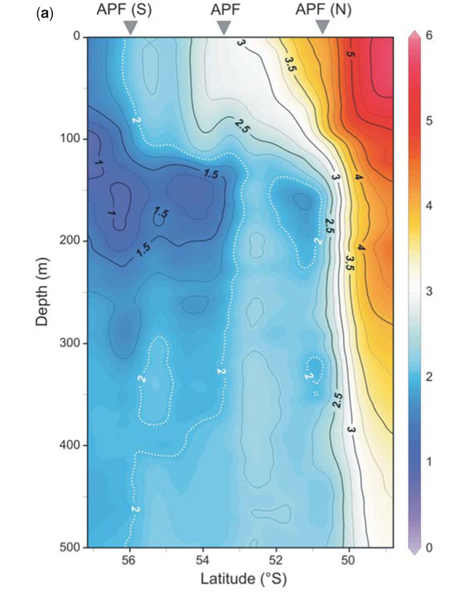
The APF is commonly identified by the northernmost extent of the 2°C subsurface (200 m) temperature minimum (Tmin), as dense Antarctic surface waters moving northwards subduct below sub-Antarctic water masses.11,12 Strong gradients in the sea-surface temperature (5.8–4°C) mark its surface expression.11,13 A number of surface observations have also identified a secondary APF at 56°S. Criteria defining this southern APF range between surface temperatures of 2.6–1.3°C with a core represented by the outcropping of the 2°C isotherm,14 or the northern limit of the 1°C isotherm in the subsurface Tmin.1 Deacon13 and Moore et al.9 postulated that the location and nature of the APF is strongly influenced by topography. Prominent topographic features can result in flow being forced to detour around mounts or depressions to conserve potential vorticity.15 Thus flow encountering a shallow plateau such as the Conrad Rise will be forced equatorwards, whereas flow encountering a deep depression such as the Enderby Abyssal Plain, lying directly south of the rise, will be forced polewards. Given the influence of topographical steering and the complex bathymetry of the survey area, is it possible that the two jets indicated in Fig. 1 correlate with a northern and southern branch of the APF? Indeed, Pollard and Read10 suggested that in this region single fronts may fragment into several flow filaments, and while a southern branch of the APF was not observed during their SWINDEX survey, it must be noted that this survey also did not cross the entire width of the Conrad Rise.
Comparisons between a 4-year mean of geostrophic velocity (Fig. 1) with the observed vertical structure for each transect across the Conrad Rise are certainly similar. The APF was observed along the northern boundary on all three transects with a second filament, defined for the purpose of this paper as the shoaling of the 2°C isotherm, that Sparrow et al.15 observed south of the rise. The first transect along 38°E (Fig. 3a) lies upstream of the Conrad Rise and here the two surface expressions of the APF were observed at 50°S and 56°15'S. Interestingly, the subsurface expression (Tmin at 200 m) was encountered at 52°50'S, suggesting that the APF had fragmented into several filaments upstream of the rise. Analysis of 7 years of satellite data9 shows a persistent split in the surface expression of the APF in this region, often with both surface and subsurface expressions separated latitudinally by up to 300 km.16 Moving eastwards over the rise and towards the shallow Lena Seamount (44°E), the APF filaments were observed closer together at 50°S (4.8–3.2°C) and again at 54°S (2.5–1.6°C), its subsurface expression mirroring the first branch (Fig. 3b). Figure 1 clearly shows the path of the two jets approaching each other along the breadth of the rise and this again is shown within the hydrographic data along 48°E, with both branches of the APF lying closer together at 51°S (4.5–3.5°C) and 54°15'S (3–1.9°C).

The hydrographic data collected during this survey support previous notions that the Conrad Rise influences the path of the ACC and results in the fragmentation of the APF into several branches. Once split, the APF moves around the rise as two filaments separated by 3–6° of latitude. Geostrophic velocities calculated from the CTD data support the occurrence of two distinct jets on either side of the Conrad Rise, mirroring the mean circulation observed in Fig. 1. In fact, examination of surface velocities from satellite altimetry data on 11 April 2008 shows the banding of eastward flow to the north and south of the rise with surface velocities exceeding 20 cm s–1. In contrast, velocities over the shallow rise are minimal (2–10 cm s–1), typical of the quiescent nature of the broad zonal bands, which separate ACC fronts. Comparison with both Fig. 1 and geostrophic velocities calculated along the eastern edge of the Conrad Rise along 48°E (Fig. 4) corroborates this finding.

There was evidence of enhanced biological activity associated with the jets north and south of the Conrad Rise. King penguins, Aptenodytes patagonicus, crested penguins, Eudyptes species, and diving petrels, Pelecanoides species, occurred at high densities around the periphery of the Conrad Rise. Penguins are notoriously hard to observe at sea, and there are very few records from the SW Indian Ocean sector of the Southern Ocean,17 yet they made up >80% of the biomass of seabirds counted during transects. Surprisingly few marine mammals were observed, with no pinnipeds seen, and only occasional whales apart from aggregations of fin whales, Balaenoptera physalus, between 56°35'S, 40°20'E and 56°14'S, 42°10'E on 7 April and at 48°48'S, 39°10'E on 18 April.
Discussion and conclusions
Although past investigations18 have shown that the Conrad Rise strongly affects the flow of bottom water, no other hydrographic investigations have, until now, been undertaken in the region. The tracks of both subsurface floats and surface drifters suggest that the Conrad Rise forms a substantial barrier to the eastward movement of Antarctic water masses at all depths.7 The intensified flow (>20 cm s–1) identified from hydrographic data collected during the April 2008 survey along both the northern and southern extremities of the rise are associated with a fragmented APF. Closer examination of hydrographic profiles correlate with the variability in the position of the APF brought on by its deflection around the Conrad Rise, with water masses typical of the Antarctic extending north of their mean position. It is conceivable that a split in the APF causes the unusual location of ambient water masses over an extensive part of the rise. This is likely to be of considerable importance to predators such as king penguins that breed in the sub-Antarctic but rely to a large extent on prey associated with Antarctic waters.19
Recent climate models suggest that movement of both sub-Antarctic and Antarctic water masses through variations in the strength or position of the ACC are sensitive indicators of ocean climate change.20 Traditionally, the northward transport of Antarctic water masses across the ACC has been attributed to Ekman transport as well as eddy shedding events, but enhanced cross-frontal advection through shifts in the ACC, driven by prominent bathymetric features, may further contribute to this northward transport.21 If the assumption is correct that a change in volume transports associated with the ACC is determined in part by bathymetric features, then the quantification of these fluxes may be crucial for understanding global biogeophysical budgets. Despite the importance of these processes, little is known of the regional and temporal variations in the position of the ACC. A key outcome of the Conrad Rise survey will be to examine the influence the shallow bathymetry has in fragmenting the ACC and the repercussions that changes in the Antarctic surface water masses, due to variations in the position and/or intensity of the APF, have on the neighbouring sub-Antarctic region. It may also have significant implications for top predators that are at risk of regional warming.22
This research was supported by the Department of Environmental Affairs and Tourism, Department of Science and Technology, National Research Foundation as well as by the University of Cape Town. We are grateful to the crew of the S.A. Agulhas, and in particular Captain F. Ligthelm for his enthusiastic help during Voyage 142. Our thanks also go to the senior technical electronics officer Patrick Hayes-Foley from MCM for his invaluable and methodical assistance throughout the entire voyage. This voyage was also a training cruise for two young scholars from the Leap School for Mathematics and Science, L. Mini and N. Mvinjelwa, and their participation is greatly appreciated. Drifters were kindly supplied by the Global Drifter Center of NOAA as part of their International Drifter Programme. Altimetry data were provided from the AVISO altimetry network.
1. Nowlin W.D. and Klinck J.M. (1986). The physics of the Antarctic Circumpolar Current. Rev. Geophys. 24, 469–491 [ Links ]
2. Gille S.T., Yale M.M. and Sandwell D.T. (2000). Global correlation of mesoscale ocean variability with seafloor roughness from satellite altimetry. Geophys. Res. Lett. 27, 1251–1254. [ Links ]
3. Lutjeharms J.R.E. and Baker D.J. (1980). A statistical analysis of the meso-scale dynamics of the Southern Ocean. Deep-Sea Res. 27, 145–159. [ Links ]
4. Ansorge I.J. and Lutjeharms J.R.E. (2005). Direct observations of eddy turbulence at a ridge in the Southern Ocean. Geophys. Res. Lett. 32, L14603, doi: 10.1029/2005GL0225 88. [ Links ]
5. Ansorge I.J., Lutjeharms J.R.E., Swart N.C. and Durgadoo J.V. (2006). Observational evidence for a cross frontal heat pump in the Southern Ocean. Geophys. Res. Lett. 33, L19601, doi: 1029/2006GL 026174. [ Links ]
6. Durgadoo J.V. (2008). Circulation at the South-West Indian Ridge in a high-resolution global ocean model. M.Sc. thesis, University of Cape Town, South Africa. [ Links ]
7. Durgadoo J.V., Lutjeharms J.R.E., Biastoch A. and Ansorge I.J. (in press). Conrad Rise as an obstruction to the Antarctic Circumpolar Current. Geophys. Res. Lett. [ Links ]
8. Orsi A.H., Whitworth T. III and Nowlin W.D. (1995). On the meridional extent and fronts of the Antarctic Circumpolar Current. Deep-Sea Res. 42, 641–673. [ Links ]
9. Moore J.K., Abbott M.R. and Richman J.G. (1999). Location and dynamics of the Antarctic Polar Front from satellite sea surface temperature data. J. Geophys. Res. 104, 3059–3073. [ Links ]
10. Pollard R.T. and Read J.F. (2001). Circulation pathways and transports of the Southern Ocean in the vicinity of the Southwest Indian Ridge. J. Geophys. Res. 106, 2881–2898. [ Links ]
11. Deacon G.E.R. (1933). A general account of the hydrology of the South Atlantic Ocean. Discovery Rep. 7, 171–238. [ Links ]
12. Belkin I.M. and Gordon A.L. (1996). Southern Ocean fronts from Greenwich meridian to Tasmania. J. Geophys. Res. 101, 3675–3696. [ Links ]
13. Deacon G.E.R. (1937). The hydrology of the Southern Ocean. Discovery Rep. 15, 1–24. [ Links ]
14. Holliday N.P. and Read J.F. (1998). Surface oceanic fronts between Africa and Antarctica. Deep Sea Res. I, 45, 217–238. [ Links ]
15. Sparrow M., Heywood K., Brown J. and Stevens D. (1996). Current structure of the south Indian Ocean. J. Geophys. Res. 101, 6377–6391. [ Links ]
16. Lutjeharms J.R.E. and Valentine H.R. (1984). Southern Ocean thermal fronts south of Africa. Deep-Sea Res. 31, 1461–1476. [ Links ]
17. Enticott J.W. (1986). Distribution of penguins at sea in the southeastern Atlantic and southwestern Indian Oceans. Cormorant 13, 118–142. [ Links ]
18. Boswell S.M. and Smythe-Wright D. (2002). The tracer signature of Antarctic Bottom Water and its spread in the Southwest Indian Ocean: Part 1 – CFC-derived translation rate and topographic control around the Southwest Indian Ridge and the Conrad Rise. Deep-Sea Res. 49, 555–573. [ Links ]
19. Charrassin J-B. and Bost C-A. (2001). Utilisation of the oceanic habitat by King Penguins over the annual cycle. Mar. Ecol. Prog. Ser. 221, 285–297. [ Links ]
20. Banks H. and Wood R. (2002). Where to look for anthropogenic climate change in the ocean. J. Climat. doi: 10.1175/1520-0442, 879–891. [ Links ]
21. Sloyan B.M. and Rintoul S.R. (2001). The Southern Ocean limb of the deep overturning circulation. J. Phys. Oceanogr. 31, 143–173. [ Links ]
22. Le Bohec C., Durant J.M., Gauthier-Clerc M., Stenseth N.C., Park Y-H., Pradel R., Grémillet D., Gendner J-P. and Le Maho Y. (2008). King Penguin population threatened by Southern Ocean warming. Proc. Natl Acad. Sci. USA 107, 2493–2497 [ Links ]
* Author for correspondence. E-mail: isabelle.ansorge@uct.ac.za

