Servicios Personalizados
Articulo
 Inglés (pdf)
 Articulo en XML
 Referencias del artículo
Indicadores

Links relacionados
-
 Citado por Google
 -
 Similares en Google
Compartir

 Permalink
South African Journal of Science
versión On-line ISSN 1996-7489
versión impresa ISSN 0038-2353
S. Afr. j. sci. vol.104 no.7-8 Pretoria sep./ago. 2008
RESEARCH ARTICLES
Predicting action potential characteristics of human auditory nerve fibres through modification of the Hodgkin–Huxley equations
J.E. Smit; T. Hanekom‡; J.J. Hanekom
Department of Electrical, Electronic and Computer Engineering, University of Pretoria, Pretoria 0002, South Africa
ABSTRACT
In 1952, Hodgkin and Huxley published an empirical set of equations describing changes in the neural membrane potential of the squid giant axon during the application of depolarizing or hyperpolarizing stimuli. As these equations were derived for an unmyelinated nerve fibre, there are reservations about their applicability to describe action potential propagation adequately in myelinated mammalian nerve fibres. This study proposes possible modifications of the Hodgkin–Huxley equations to describe action potentials generated in the Ranvier node of a human sensory nerve fibre, as applied specifically to the prediction of temporal characteristics of the human auditory system. Simulations of the effects of these modifications were performed in Matlab. Results suggest that the temporal characteristics of the human auditory system may be predicted better by using the modified set of equations. This finding is of value in creating more realistic neural models of the electrically stimulated human auditory system. Refractory periods were similar to those of general sensory nerve fibres of the same calibre. Relative refractory periods decreased with progressive retrograde nerve fibre degeneration. Chronaxie times decreased and rheobase current values increased when retrograde nerve fibre degeneration was simulated. Rheobase currents were also greater for straight array compared with contour array stimulation. Mean latencies decreased with progressive retrograde nerve fibre degeneration and agreed well with neural response telemetry. They also decreased with an increase in stimulus intensity.
Introduction
Cochlear implants have been devised to help rehabilitate profoundly deaf persons by providing them with a measure of sound perception through electrical stimulation of auditory nerve fibres (ANFs). The cochlear implant injects electrical currents directly into the cochlea by means of an electrode array to stimulate the ANFs. The challenge facing researchers is how to convey meaningful speech information to the brain via electrical stimulation. In particular, a better understanding of the way the implanted auditory system decodes the temporal information carried in speech needs to be gained before improved implants can be developed. The primary means of modelling the implanted human ear is using mammalian research animals, especially cats and guinea-pigs (see, for example, Abbas and Miller1 and Javel et al.2). Since these animals' cochleae have larger dimensions than those of smaller rodents, multi-electrode arrays similar to those implanted in humans can be used. Computational models are employed in combination with animal studies to enhance understanding of the underlying physiology of electrical hearing.1 Several ANF models have been developed,3–8 which are frequently used in combination with volume–conduction models of the cochlea to predict neural excitation profiles.4,9,10 An advantage of the computer models is that it is possible to isolate and manipulate critical model parameters, as well as modelling the differences in cochlear anatomy and ANF physiology between species, which is not always feasible with animal studies.11 Most of these models are at least partially based on animal data. However, the differences in cochlear structures between animals and humans, differences in the number and percentage myelination of auditory nerve fibres, and innervation patterns of both inner and outer hair cells across species, may be physiologically significant and care must be taken when extrapolating the animal results to predict performance in human implantees.12,13 Computer models can only approximate a real neural system, owing to the complexity of the latter. The modeller therefore has to make certain simplifying assumptions when abstracting the real system and this places limitations on the model as to the realistic correctness and completeness of the physiology and anatomy represented.11 A more comprehensive computer model based on human cochlear dimensions and peripheral auditory nerve fibre characteristics is therefore needed.
Frijns et al.4,14,15 developed a model based on the Schwarz-Eikhof nerve fibre model for the rat,16 but adapted with guinea-pig morphometry. Recently, this Generalized Schwarz-Eikhof-Frijns (GSEF) model was adapted for human ANF simulations by employing human morphometric data only.5,17 The ionic current dynamics of this model, however, are still those of the rat. Even though there are similarities between the properties of ionic currents at the rat and human Ranvier node,18,19 differences such as those in the activation and deactivation characteristics of voltage-gated potassium ion (K+) channels can result in discrepancies in the predictive behaviour of nerve fibre conduction.20
A comparison of the applicability of models of squid,21 toad,22 rabbit23 and rat16 to predict excitability of human auditory nerve fibres favours the Hodgkin–Huxley (HH) model for squid, provided the nodal ion channel kinetics are accelerated tenfold.24,25 This modified HH model improves the prediction of human auditory nerve fibre responses, as well as a superior prediction of chronaxie time of 340 µs versus 15–45 µs of the Frijns model,26 by changing the cable morphometric properties to those of the human.6 Huxley27 also suggested that the HH model can be modified to represent firing behaviour at a Ranvier node by accelerating the activation and inactivation of membrane sodium ion permeability fourfold.
The study reported here proposes modifications to the Hodgkin–Huxley equations to describe action potentials generated at the Ranvier node of a human sensory nerve fibre, with the objective of enhancing the prediction of temporal characteristics of the human peripheral auditory system. The nerve fibre model consists of two parts—a cable model based on a combination of the models by Rattay et al.6 and Blight,28 together with the newly modified HH model which describes the propagating action potential dynamics at the Ranvier nodes.29 The architecture of the new model was derived in two phases. First, the HH model was modified using human physiological data from the literature; and second, the combined cable model was constructed using published human sensory nerve fibre morphometric data. The model was validated against experimental results from the literature. Lastly, the morphometric parameters of the nerve fibre model were changed to a Type I peripheral auditory nerve fibre (ANF) and coupled to a volume-conduction model of the cochlea.
Methods
The human Ranvier node model
The human nodal model was based on the original HH model21 for unmyelinated nerve fibre dynamics. The HH model's ionic membrane current (Iion) is described in terms of the Na+, K+ and leakage (L) ionic conductances,

The dynamics of the opening probabilities (m, h and n, respectively) of the ion channels are described by

with αx(V) and βx(V) the voltage-dependent opening and closing rates of the ion channels, which give an indication of the membrane's permeability to the specific ion species [refer to Equation (A8) in the appendix]. Although these equations describe the time dependence of the action potential, the temperature dependence of the equation parameters is ignored in the original HH model.
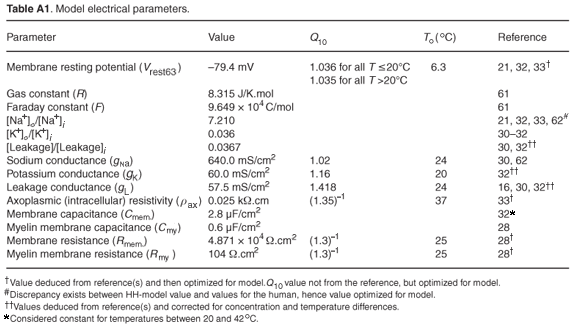
The above equations were modified by changing the parameter values describing the ionic and leakage conductances, corresponding equilibrium potentials, the membrane rest potential and capacitance, and axoplasmic resistance to reflect those of the human, as well as to include the temperature dependence of the parameters. Conductance and equilibrium potential values were deduced from experimental studies by Scholz et al.,30 Reid et al.31 and Schwarz et al.32 As these studies were performed at different temperatures and using different Na+ and K+ ion concentrations in intra- and extracellular replacement Ringer's solutions, all values had to be corrected for temperature and concentration differences. Temperature dependence of the resting membrane potential (Vres) was expressed through the use of a Q10 factor, with a value of 1.036 for all T < 20°C and 1.035 for all T > 20°C. Membrane permeability of the different ion species was increased or decreased by multiplying the rate equations αx(V) and βx(V) by selected factors. The temperature dependence of the permeability, as expressed through Q10 factors, also differed from the HH model. Electrical parameters were recalculated as values per unit area by assuming a fibre diameter of 15 µm and nodal area of 50 µm2.33 A nodal membrane capacitance (Cm) of 1.4 pF, i.e. 2.8 µF cm–2, was used.32 Palti and Adelman34 found a positive temperature coefficient of about 1.36% per °C, in the temperature range 3–21°C for Cm of squid, no significant change in Cm in the range 21–42°C, and a sharp increase of at least 23% per °C for temperatures above 42°C. No similar studies have apparently been conducted on mammals, and thus the assumption was made that Cm would be constant in the temperature range 20–37°C. The shape and amplitude of the action potential were not dependent on the axoplasmic resistivity (ρax) and a value of 0.25 Ω.m at 37°C was used.35 Schwarz et al.32 measured the ionic membrane currents and action potentials at the Ranvier node in partially demyelinated human peripheral nerve fibres. However, no morphometric nerve fibre data were given. By assuming a fibre diameter of 15 µm and a nodal area of 50 µm2, the rise and fall times and amplitudes at 20 and 25°C could be estimated from the action potential plots and used for model validation.33
The nerve fibre cable model
The human nerve fibre model was based on the cable model of Rattay,6 which assumed a propagating action potential driven by Hodgkin–Huxley dynamics,21 but was modified to a simple double cable structure. Two nerve fibre types were modelled: 1) a general sensory nerve fibre consisting only of an axon, and 2) a Type I auditory nerve fibre, which consisted of a dendrite, soma and axon. The dendrite and axon were divided into k cylindrical compartments, with the axon diameter about twice that of the dendritic diameter.
General sensory nerve fibre model. The change in the membrane potential (Vk) at the centre of the k-th compartment was described by the cable equation
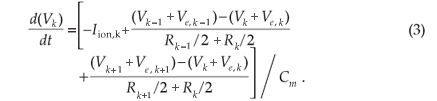
The membrane potential is given by Vk = Vi,k – Ve,k – Vres, with Vi,k the intracellular potential, Ve,k the extracellular potential and Vres the resting membrane potential. Cm,k gives the membrane capacitance and Rk the axoplasmic resistance to the neighbours at the k-th compartment. Externally applied stimulation is incorporated through the external potential field (Ve). For the general sensory nerve fibre, Ve was calculated by stimulation with a monopolar external electrode positioned sufficiently far away from the nerve fibre that the external potential field did not distort the propagating action potential.
The Ranvier nodes were considered unmyelinated active axolemmae using the new human Ranvier node model dynamics. Both Rk and Cm,k were temperature dependent. Rk is a function of ρax and the action potential's conduction velocity (vc) depends significantly on the latter.36 Schalow et al.37 classified human peripheral sensory nerve fibre groups by conduction velocity and fibre diameter and determined vc values of about 64.0 m/s for fibres having a diameter of 15.0 µm and about 10.0 m/s for 3.0–4.0-µm-diameter fibres at body temperature. A value of 0.25 Ω.m at 37°C for ρax and (1.35)–1 for its corresponding Q10 factor were selected to give a vc value of 56.5 m/s at 37°C for a 15.0-µm-diameter axonal fibre stimulated with a monopolar external electrode positioned 10.0 mm from the fibre.
The myelinated internodes were simple double cable structures as modelled by Blight,28 who considered the leaky myelin sheath and axolemma to be combined together in series, having a high resistance and low capacitance. Just as in the Rattay et al.6 model, the ionic membrane currents under the myelin sheath were ignored, leading to the assumption of constant internodal membrane conductance. The full set of equations and parameter values for the auditory nerve fibre cable model are listed in the appendix.
The auditory nerve fibre model. The Type I human ANF model was based on the cable model of Rattay et al.,6 but with the axon replaced with the generalized human sensory nerve fibre model. The dendrite and axon are divided into cylindrical compartments, whereas the soma is assumed to be spherical.6 The nerve fibre morphology is shown in Fig. 1. An additional modification to the ANF model was a shortening of the dendrite to fit the somal position of its counterpart in the volume-conduction cochlear model. Two types of Type I spiral ganglion cells exist with somal diameters varying between 24.6 µm and 29.9 µm.38,39 A value of 27.0 µm was thus assumed in the model.
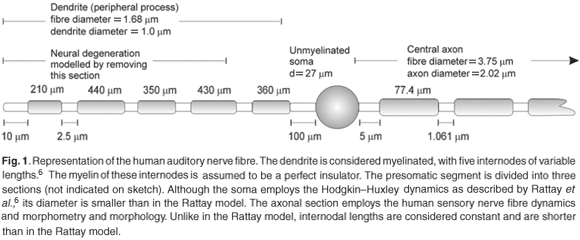
Ranvier nodes were unmyelinated active axolemmae with only the axon based on the general sensory nerve fibre model. SEM photographs and measured human auditory myelinated large Type I nerve fibres indicate an average fibre diameter of about 3.35 µm across the range from basal to upper middle cochlear turns, and an axonal diameter of 2.34 µm.38,40 This gives a fibre-to-axon diameter ratio of 0.7, in agreement with values ranging from 0.63–0.8, depending on the fibre thickness.41 The relationship between fibre diameter and internodal length that was used in the model, however, was only valid for fibre diameters greater than 3.4 µm.33 As the largest diameter in the basal turn described in the Rosbe et al.38 study was 4.3 µm and the smallest in the upper middle turn 3.2 µm, the average, being 3.75 µm, was assumed in the ANF model.
Modelling the degenerate nerve fibre. Retrograde neural degeneration, in which the dendrites are lost but the somas and axons survive, occurs in persons with profound sensory hearing loss.39,42 The degree of retrograde neural degeneration depends on the severity of tissue alterations in the Organ of Corti during the original insult and concerns only Type I ANFs.39
Since not all ANFs are affected by this phenomenon, both an unaffected (non-degenerate) ANF and an affected (degenerate) ANF were considered in this study. A degenerate version of the ANF model, similar to Frijns et al.43 and Briaire and Frijns,17 was used to simulate the effect of neural degeneration, that is, to simulate a nerve fibre with almost no peripheral (dendritic) process. This was effected by removing the first four nodal and internodal sections of the modelled ANF (refer to Fig. 1). The first node in the degenerate version of the ANF model thus corresponded to node n5 in Fig. 2. An axon-only version was also modelled to simulate retrograde degeneration observed in long-term profoundly deaf persons39 by removing all dendritic nodes and internodes up to and including the soma in the ANF model.
The volume-conduction cochlear model
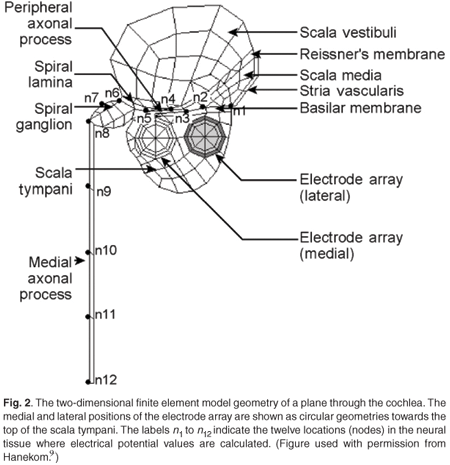
The ANF model was coupled to a 3D spiralling finite element volume-conduction model of the first one-and-a-half turns of the electrically stimulated human cochlea (Fig. 2). For more details of the volume-conduction model, refer to Hanekom.9 Each of the nerve fibres present in the model was described by the ANF model equations, where node n1 in Fig. 2 was the first node of the nerve fibre. The external potential (Ve) used to stimulate the ANFs was calculated from the output from the volume-conduction cochlear model.
The cochlear model is designed to allow two possible electrode array positions, one medial and one lateral, relative to the modiolus. The Nucleus 24 straight array, which, after implantation, is positioned close to the outer wall of the cochlea,44 is modelled with the lateral array, whereas the contour array, which lies close to the modiolus,44,45 is modelled with the medial array. The straight array was modelled with full-band electrodes and the contour array with half-band electrodes.44,46 The modelled cochlea was stimulated with a monopolar electrode configuration of the straight and contour arrays, respectively, with the electrode located in the basal cochlear turn.
Model output calculations
All calculations were performed in Matlab 7. Differential equations were numerically solved using the ode15s numerical solver. This means was selected because the modified equations proved to be too stiff to solve using the ode45 and ode23t solvers.
The action potential (AP) was characterized by its amplitude and rise and fall times. Frijns et al.14 approximated the action potential as a triangle, with the apex at the maximum amplitude and the rising and falling edges cutting the action potential curve at 10% of the maximum amplitude.
Stimulation pulses were square monophasic. The human Ranvier node model was developed to be stimulated internally and externally. During the development and optimization procedures, the modelled Ranvier node was stimulated internally. An anodic pulse was used to depolarize the membrane to create an AP having the same characteristics as the AP measured by Schwarz et al.32 To aid comparison of AP characteristics between the Ranvier node and nerve fibre models, the same pulse was used to optimize the nerve fibre models. Anodic pulse stimulation of all models was therefore performed.
The external environments of the human Ranvier node and nerve fibre cable models were considered infinite, isotropic and homogeneous with an external resistivity (ρe) of 0.3 kΩ.cm at 37°C.26 External stimulation was thus considered purely resistive and given by
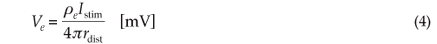
with rdist the distance between the node and the electrode. The external environment of the ANF model consisted of the cochlear model, with all cochlear tissues considered purely resistive.
Strength–duration behaviour was characterized by the rheobase current and chronaxie time. Thresholds were calculated using either the monopolar external electrode or the output from the volume-conduction model as external stimulation, depending on the nerve fibre under consideration. Stimulation pulses were square monophasic and ranged from 0.2–2.0 ms in duration. The strength–duration curve was fitted with the linear relationship

with Ith the threshold current (µA), t the pulse duration (µs), Irb the rheobase current (µA) and τch the chronaxie time (µs).33,47,48
The absolute (ARP) and relative (RRP) refractory periods characterized the way the nerve fibre will behave in a refractory manner. The nerve fibre was initially stimulated with a 0.1 ms monophasic pulse with amplitude 20% above Ith. Stimulation with a second 0.1 ms monophasic square pulse resulted in a second propagating action potential. The absolute refractory period was defined as the maximum interval between the two pulses in which no second pulse, with amplitude of up to 400% Ith, could be elicited. The relative refractory period was the minimum interval between the two pulses in which an impulse of at most 101% Ith was required to elicit the second pulse.33
Results
Simulations based on the human Ranvier node model, as well as the nerve fibre cable models, were performed in Matlab. External stimulation of the Node of Ranvier and the general sensory nerve fibre models was provided by a monopolar external electrode, whereas for the ANF model the external potential distribution inside the cochlea was calculated with a volume-conduction cochlear model stimulated with Nucleus 24 straight and contour electrode arrays, respectively.
The human Ranvier node model
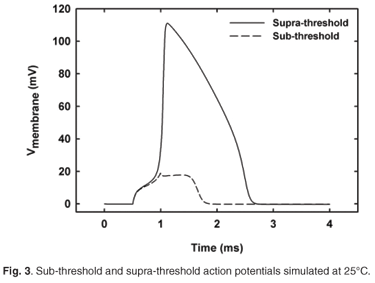
The modelled rise and fall times of the AP were calculated at 20 and 25°C and compared with experimentally estimated results (Table 1). An example of sub-threshold and supra-threshold action potentials simulated at 25°C is shown in Fig. 3. Rise times were 0.4% and 0.5% longer at 20 and 25°C, respectively, than the experimental values, whereas the fall times were 2.2% longer and 1.1% shorter, respectively. No experimental values were measured at 37°C, but values of 120 µs rise time and 470 µs fall time were previously predicted (Table 2). Comparison with these values indicated a 2.5% longer rise time and a 67% longer fall time for the human nodal model. The rise time decreased by 24% from 20 to 25°C, corresponding to a Q10 factor of (1.73)–1, while the fall time decreased by 23% [Q10 factor of (1.67)–1]. This decrease in the fall time is steeper than the estimated 20% decrease [Q10 factor of (1.56)–1] of the experimental results.
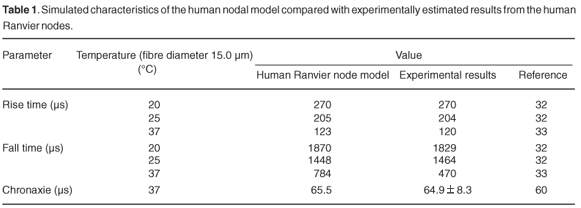
Simulated action potential amplitudes were just below 117 mV at 20 and 25°C and also just below 115 mV at 37°C, following the accepted trend of an amplitude decrease with rise in temperature.26,33
The nerve fibre cable model
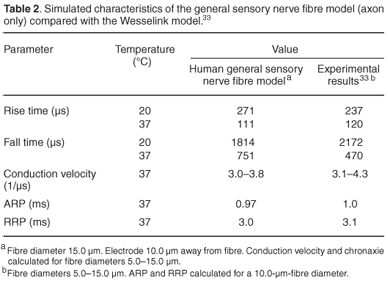
Rise and fall times of the general sensory nerve fibre cable model simulated at 37°C were 4.2% shorter and 60.0% longer than the previously published results predicted (Table 2). AP amplitudes were around 2 mV lower than those of the Ranvier node model at the respective temperatures.
The conduction velocity (vc) for the 15.0 µm nerve fibre was 12.4% lower (56.5 m/s) than the 64.5 m/s predicted by the Wesselink model and experimental results.37 Conduction velocities showed a fibre diameter dependency, decreasing with a reduction in fibre diameter (Fig. 4). Values compared well with those measured by Schalow et al.37 for fibre diameters thicker than 12.5 µm, but vc values were underestimated for thinner fibres. To aid comparison of vc values of fibres of different diameter, it is customary to list these values in terms of vc per fibre diameter,33 as listed in Table 2.
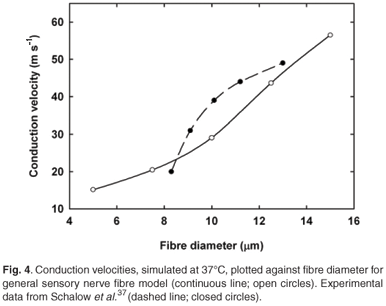
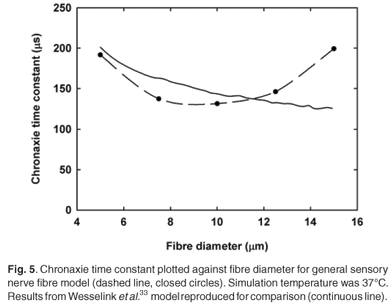
Chronaxie times (τch) were calculated for fibre diameters from 5.0 to 15.0 µm (Fig. 5). Stimulation was performed with a single external monopolar electrode positioned 10.0 mm from the fibre. Pulses were monophasic and ranged from 0.2–2.0 ms in duration. τch values were in the same range, but 3.5–26.2% shorter than the Wesselink model33 results. Unlike the latter,33 however, τch values did not decrease monotonically with increase in fibre diameter, but rose again for diameters larger than 10.0 µm (Fig. 4). Reasons for this are unclear and require further investigation.
Refractory periods were calculated for a 15.0-µm-diameter fibre and were similar to refractory periods previously calculated for a 10.0-µm fibre (Table 2).
A 3.75-µm-diameter degenerate ANF fibre located in the basal cochlear turn was stimulated with a monopolar electrode configuration from either the contour or straight electrode arrays. Stimulation pulses were square and monophasic. All simulations were performed at 37°C.
For an axon-only nerve fibre stimulated with the contour array, a rise time of 144 µs and a fall time of 749 µs at 37°C were calculated. The rise time was 17% shorter and the fall time was 14.7% longer than for a similar general sensory nerve fibre. Results for the straight array were similar to those for the contour array.
Chronaxie times were calculated for stimulation with the contour and straight arrays, respectively, by fitting the strength– duration curves with the linear Weiss relationship.
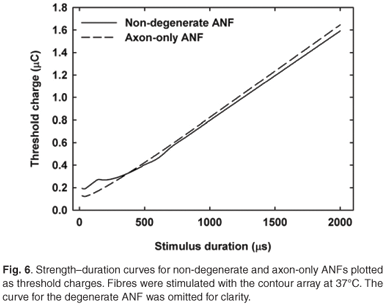
Strength–duration curves were also fitted with the exponential relationship of Lapicque,49 but the Weiss relationship provided a better match. Figure 6 shows the curves for non-degenerate and axon-only ANFs plotted as threshold charges for contour array stimulation. The curve for a degenerate ANF is similar to the non-degenerate curve and is omitted for clarity. In general, τch values decreased with a modelled increase in fibre degeneracy as shown in Table 3. Calculated τch values for contour and straight arrays predicted about 10% higher values in the former case compared with the latter for non-degenerate and degenerate fibres, whereas values for the axon-only fibres were similar. A τch value of about 86.1 µs was calculated for an axon-only fibre, irrespective of the electrode array used. As τch values increase with a decrease in fibre diameter, this time is shorter than the chronaxie time would be for the same fibre when stimulated with an external electrode. τch values also decrease when the electrode to fibre distance decreases.1,33 In contrast, stimulation with the contour array resulted in longer τch values than with the straight array (Table 3).
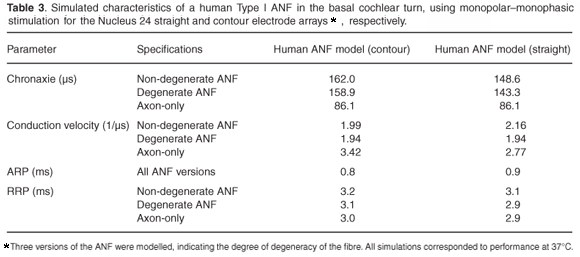
Simulations predicted a rheobase current of 0.77 mA for a non-degenerate, 0.79 mA for a degenerate, and 0.81 mA for an axon-only fibre when stimulated with the contour array. Rheobase current values for straight array stimulation were about two-and-a-half times higher than for contour array stimulation.
Simulated ARP values compared well and were similar to those of general sensory nerve fibres, being 800–900 µs irrespective of the electrode array used for stimulation (compare Tables 2 and 3).
Simulated RRP values differed, depending on the stimulation array used. Values for axon-only, degenerate and non-degenerate fibres are listed in Table 3. For a non-degenerate fibre the RRP value was 6% longer than for a degenerate fibre when stimulated with the straight array, and 5% longer when stimulated with the contour array, whereas they were about 3% longer for stimulation with the latter array.
Conduction velocities and latencies were determined for monopolar stimulation with a monophasic pulse of 0.5 ms. Calculated vc values for an axon-only fibre were 12.8 m/s (contour array) and 10.4 m/s (straight array) compared to 9.0 m/s for a similar general sensory nerve fibre externally stimulated. vc values per fibre diameter are listed in Table 3. For a degenerate fibre, vc values were about 43% slower than for stimulation of an axon-only fibre for contour array stimulation and about 30% slower for straight array stimulation. Non-degenerate fibre vc values were 3% faster than for degenerate fibres for contour array stimulation and about 11% faster for straight array stimulation.
ANF performance is not measured in terms of vc values and hence these results were translated into propagation times and latencies. AP propagation time is defined as the time taken by the AP to travel the length of the modelled ANF. These propagation times for full, degenerate and axon-only fibres, respectively, were 0.49 ms, 0.30 ms and 0.13 ms for contour array stimulation, and 0.45 ms, 0.30 ms and 0.163 ms for straight array stimulation. Latencies for degenerate ANF fibres were about 22% longer with contour versus straight array stimulation. Comparison between latencies of non-degenerate and degenerate ANF fibres predicted an approximate 52% reduction irrespective of electrode array used.
Discussion and conclusion
This study presents a new model to simulate the human Type I auditory nerve fibre. The Ranvier node membrane dynamics were based on the Hodgkin–Huxley model, modified with human physiological and morphometric data from experimental studies by Scholz et al.,30 Reid et al.31 and Schwarz et al.32 The new model was a simple double cable structure based on models by Rattay6 and Blight,28 together with additional morphometric data from the literature. Two versions of the cable model are presented, namely a general myelinated sensory and a Type I ANF model.
There are no experimental results regarding the fall and rise times, nor of the conduction velocity of the propagating AP in auditory nerve fibres. Instead, these fibres are classified in terms of temporal characteristics, including ARP and RRP properties, strength–duration behaviour and conduction latencies (see, for example, a review by Abbas and Miller1). All these characteristics depend, in part, on the type and strength of the stimulation pulse, the electrode configuration and electrode–fibre distance.1 In this study stimulation of the modelled cochlea was performed with two different Nucleus 24 electrode arrays in monopolar configuration, with the contour array positioned closer to the axonal part of the nerve fibres than the straight array. Stimulation pulses were square monophasic.
Stimulation in cochlear implants typically takes the form of pulse trains or continuous stimulation. The refractory properties of the neural membrane play an important role in the choice of stimulation used.1 First, it places a lower limit on the inter-phase/ inter-pulse interval, raising the threshold stimulus intensity needed to elicit further responses during the RRP, and second, it places an upper limit on the stimulus rate used.1 Mean ARP values between 0.33 ms50 and 0.7 ms51 and a mean recovery time constant of about 0.41 ms were estimated for cat auditory fibres50 and an RRP of up to 5 ms.1,51 Electrically evoked compound action potential (ECAP) studies on humans suggest an ARP value greater than 0.5 ms and an RRP value around 5 ms.52 These values are 41% shorter for the ARP and 72% longer for the RRP than the new model for a degenerate fibre predicts. Compared to ARP and RRP values for human sensory nerve fibres, however, the new model may predict refractory properties better than the cat models.
Although the somas and axons of the Type I ANF fibre degenerate at a slower rate than the dendrites, SEM studies of long-term profoundly deaf persons show a sharp decrease in the number of surviving fibres, compared with people who have been deaf for less time.39 Model predictions suggested that retrograde degeneration may not influence the ARP of ANFs, but this prediction has not been studied experimentally. The simulated RRP results for a non-degenerate fibre were longer than for degenerate and axon-only fibres, possibly suggesting that long-deaf persons may benefit from implants employing faster stimulation rates than for recently deaf people.
Latency measurements on cats with normal hearing and those in which the dendrites and somas were removed during a cochlear laminectomy, showed a double peak response in the normal-hearing cats, whereas in the laminectomated cats only the first response peak appeared.53 Van den Honert and Stypulkowsky53 proposed that the former reflected peripheral dendritic excitation and that the change in latency indicated a shift in excitation to a more centrally located site along the fibre. More recent ECAP studies on cats also suggested this proposition.50,54–56 Neural telemetry response (NRT) measurements in human subjects implanted with the Nucleus 24 arrays indicated the existence of similar response waveforms having either single positive or double positive peaks.57 The NRT waveform is characterized by a negative (N1) peak, followed by the positive peak(s) (P1 and P2). For a single positive peak waveform, the N1 peak occurred around 0.3–0.4 ms and the P1 peak around 0.6–0.7 ms. In the double positive peak responses, the N1 peak occurred at times too short to measure with the NRT system (<0.11 ms), whereas the P1 and P2 peaks occurred around 0.4–0.5 ms and 0.6–0.7 ms, respectively. Calculated latencies for the single-peak case are hence ~0.3 ms. For the double-peak case, it is ~0.4 ms and ~0.7 ms, whereas the resulting propagation times range between 0.2 and 0.3 ms. Lai and Dillier57 concluded that the double-peak response indicated the existence of almost intact ANF fibres, whereas the single-peak response might be due to retrograde degeneration. Latencies calculated for single fibres with the present human ANF model for degenerate fibres were in agreement with the suggestion that longer latencies indicate dendritic presence and stimulation of more intact ANFs, owing to the additional time it takes the AP to propagate along the fibre.
The strength–duration function gives the relationship between the threshold stimulus current necessary to excite a fibre and the stimulus duration. Strength–duration behaviour is characterized by the rheobase current and chronaxie time. Strength–duration curves measured for normal and damaged cat auditory nerve fibres show that for the damaged fibres, where only the axons are left intact, thresholds at short pulse durations appear lower than for the normal fibres (refer to Fig. 5 of van den Honert and Stypulkowsky53). However, the recording electrodes used for the damaged fibres were placed closer to the axons than in the case of recordings from normal fibres. If the recording sites were kept the same for both cases, thresholds measured for damaged fibres would be higher than for normal fibres. This is most probably because the damaged fibres are only excited in the axonal (central) part of the fibre, while for normal fibres excitation could occur either peripherally or centrally and the peripheral process is closer to the electrodes.53 Simulations with the present model predicted higher rheobase values for axon-only fibres compared to degenerate and non-degenerate fibres. Values were also higher for straight array stimulation compared to contour array stimulation. However, the rheobase value calculated for a non-degenerate ANF fibre stimulated with the contour array was lower than for straight array stimulation. Because both types of stimulation activated the fibre in the dendritic process, however, this was contrary to the expected trend of similar values for dendritic excitation, which can be attributed to the model itself. In the Methods section, mention was made of the fact that the relationship between fibre diameter and internodal length that was used in the axonal part of the modelled fibre was only valid for fibre diameters greater than 3.4 µm. The dendritic diameter is only 1.0 µm, hence the dendritic section of the fibre could not be replaced with the general sensory nerve fibre dynamics. Because of the difference in dynamics between the original Rattay6 model and the general sensory nerve fibre model, we expect that the present ANF model's excitation behaviour will differ from a model where the squid dynamics of the dendritic as well as the somal sections are also replaced with human dynamics.
Van den Honert and Stypulkowsky53 reported significantly shorter (118 µs versus 276 µs) chronaxie times for fibres from which the dendrites and somas were removed (leaving only the axons intact) compared to normal functioning fibres, indicating axonal excitation in the former. In both cases the fibres were electrically stimulated. Although the chronaxie time of 86.1 µs for an axon-only simulated fibre is much shorter than for a similar general sensory human fibre, chronaxie times decreased as the modelled fibre became progressively more degenerated.
According to Abbas and Miller,1 chronaxies depend on the electrode–axon distance. A closer separation may lead to a decrease of the strength–duration time constant and thus shorter chronaxies. The trend predicted by the present model was in contrast to the experimental observation that the chronaxie times for non-degenerate and degenerate fibres increased when the electrode–fibre distance was reduced, confirming the shortcoming in the model regarding dendritic modelling discussed previously.
In myelinated nerve fibres the total nodal sodium current (INa) is subdivided into two functionally distinct currents. The largest proportion (~98%) has fast activating and inactivating kinetics and is referred to as a transient (INat) current. The smaller portion (~2%) activates equally fast, but at membrane potentials 10–20 mV more negative than the transient, and inactivates slowly or not at all, thus forming a persistent (INap) current.58 Bostock and Rothwell59 developed a model similar to the one by Schwarz et al.32 having only INat. They estimated a chronaxie time of 176 µs at 37°C. The model was then changed to include a 2.5% INap activated at 10–20 mV more negative than INat. The chronaxie time then increased to 535 µs. The new ANF model is in part based on parameters from Schwarz et al.32 and hence simulates INat. Although the model results are in fair agreement with experimental results, addition of INap should give even more realistic predictions.
In conclusion, it seems possible to modify the Hodgkin– Huxley equations to describe action potentials generated in the Ranvier node of a human sensory nerve fibre and apply these modifications to create more realistic neural models of the electrically stimulated human auditory system. However, the squid-based dynamics of the dendritic and somal sections of the fibre model need to be replaced with human dynamics to account more fully for experimentally observed ANF excitation behaviour.
1. Abbas P.J. and Miller C.A. (2004). Biophysics and physiology. In Cochlear Implants: Auditory prostheses and electric hearing, eds F-G. Zeng, A.N. Popper and R.R. Fay, pp. 149–212. Springer-Verlag, New York. [ Links ]
2. Javel E., Tong Y.C., Shepherd R.K. and Clark G.M. (1987). Responses of cat auditory nerve fibers to biphasic electrical current pulses. Ann. Otol. Rhinol. Laryngol. 96, 26–30. [ Links ]
3. Bruce I.C. et al. (1999). A stochastic model of the electrically stimulated auditory nerve: single-pulse response. IEEE Trans. Biomed. Eng. 46, 617–629. [ Links ]
4. Frijns J.H.M., Briaire J.J. and Schoonhoven R. (2000). Integrated use of volume conduction and neural models to simulate the response to cochlear implants. Simpra 8, 75–97. [ Links ]
5. Briaire J.J. and Frijns J.H.M. (2005). Unraveling the electrically evoked compound action potential. Hear. Res. 205, 143–156. [ Links ]
6. Rattay F., Lutter P. and Felix H. (2001). A model of the electrically excited human cochlear neuron I. Contribution of neural substructures to the generation and propagation of spikes. Hear. Res. 153, 43–63. [ Links ]
7. Matsuoka A.J., Rubinstein J.T., Abbas P.J. and Miller C.A. (2001). The effects of interpulse interval on stochastic properties of electrical stimulation: models and measurements. IEEE Trans. Biomed. Eng. 48, 416–424. [ Links ]
8. Macherey O., Carlyon R.P., van Wieringen A. and Wouters J. (2007). A dual-process integrator-resonator model of the electrically stimulated human auditory nerve. J. Assoc. Res. Otolaryngol. 8, 84–104. [ Links ]
9. Hanekom T. (2001). Three-dimensional spiraling finite element model of the electrically stimulated cochlea. Ear Hear. 22, 300–315. [ Links ]
10. Rattay F., Leao R.N. and Felix H. (2001). A model of the electrically excited human cochlear neuron. II. Influence of the three-dimensional cochlear structure on neural excitability. Hear. Res. 153, 64–79. [ Links ]
11. Morse R.P. and Evans E.F. (2003). The sciatic nerve of the toad Xenopus laevis as a physiological model of the human cochlear nerve. Hear. Res. 182, 97–118. [ Links ]
12. Frijns J.H.M., Briaire J.J. and Grote J.J. (2001). The importance of human cochlear anatomy for the results of mod iolus-hugging multichannel cochlear implants. Otol. Neurotol. 22, 340–349. [ Links ]
13. Nadol Jr J.B. (1988). Comparative anatomy of the cochlea and auditory nerve in mammals. Hear. Res. 34, 253–266. [ Links ]
14. Frijns J.H.M. and ten Kate J.H. (1994). A model of myelinated nerve fibres for electrical prosthesis design. Med. Biol. Eng. Comput. 32, 391–398. [ Links ]
15. Frijns J.H.M., de Snoo S.L. and Schoonhoven R. (1995). Potential distributions and neural excitation patterns in a rotationally symmetric model of the electrically stimulated cochlea. Hear. Res. 87, 170–186. [ Links ]
16. Schwarz J.R. and Eikhof G. (1987). Na currents and action potentials in rat myelinated nerve fibres at 20 and 37°C. Pflügers Arch. 409, 569–577. [ Links ]
17. Briaire J.J. and Frijns J.H.M. (2006). The consequences of neural degeneration regarding optimal cochlear implant position in scala tympani: a model approach. Hear. Res. 214, 17–27. [ Links ]
18. Safronov B.V., Kampe K. and Vogel W. (1993). Single voltage-dependent potassium channels in rat peripheral nerve membrane. J. Physiol. (Lond.) 460, 675–691. [ Links ]
19. Röper J. and Schwarz J.R. (1989). Heterogeneous distribution of fast and slow potassium channels in myelinated rat nerve fibres. J. Physiol. (Lond.) 416, 93–110. [ Links ]
20. Reid G., Scholz A., Bostock H. and Vogel W. (1999). Human axons contain at least five types of voltage-dependent potassium channel. J. Physiol. (Lond.) 518, 681–696. [ Links ]
21. Hodgkin A.L. and Huxley A.F. (1952). A quantitative description of membrane current and its application to conduction and excitation in nerve. J. Physiol. (Lond.) 117, 500–544. [ Links ]
22. Frankenhaeuser B. and Huxley A.F. (1964). The action potential in the myelinated nerve fibre of Xenopus laevis as computed on the basis of voltage clamp data. J. Physiol. (Lond.) 171, 302–315. [ Links ]
23. Chiu S.Y., Ritchie J.M., Rogart R.B. and Stagg D. (1979). A quantitative description of membrane currents in rabbit myelinated nerve. J. Physiol. (Lond.) 292, 149–166. [ Links ]
24. Motz H. and Rattay F. (1986). A study of the application of the Hodgkin–Huxley and the Frankenhaeuser–Huxley model for electrostimulation of the acoustic nerve. Neuroscience 18, 699–712. [ Links ]
25. Rattay F. and Aberham M. (1993). Modeling axon membranes for functional electrical stimulation. IEEE Trans. Biomed. Eng. 40, 1201–1209. [ Links ]
26. Frijns J.H.M., Mooij J. and ten Kate J.H. (1994). A quantitative approach to modeling mammalian myelinated nerve fibers for electrical prosthesis design. IEEE Trans. Biomed. Eng. 41, 556–566. [ Links ]
27. Huxley A.F. (1959). Ion movements during nerve activity. Ann. N. Y. Acad. Sci. 81, 221–246. [ Links ]
28. Blight A.R. (1985). Computer simulation of action potentials and afterpotentials in mammalian myelinated axons: the case for a lower resistance myelin sheath. Neuroscience 15, 13–31. [ Links ]
29. Smit J.E. (2008). Modelled response of the electrically stimulated human auditory nerve fibre. Ph.D. thesis, University of Pretoria, South Africa. [ Links ]
30. Scholz A., Reid G., Vogel W. and Bostock H. (1993). Ion channels in human axons. J. Neurophysiol. 70, 1274–1279. [ Links ]
31. Reid G., Bostock H. and Schwarz J.R. (1993). Quantitative description of action potentials and membrane currents in human node of Ranvier. J. Physiol. (Lond.) 467, 247P. [ Links ]
32. Schwarz J.R., Reid G. and Bostock H. (1995). Action potentials and membrane currents in the human node of Ranvier. Pflügers Arch. – Eur. J. Physiol. 430, 283–292. [ Links ]
33. Wesselink W.A., Holsheimer J. and Boom H.B.K. (1999). A model of the electrical behaviour of myelinated sensory nerve fibres based on human data. Med. Biol. Eng. Comput. 37, 228–235. [ Links ]
34. Palti Y. and Adelman Jr. W.J. (1969). Measurement of axonal membrane conductances and capacity by means of a varying potential control voltage clamp. J. Membr. Biol. 1, 431–458. [ Links ]
35. Wesselink W.A., Holsheimer J., Sonmez Z. and Boom H.B.K. (1997). Simulation model of the electrical characteristics of human myelinated sensory nerve fibers. In Proceedings of the 19th Annual International Conference of the IEEE Engineering in Medicine and Biology, pp. 2029–2031. [ Links ]
36. Moore J.W., Joyner R.W., Brill M.H., Waxman S.D. and Najar-Joa M. (1978). Simulations of conduction in uniform myelinated fibers. Relative sensitivity to changes in nodal and internodal parameters. Biophys. J. 21, 147–160. [ Links ]
37. Schalow G., Zach G.A. and Warzok R. (1995). Classification of human peripheral nerve fibre groups by conduction velocity and nerve fibre diameter is preserved following spinal cord lesion. J. Auton. Nerv. Syst. 52, 125–150. [ Links ]
38. Rosbe K.W., Burgess B.J., Glynn R.J. and Nadol Jr J.B. (1996). Morphologic evidence for three cell types in the human spiral ganglion. Hear. Res. 93, 120–127. [ Links ]
39. Schuknecht H.F. (1993). Pathology of the Ear, 2nd edn. Lea and Febiger, Philadelphia. [ Links ]
40. Glueckert R., Pfaller K., Kinnefors A., Rask-Andersen H. and Schrott-Fischer A. (2005). The human spiral ganglion: new insights into ultrastructure, survival rate and implications for cochlear implants. Audiol. Neurotol. 10, 258–273. [ Links ]
41. Behse F. (1990). Morphometric studies on the human sural nerve. Acta Neurol. Scand. Suppl. 82, 1–38. [ Links ]
42. Nadol Jr J.B. (1990). Degeneration of cochlear neurons as seen in the spiral ganglion of man. Hear. Res. 49, 141–154. [ Links ]
43. Frijns J.H.M., de Snoo S.L. and ten Kate J.H. (1996). Spatial selectivity in a rotationally symmetric model of the electrically stimulated cochlea. Hear. Res. 95, 33–48. [ Links ]
44. Miller C.A. et al. (2004). Intracochlear and extracochlear ECAP's suggest antidromic action potentials. Hear. Res. 198, 75–86. [ Links ]
45. Cohen L.T., Richardson L.M., Saunders E. and Cowan R.S.C. (2003). Spatial spread of neural excitation in cochlear implant recipients: comparison of improved ECAP method and psychophysical forward masking. Hear. Res. 179, 72–87. [ Links ]
46. Abbas P.J., Hughes M.L., Brown C.J., Miller C.A. and South H. (2004). Channel interaction in cochlear implant users evaluated using the electrically evoked compound action potential. Audiol. Neurootol. 9, 203–213. [ Links ]
47. Weiss G. (1901). Sur la possibilité de rendre comparables entre eux les appareils servant a l'excitation électrique. Arch. Ital. Biol. 35, 413–446. [ Links ]
48. Bostock H. (1983). The strength-duration relationship for excitation of myelinated nerve: computed dependence on membrane parameters. J. Physiol. (Lond.) 341, 59–74. [ Links ]
49. Lapicque L. (1907). Recherches quantitatifs sur l'excitation electrique des nerfs traitee comme un polarisation. J. Physiol. (Lond.) 9, 622–635. [ Links ]
50. Miller C.A., Abbas P.J. and Robinson B.K. (2001). Response properties of the refractory auditory nerve fibre. J. Assoc. Res. Otolaryngol. 2, 216–232. [ Links ]
51. Cartee L.A., van den Honert C., Finley C.C. and Miller R.L. (2000). Evaluation of a model of the cochlear neural membrane. I. Physiological measurement of membrane characteristics in response to intrameatal electrical stimulation. Hear. Res. 146, 143–152. [ Links ]
52. Brown C.J., Abbas P.J. and Gantz B. (1990). Electrically evoked whole-nerve action potentials: data from human cochlear implant users. J. Acoust. Soc. Am. 88, 1385–1391. [ Links ]
53. van den Honert C. and Stypulkowski P.H. (1984). Physiological properties of the electrically stimulated auditory nerve. II. Single fiber recordings. Hear. Res. 14, 225–243. [ Links ]
54. Miller C.A., Abbas P.J. and Rubinstein J.T. (1999). An empirically based model of the electrically evoked compound action potential. Hear. Res. 135, 1–18. [ Links ]
55. Miller C.A. et al. (1998). Electrically evoked compound action potentials of guinea pig and cat: responses to monopolar, monophasic stimulation. Hear. Res. 119, 142–154. [ Links ]
56. Miller C.A., Abbas P.J., Robinson B.K., Rubinstein J.T. and Matsuoka A.J. (1999). Electrically evoked single-fiber action potentials from cat: responses to monopolar, monophasic stimulation. Hear. Res. 130, 197–218. [ Links ]
57. Lai W.K. and Dillier N. (2000). A simple two-component model of the electrically evoked compound action potential in the human cochlea. Audiol. Neurootol. 5, 333–345. [ Links ]
58. Burke D., Kiernan M.C. and Bostock H. (2001). Excitability of human axons. Clin. Neurophysiol. 112, 1575–1585. [ Links ]
59. Bostock H. and Rothwell J.C. (1997). Latent addition in motor and sensory fibres of human peripheral nerve. J. Physiol. (Lond.) 498, 277–294. [ Links ]
60. Bostock H., Sears T.A. and Sherratt R.M. (1983). The spatial distribution of excitability and membrane current in normal and demyelinated mammalian nerve fibres. J. Physiol. (Lond.) 341, 41–58. [ Links ]
61. Atkins P.W. (1995). Physical Chemistry, 5th edn. Oxford University Press, Oxford. [ Links ]
62. Hille B. (2001). Ionic Channels of Excitable Membrane, 3rd edn. Sinauer Associates, Sunderland, Massachusetts. [ Links ]
Received 3 March. Accepted 30 July 2008.
‡ Author for correspondence. E-mail: tania.hanekom@up.ac.za
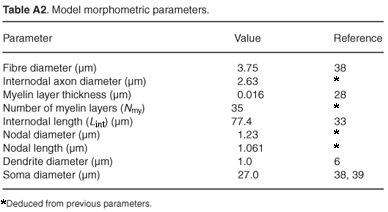
Full equations and parameter values for the human auditory nerve fibre model follow. The model was run at body temperature (37°C), although the temperature dependence of the parameters is also stated. The model was based on the cable model of Rattay.6 The dendrite and soma (except for the soma diameter) reproduce Rattay's model and only the axon was replaced by the new model, for which electrical parameter values are listed in Table A1 and morphometric parameter values in Table A2.
The change in the membrane potential (Vk) at the centre of the k-th compartment is described by the cable equation6
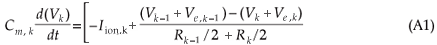
The membrane potential is given by Vk = Vi,k – Ve,k – Vres, having an initial value Vk(0) equal to 0. Vi,k is the intracellular potential, Ve,k the extracellular potential and Vres the resting membrane potential. The HH-model ionic membrane current (Iion,k) is described in terms of the Na+, K+ and leakage ionic conductances21.

Equilibrium potentials are given by
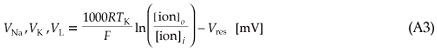
where R is the universal gas constant, F the Faraday constant, TK the temperature (in kelvin) and [ion]o/[ion]i the extracellular to intracellular ion concentration ratio for Na+, K+ and leakage ions, respectively.
Myelinated internodes are simple double-cable structures.28 The leaky myelin sheath and axolemma were considered combined together in series, having a high resistance and low capacitance. The total capacitance is given by
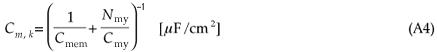
with cmem the same value as the nodal membrane capacitance and cmy the myelin membrane capacitance (Table A1). The internodal conductance is given by

where Nmy is the number of myelin layers, Rmy the temperature-dependent myelin membrane resistance and Rmem the temperature-dependent axolemmal membrane resistance (see Table A2 and Blight28). Iint is therefore given by

The dynamics of the opening probabilities (m,h and n, respectively) of the ion channels are described by

with initial values21 m(0) = 0.5, h(0) = 0.6, and n(0) = 0.32.
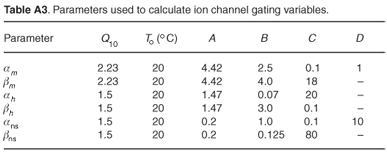
Ion channel gating variables are given by
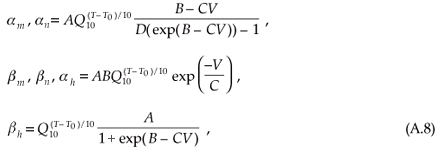
where constants B,C and D are the original HH-model parameters21 (Table A3). The factors given by A indicate the acceleration of the activation and inactivation of membrane permeability to the specific ion species, as suggested by Huxley.27