


Services on Demand
Article
 English (pdf)
 Article in xml format
 Article references
Indicators

Related links
-
 Cited by Google
 -
 Similars in Google
Share

 Permalink
South African Journal of Science
On-line version ISSN 1996-7489
Print version ISSN 0038-2353
S. Afr. j. sci. vol.104 n.5-6 Pretoria May./Jun. 2008
BIOLOGICAL MODELLING
Participatory assessment of the South African abalone resource and its impact on predicted population trajectories
Charles T.T. Edwards; Éva E. Plagányi
Department of Mathematics and Applied Mathematics, University of Cape Town, Private Bag X3, Rondebosch 7701, South Africa
ABSTRACT
Illegal harvesting is a cause for concern in many of the world's fisheries. Over the last decade, the abalone resource in South Africa has come under severe fishing pressure, largely because of increased and unmitigated levels of poaching. The unquantified illegal exploitation of this resource is a major impediment to management, because understanding of abalone population dynamics is affected. Incorrect assessments of population abundance could lead to inadequate attempts by management to stem the decline. Here, population trends along the west coast of South Africa are investigated. A simple discrete-time logistic model was used to estimate parameters within a maximum likelihood statistical framework by fitting to available catch rate data. To address the problem of unknown levels of illegal catch, interview data were collected on non-commercial catch trends and the model was structured to allow this catch to be estimated during the fitting process. The results show that such a participatory approach to stock assessment can lead to an improved understanding of resource dynamics, illustrating the benefit this approach may have for management.
Introduction
Several abalone stocks worldwide have shown or continue to show severe declines as a result of either environmental factors or overfishing.1,2 The demand for abalone is partly attributable to its reputed aphrodisiac qualities (China) and traditional useage as a high-status product for important ceremonial events (Japan).3 The resultant high commercial value has rendered abalone a prime target for illegal fishing. This is a major concern similarly facing other high-value resources in the world's oceans including, for example, the long-lived and slow growing Patagonian toothfish (Dissostichus eleginoides).4 Indeed, the international fisheries management community has recently accorded high priority to curbing illegal, unreported and unregulated (IUU) fishing activities that are contributing to the decline of fish stocks.5,6 To quantify the full impact of a fishery on both the target stock itself and the ecosystem, it is essential to have an estimate of total extractions, despite the considerable technical difficulties associated with determining IUU catches.7
The South African abalone, Haliotis midae, is harvested in the Western Cape from Cape Agulhas to St Helena Bay, sustaining one of the oldest commercial abalone fisheries in the world. Abalone populations are managed separately within seven distinct zones (referred to as Zones A–G). Historically, the south coast (Zones A–D) typically yielded 80–90% of the annual total allowable catch (TAC),8 although this proportion has fallen in recent years. The fishery peaked in 1965 with catches of 2.7 thousand tonnes and continued to produce consistent yields until the early 1990s. However, the resource has since come under severe fishing pressure. Due to consequential population declines, the fishery has now reached the point of commercial collapse in some areas. The recreational fishery was closed indefinitely in 2003 and the TAC dropped to 125 tonnes for the 2006/07 season, with three zones (A, C and D) closed to commercial fishing.
Although ecosystem changes have contributed to the decline of abalone populations in zones C and D,9,10 the current situation is primarily the result of rampant levels of poaching. H. midae is restricted to shallow beds of kelp (Ecklonia maxima) that are easily accessible from the shore. When combined with its high commercial value, this makes abalone particularly vulnerable to illegal exploitation by both traditional fishers unable to obtain formal access to the fishery, and criminal elements.11,12
Management measures are informed by quantitative modelling of the abalone resource. In zones A–D, population dynamics are evaluated and predictions made using an age-structured production model13 that uses catch per unit effort (CPUE) as an index of population abundance, alongside fishery-independent survey data and a range of other data sources. Here we focus on zones E and G, which cover the stretch of coast from Cape Point to St Helena Bay. Because of their lower commercial yield and the absence of length–frequency information in this region, the data available for these zones are insufficient to apply an age-structured model, so that a simple logistic model of population growth is currently used in the annual stock assessment.14 Annual catches are an important component of these models and the accuracy of model predictions is impeded by a lack of reliable information concerning the levels of illegal catch. Indeed, model fits to the available catch rate data for zones E and G, undertaken during a recent stock assessment, were extremely poor.14
In this investigation we supplemented the data available for modelling of resource dynamics by conducting stakeholder interviews. This participatory process provided additional information that was incorporated into the model. Focusing on zones E and G we illustrate how a participatory approach can affect model predictions of biomass dynamics, with implications for attempts to achieve the management goal of sustainable resource use.
Methods
The current stock assessments of abalone in zones E and G (referred to here as the Reference model) are based on a logistic model of population dynamics.14 In this investigation the Reference model is compared to a new model (referred to as the Participatory model), which incorporates information obtained from stakeholder interviews, to assess the benefits of this approach to the understanding of resource dynamics.
Data
Reference model
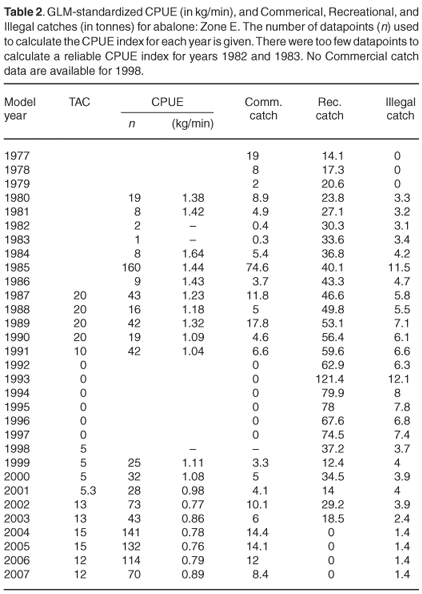
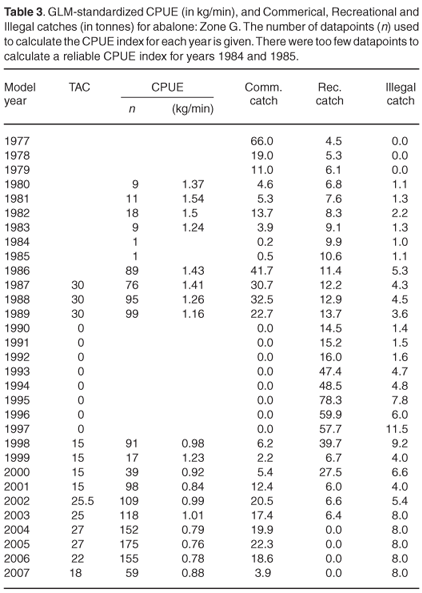
Information on catch and effort from zones E and G was obtained from Marine and Coastal Management (MCM), a branch of the Department of Environmental Affairs and Tourism that is responsible for management of South Africa's marine resources. Commerical catch is recorded at landing sites along the coast and Recreational catch estimated by an annual telephonic survey of recreational divers. Following discussions within the Abalone Scientific Working Group convened by MCM, the illegal catch is broadly assumed to be 10% of the Commercial plus Recreational catches since 1980, increasing to 20% for Zone G since 1997.15 Minor modifications were made for recent years following consultation by MCM with representatives from the abalone fishing industry (A. Mackenzie, pers. comm.). The CPUE is calculated using the Commercial catch only, as this is by far the most reliable record, and has been standardized using general linear modelling (GLM) techniques16 to ensure that it more closely represents trends in population abundance. The data available for each zone are listed in Tables 2 and 3. The TACs for each year, first introduced in 1987, are also shown.
Participatory model
The Participatory model also uses the Commercial catch and CPUE data described in Tables 2 and 3. These data have been supplemented by stakeholder interviews, which were conducted to obtain information on the levels of poaching taking place and trends in magnitude over time. The South African Abalone Industry Association, Table Mountain National Park and MCM Compliance personnel participated in this exercise.
Stakeholders were unsure of the magnitude of poaching, but were confident of the changes in poaching intensity, particularly in Zone E. In this zone, poaching was considered by interviewees to have increased gradually since the first landings were recorded. It then rapidly escalated to high levels in the mid-1990s, when the market value of abalone improved, peaking between 1998 and 2000. Much of this poaching was thought to have occurred under the guise of recreational fishing. Levels consequently began to drop around 2000, when permit regulations became more restrictive (due to shortening of the season) and again in 2003, when the recreational fishery was closed. Poaching activity was further reduced by improved enforcement levels (facilitated by cooperation with local rights holders) and establishment of the Cape Pensinsula marine protected area in 2004. Poaching is currently thought to be low.
Poaching trends in Zone G were considered to be similar to Zone E, but with a lag of approximately one year. In contrast to Zone E, however, poaching is thought to have remained high with only slight decreases in recent years.
Population dynamics models
Reference model
The Reference model is a discrete-time Schaefer model17 of population dynamics:
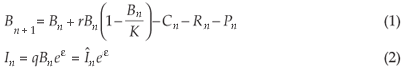
where n is the model year, representing a season of fishing from October in year n – 1 to September in year n, with {n = 1977, 1978,..., 2007}; Bn is the population biomass in year n, assuming B1977 = K; r is the intrinsic growth rate; K is the carrying capacity; Cn is the annual commerical catch in year n; Rn is the annual recreational catch in year n; Pn is the annual illegal catch in year n; q is the catchability coefficient; and, In is an index of population size, in this case the GLM-standardized CPUE measured in kilograms per minute dived.
Observation error [Equation (2)] is assumed to have a log-normal distribution with ε ~ N (0, σ2). Process error is assumed to be negligible [i.e. no error term in Equation (1)].
The negative log-likelihood of the observed Commercial CPUE values is then given by:
with the maximum likelihood value of q provided by the closed form:

where s is the number of years for which CPUE data are available.
Participatory model
The Participatory model is identical in all respects to the Reference model, except that instead of inputting the Illegal and Recreational catches, their combined value (termed collectively as the 'Non-Commercial' catch) is estimated. The model is therefore represented as:
where  n is the estimated 'Non-Commercial' catch for year n.
The model is fitted to CPUE data by maximum likelihood as described by Equations (3) and (4).
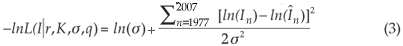
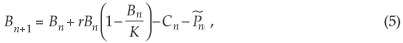
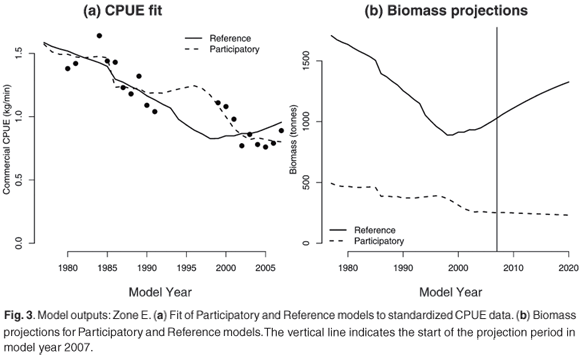
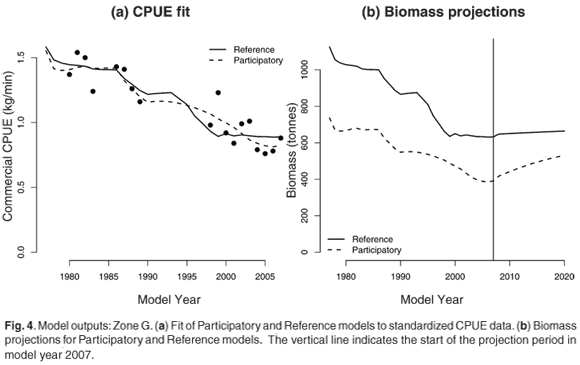
The justfification for this approach is twofold. First, the Recreational catch is by far the dominant catch series (Figs 1a and 2a), and fits when Recreational catch was input were poor (see Reference model fits Figs 3a and 4a), suggesting that it may be inaccurate. Inclusion of the Recreational catch series in the model would therefore likely disrupt any attempts to estimate illegal catches separately. The unreliability of the Recreational catch record was also asserted by the stakeholders interviewed. However, there was also perceived to be an association between recreational and illegal fishing, particularly in Zone E. The Recreational and Illegal catch data used by the Reference model were therefore excluded and instead their combined value was estimated.
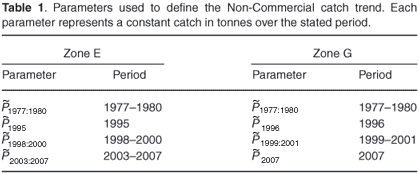
The Non-Commercial catch was assumed to follow the trends for each zone described during stakeholder interviews. Specifically, it was described by four parameters, each equal to the Non-Commercial catch over a specified period (Table 1). The Non-Commercial catch trend was completed by interpolating between these time periods to create the estimated vector of Non-Commercial catches, .
Parameter estimation
All parameters, namely {K, r, σ, q} for the Reference model and {K, r, σ, q,} for the Participatory model, were estimated within a maximum likelihood framework using AD-Model Builder v6.02 (Otter Research Ltd). Convergence was checked in each case. Confidence intervals were obtained from the likelihood profiles for each parameter. Likelihood theory states that for a given parameter θ and its maximum likelihood estimate 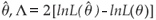 follows a χ2 distribution with one degree of freedom. This allows confidence intervals to be approximated numerically by finding θ, so that Λ equals the required (95%) quantile of the χ2 distribution.
In order to compare the Reference model (Equation 1) currently used in the stock assessment with the Participatory model (Equation 5) presented here, model goodness of fit was measured using the Akaike Information Criterion.18 This is calculated as AIC = –2lnL + 2p where p is the number of parameters estimated (four for the Reference model and a maximum of eight for the Participatory model). The model with the lowest AIC is considered to be the best representation of the data.
To compare the implications of model predictions for management of the abalone resource, both the biomass B and replacement yield RY for 2008 are reported. The replacement yield for year n for the Reference model is given by:
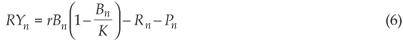
and represents the maximum sustainable commercial catch for that year. For the Participatory model, n is used instead of Rn and Pn in Equation (6).
Biomass projections
Biomass projections are presented for each zone up to 2020 assuming an unchanged TAC. Current TAC values are listed in Tables 2 and 3. Estimated Non-Commerical catches were assumed to be unchanged during the projection period (i.e. equal to 2007).
Results
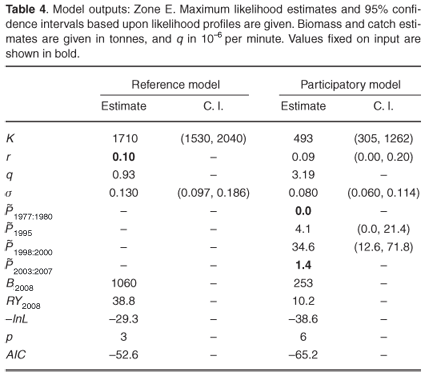
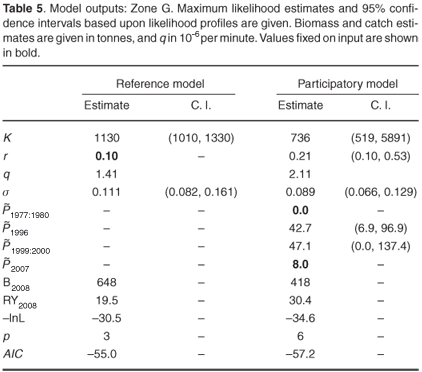
The results of each model fit are given in Tables 4 and 5. For both zones it was found that the Participatory model provided a better explanation of the data (as indicated by the AIC), giving markedly different biomass predictions in comparison with the Reference model (Figs 3b and 4b).
Zone E
For the Reference model, initial estimates of r were unrealistically small, and it was necessary to fix r during estimation of K and σ. Values of r = 0.1 and r = 0.2 were chosen on the grounds of previous work,19 although it was found that r = 0.1 gave a superior model fit (as indicated by the AIC). The results assuming r = 0.1 are therefore presented. When fitting the Participatory model, examination of the profile likelihoods for 1977:1980 and 2003:2007 revealed there to be very little information for estimation of their values (i.e. changes in 1977:1980 and 2003:2007 had little impact on the likelihood). 1977:1980 and 2003:2007 were therefore fixed at 0.0 and 1.4 tonnes, respectively, the latter being the illegal catch currently agreed upon by the Abalone Scientific Working Group (Table 2).
Fit of the Reference model was poor (Fig. 3a), and the Participatory model gave a markedly improved AIC (Table 4), providing a better representation of the CPUE series in recent years (Fig. 3a). It is notable that estimates of K and B2008 are substantially smaller for the Participatory model, consistent with estimated catches, which are much smaller than those assumed by the Reference model (Fig. 1). It is also noticeable that the biomass trend predicted by the Participatory model is less optimistic about the resource and its potential for recovery (Fig. 3b), with the estimated replacement yield for 2008 only about a quarter of that predicted by the Reference model.
Zone G
Analysis of the data from Zone G followed a similar rationale as Zone E. For the Reference model, r was fixed at r = 0.1. For the Participatory model, values of 1977:1980 and 2007 were also fixed at 0.0 and 8.0 tonnes, respectively, the latter value again reflecting the currently agreed upon illegal catch for Zone G (Table 3).
Poor fit of the Reference model is most noticeable for recent years (Fig. 4a) and the Participatory model produced an improved representation of the data (Table 5), although the small difference in AIC values suggests this improvement to be slight. The total biomass in Zone G is likely to be overestimated by the Reference model, being about 50% greater than that given by the better-fitting Participatory model. The Participatory model also suggests that the resource in Zone G is recovering, giving a higher replacement yield (Table 5) and more optimistic biomass projections (Fig. 4b).
Discussion
Modelling of population dynamics is an invaluable tool for resource management. However, its usefulness is dependent on the quality of the data. For the South African abalone, data on IUU catches are particularly poor despite the high levels of illegal fishing impacting the resource.3,20–23 Here we have shown that a participatory approach to stock assessment, which aims to address such unavoidable data deficiencies, can lead to an improved understanding of resource dynamics. Focus was restricted to a limited subsection of the South African abalone population, noting that there is even more intensive poaching in some of the other zones, and sophisticated methods for quantifying this have had to be developed.23
The combined Recreational and Illegal catch was estimated by fitting a logistic model to Commercial CPUE data. Co-estimating Non-Commercial catch alongside other model parameters allowed the model a high degree of flexibility to explore the parameter space within the bounds stipulated for this Non-Commercial catch trend. It was established a priori (through the stakeholder interviews) that these trends were likely to provide a reasonable reflection of actual catches. The improved model fits resulting from this approach can therefore be justified as largely consistent with available information.
It is notable that biomass predictions from the Participatory model fits are markedly different to those from the Reference models. For both zones the total biomass estimated by the Participatory model is much less than that given by the Reference model. Furthermore, predictions regarding resource recovery are model dependent. The improved Participatory model fit for Zone E provides strong evidence for a downward resource trajectory, suggesting that the harvesting of abalone populations in this zone is above the sustainable level. This contrasts with the more optimistic outlook given by the Reference model. For Zone G the converse is true. Although evidence in this case is much weaker, improved fits for the Participatory model suggest that the resource may be recovering, whereas the Reference model indicates a flat future trajectory.
This implementation of a Participatory model to assess status of the South African abalone resource revealed it to be a fruitful complement to the standard modelling approach. It also had the additional benefit of furthering stakeholder inclusion in the management process, with potential benefits for compliance.12 Co-management practices (in which stakeholders are closely involved in management of the resource) have been upheld as solutions to reducing the overexploitation of many Latin American benthic shellfish stocks,24–26 where traditional top-down management has failed. This is consistent with an increasing recognition that the most successful fisheries management strategies are those that award long-term property rights,27 a principle embodied by the individually transferable quota (ITQ) and territorial user rights in fisheries (TURF) management systems.27–29 These systems are intended to confer a sense of ownership to the fishers and therefore provide an incentive toward sustainability.
In response to escalating poaching, the South African government allocated long-term (10-year) commercial fishing rights in 2003 and announced a new policy to underpin the allocation process.30 Although this policy was intended as a TURF system, in which fishers are allocated rights to exploit their own locally fished areas, its efficacy was undermined by the granting of access rights to members of spatially (and socially) disjoint communities (M. Hauck, pers. comm.). This negated the principles of ownership and exclusivity intended to foster compliance within each TURF. Despite broadening of access to fishing among previously disadvantaged communities under the Marine Living Resources Act (1998),31 and creation in 2001 of a limited commercial sector for small-scale operations (which in 2004 had 29% of the total TAC allocation32), many traditional fishers have failed to gain access to fishing rights.12,31,33 Furthermore, TAC cuts mean that the economic viability of existing quotas is in decline. The incentive to poach illegally has thus remained high,12 with drastic consequences for the long-term commercial viability of the fishery.
Contributions to this project were made by S. Russell, M. Cameron, A. Cimma, M. Anthony, M. Slamdien, G. Christian (South African Abalone Industry Association — S.R., G.C., F.L., A.C., M.A. and M.S. are also members of the Cape Town Abalone Rights Holders Association), R. Adams (Table Mountain National Park) and J. de Wit (Marine and Coastal Management Compliance Inspectorate). The collection of interview data was facilitated by S. Russell, M. Hauck (Environmental Evaluation Unit, University of Cape Town) and A. MacKenzie (Marine and Coastal Management). Comments and criticisms by D. Butterworth (Marine Resource Assessment and Management Group, University of Cape Town) and M. Hauck are gratefully acknowledged. Financial and logistical support was provided by Marine and Coastal Management with additional funding from the National Research Foundation, South Africa.
1. Tegner M.J. (1993). Southern California abalones: can stocks be rebuilt using marine harvest refugia? Can. J. Fish. Aquat. Sci. 50, 2010–2018. [ Links ]
2. Shepherd S.A.,Tegner M.J. and del Próo A.G. (Eds) (1992). Abalone of the World: Biology, fisheries and culture. Fishing News Books, Oxford. [ Links ]
3. Hauck M. (1999). Regulating marine resources in South Africa: a case study of abalone poaching. Acta Juridica 1999, 211–228. [ Links ]
4. Agnew D.J. (2000). The illegal and unregulated fishery for toothfish in the Southern Ocean, and the CCAMLR catch documentation scheme. Marine Policy 24, 361–374. [ Links ]
5. Gallic B.L. and Cox A. (2006). An economic analysis of illegal, unreported and unregulated (IUU) fishing: key drivers and possible solutions. Marine Policy 30(6), 689–695. [ Links ]
6. Sumaila U.R., Alder J. and Keith H. (2006). Global scope and economics of illegal fishing. Marine Policy 30(6), 696–703. [ Links ]
7. Ainsworth C.H. and Pitcher T.J. (2005). Estimating illegal, unreported and unregulated catch in British Columbia's marine fisheries. Fish. Res. 75(1–3), 40–55. [ Links ]
8. Tarr R.J.Q. (1993). Stock assessment and aspects of the biology of the South African abalone Haliotis midae. Ph.D. thesis, University of Cape Town, South Africa. [ Links ]
9. Mayfield S. and Branch G.M. (2000). Interrelations among rock lobsters, sea urchins and juvenile abalone: implications for community management. Can. J. Fish. Aquat. Sci. 57, 2175–2185. [ Links ]
10. Tarr R.J.Q., Williams P.V.G. and MacKenzie A.J. (1997). Abalone, sea urchins and rock lobster: a possible ecological shift that may affect traditional fisheries. S. Afr. J. Mar. Sci. 17, 319–323. [ Links ]
11. van Sittert L., Branch G., Hauck M. and Sowman M. (2006). Benchmarking the first decade of post-apartheid fisheries reform in South Africa. Marine Policy 30, 96–110. [ Links ]
12. Hauck M. and Kroese M. (2006). Fisheries compliance in South Africa: a decade of challenges and reform 1994–2004. Marine Policy 30, 74–83. [ Links ]
13. Plagányi É.E., Butterworth D.S. and Brandão A. (2001). Toward assessing the South African abalone Haliotis midae stock using an age-structured production model. J. Shellfish Res. 20(2), 813–827. [ Links ]
14. Edwards C.T.T. and Plagányi É.E. (2007). Schaefer model predictions of abalone dynamics in Zones E and G based on commercial CPUE data from 1980 to 2007. Working Group Document WB/AB/07/Aug/25, Marine and Coastal Management, Cape Town. [ Links ]
15. Plagányi É.E. and MacKenzie A. (2006). Further revisions to catch data for abalone in Zones E and G. Working Group Document WG/AB/06/Jul/13, Marine and Coastal Management, Cape Town. [ Links ]
16. Edwards C.T.T., Plagányi É.E., Brandão A. and Butterworth D.S. (2007). Standardisation of the commercial CPUE series for abalone in Zones E and G from 1980 to 2007 using a mixed effects model. Working Group Document WG/AB/07/Aug/24, Marine and Coastal Management, Cape Town. [ Links ]
17. Schaefer M.B. (1954). Some aspects of the dynamics of populations important to the management of commercial marine fisheries. Bulletin 1: 27–56, Inter-American Tropical Tuna Commission. [ Links ]
18. Akaike H. (1973). Information theory and extension of the maximum likelihood principle. In Second International Symposium on Information Theory, eds B.N. Petrov and F. Csaki, pp. 267–281. Academiai Kiado, Budapest. [ Links ]
19. Plagányi É.E. and Butterworth D.S. (2005). A simple model of abalone dynamics in Zones E and G. Working Group Document WB/AB/05/Aug/14, Marine and Coastal Management, Cape Town. [ Links ]
20. Dichmont C.M., Butterworth D.S. and Cochrane K.L. (2000). Towards adaptive approaches to management of the South African abalone Haliotis midae fishery. S. Afr. J. Mar. Sci. 22, 33–42. [ Links ]
21. Hauck M. and Sweijd N. (1999). A case study of abalone poaching in South Africa and its impact on fisheries management. ICES J. Mar. Sci. 56, 1024–1032. [ Links ]
22. Plagányi É.E. and Butterworth D.S. (2008). Does classic stock assessment have a role in a failed case of reconciliation of fisheries with conservation? In Proceedings of the Fourth World Fisheries Congress: Reconciling Fisheries with Conservation, Vancouver, Canada. [ Links ]
23. Plagányi É.E. (2004). Walking the bridge from single- to multi-species approaches in southern African fisheries management. Ph.D. thesis, University of Cape Town, South Africa. [ Links ]
24. Castilla J.C. and Defeo O. (2001). Latin American benthic shellfisheries: emphasis on co-management and experimental practices. Rev. Fish Biol. Fish. 11, 1–30. [ Links ]
25. Castilla J.C., Manríquez P., Alvarado J., Rosson A., Pino C., Espoz C., Soto R., Oliva D. and Defeo O. (1998). The artisanal caletas as unit of production and basis for community-based management of benthic invertebrates in Chile. Canadian Special Publications in Fisheries and Aquatic Science 125, 407–413. [ Links ]
26. Parma A.M., Orensanz J.M., Elias I. and Jerez G. (2003). Diving for shellfish and data: incentives for the participation of fishers in the monitoring and management of artisanal fisheries around southern South America. In Towards Sustainability of Data-Limited Multi-Sector Fisheries, eds S.J. Newman, D.J. Gaughan, G. Jackson, M.C. Mackie, B. Molony, J.S. John and P. Kailoa. Fisheries Occasional Publications, Department of Fisheries, Perth, Western Australia. [ Links ]
27. Stephenson R.L. and Lane D.E. (1995). Fisheries management science: a plea for conceptual change. Can. J. Fish. Aquatic Sci. 52, 2051–2056. [ Links ]
28. Christy F.T. (1996). The death rattle of open access and the advent of property rights regimes in fisheries. Mar. Resour. Econ. 11, 287–304. [ Links ]
29. Caddy J.F. (1999). Fisheries management in the twenty-first century: will new paradigms apply? Rev. Fish Biol. Fish. 9, 1–43. [ Links ]
30. DEAT (2003). Policy for the allocation of commercial fishing rights in the abalone fishery. Department of Environmental Affairs and Tourism, Pretoria. [ Links ]
31. Isaacs M. (2006). Small-scale fisheries reform: expectations, hopes and dreams of 'a better life for all'. Marine Policy 30, 51–59. [ Links ]
32. DEAT (2004). Transformation in the South African Fishing Industry – TAC Controlled Fisheries. Department of Environmental Affairs and Tourism, Pretoria. [ Links ]
33. Sowman M. (2006). Subsistence and small-scale fisheries in South Africa: a ten-year review. Marine Policy 30, 60–73. [ Links ]
Author for correspondence. E-mail: charles.edwards@uct.ac.za

