


Services on Demand
Article
 English (pdf)
 Article in xml format
 Article references
Indicators

Related links
-
 Cited by Google
 -
 Similars in Google
Share

 Permalink
South African Journal of Science
On-line version ISSN 1996-7489
Print version ISSN 0038-2353
S. Afr. j. sci. vol.104 n.1-2 Pretoria Jan./Feb. 2008
RESEARCH LETTERS
Optically stimulated luminescence dating at Rose Cottage Cave
Marc PienaarI, *; Stephan WoodborneI; Lyn WadleyII
IEcosystems Processes and Dynamics, CSIR, P.O. Box 395, Pretoria 0001, South Africa
IISchool of Geography, Archaeology and Environmental Studies, University of the Witwatersrand, Private Bag 3, WITS 2050, South Africa
ABSTRACT
Six optically stimulated luminescence (OSL) dates are compared with stratigraphically associated 14C dates from Rose Cottage Cave. The OSL dates overlap the accepted 14C chronology except for one sample that overestimates the expected age by approximately 30%. A single-grain analysis demonstrates that the testing procedure for feldspar fails to reject single aliquots containing feldspar and the overestimate of age is attributed to this. Seven additional luminescence dates for the Middle Stone Age layers combined with the 14C chronology establish the terminal Middle Stone Age deposits at 27 000 years ago, while stone tool assemblages that are transitional between the Middle Stone Age and the Late Stone Age are dated to between 27 000 years and 20 000 years ago. Although there are inconsistencies in the Middle Stone Age dates, the results suggest that the Howiesons Poort at Rose Cottage Cave dates to between 70 000 years and 60 000 years ago.
Introduction
Much of the rich archaeological heritage in southern Africa is older than 50 000 years, which is the limit of the ubiquitous 14C dating technique. In order to make appropriate inter-site comparisons of artefactual evidence, and further to compare the trajectory of human adaptation with external factors such as changing climates, it is necessary to establish a reliable chronological framework. Optically stimulated luminescence (OSL) dating has become one of the foremost techniques in establishing this framework. OSL is based on the build-up and release of radiation energy in crystalline minerals, typically quartz. The charge build-up manifests as electrons, mobilized in the quartz matrix by environmental radiation, which populate pre-existing energy minima that are called 'traps'. OSL dates represent the time since electron traps within the quartz grains were previously emptied or bleached by heating or exposure to sunlight. The rate at which traps are repopulated is determined by the environmental dose rate expressed in Gy/kyr. The equivalent dose (De) of the sample is divided by the dose rate to calculate the age. Luminescence techniques applied to quartz can be used to obtain depositional ages up to 200 000 years in certain environments.1
Several criteria need to be met in order to achieve accurate OSL results. The measured aliquots should comprise quartz grains only, and should not contain grains of different ages that might have come about through mixing of the sediments or in situ spall decomposition. Mixing of sediments also may occur during sampling when several depositional layers are included in the sample either as a result of the fine nature of the layering, or because of complex, non-horizontal stratification when sampling sections. The zeroing event should also adequately reset the OSL signal in order to avoid the inclusion of quartz grains with residual signals.2,3 In addition, the measured dose rate must represent the average dose rate through time. The widely used laboratory procedure for measuring De in quartz grains is called the single-aliquot regenerative-dose (SAR) protocol.4 Strict rejection criteria are applied to exclude mixed samples, and in order to ensure that adequate bleaching occurred. If these criteria are satisfied, then the accuracy of the method is determined by the accuracy of the dose rate determination. Several factors influence the dose rate determination. These range from the accuracy with which the moisture content can be established for the depositional history of the sample to assumptions made in the dose rate measurement.
At Rose Cottage Cave (RCC), in the eastern Free State, South Africa, sediments are assumed to have been deposited by fluvial action, wind and erosion of the cave roof and wall material.5,6 This scenario suggests the possibility of partial bleaching of the OSL signal at the time of deposition as well as the inclusion of populations of quartz of different ages in any layer. The implicit fluctuation in water content in the cave has implications both for the mobilization of radioactive elements that will lead to changes in the dose rate, and also variability in the attenuation of the radiation flux in the sediment. This scenario is typical of many cave sequences from which Middle Stone Age (MSA) sediments have been excavated, and caution is required in applying the OSL dating technique. Since RCC sediments younger than 50 000 years have one of the best 14C chronologies of all the archaeological sites in southern Africa,5-16 and a comparison can be made between the two techniques, this allows for the testing of the accuracy of the OSL dating technique in a problematic environment.
OSL dating at Rose Cottage Cave
Several luminescence studies using a range of different techniques have been carried out at Rose Cottage Cave. The techniques include infrared stimulated luminescence (IRSL),17 thermoluminescence (TL),17,18 and, more recently, OSL using the SAR protocol.16 The main advancement of the SAR protocol over previous luminescence methods is the ability to correct for sensitivity changes during measurement cycles. It is assumed that the signal from a fixed test dose (Tx) uses the same electron traps responsible for the OSL signal (Lx). The OSL response to a test dose is measured between each regenerative OSL measurement to provide a quantifiable indication of sensitivity change. Murray and Wintle4 suggested that the relationship between the OSL test dose and the OSL regenerative dose must be linear for sensitivity to be adequately corrected.19 Fourteen sediment samples from RCC were subjected to the standard SAR4 luminescence dating protocol. A total of eight of these samples (RCC 6-10, 18, 19, 21) were dated in Pretoria and six (RCC 11-16) were analysed at Risø, Denmark, by A.S. Murray.16 Of the samples, six have finite 14C dates from the associated layers. Samples without associated 14C dates span the pre-Howiesons Poort, Howiesons Poort, and post-Howiesons Poort Middle Stone Age layers at the site (Fig. 1).
The layers from which luminescence samples were collected include six that have associated radiocarbon dates (Fig. 1). Each layer was discretely excavated and predominantly charcoal, but occasionally bone, were radiocarbon dated. The 'orange sand' comprises approximately a metre of deposit that has low artefact density, but it is nevertheless not entirely homogeneous as it retains some sedimentary features.16 It is difficult to reconstruct the provenance of the original samples submitted for analysis by Butzer and Mason, and so we rely on the analyses obtained by Wadley (see Fig. 1 and associated references)
All luminescence samples were taken in dark conditions and subject to quartz isolation pre-treatment in a dark laboratory. Samples were treated with concentrated hydrochloric acid to remove the carbonates and iron, and organics were removed with NaOH. The samples were then dried and bulk sieved into 106-150 µm and 180-212 µm size fractions, depending on their grain size distribution. Magnetic particles were removed using a Franz magnetic separator. A sodium polytungstate solution of specific gravity 2.62 was used for the separation of quartz1,20 and feldspars21 on the basis of their density. The samples analysed at Risø received no further pre-treatment, whereas those analysed in Pretoria were etched in 40% hydrofluoric acid (HF) to remove any contribution from alpha radiation and any remaining plagioclase feldspars. For each sample the quartz grains were mounted on 24 aluminium disks (aliquots) using silicone oil and the De values determined according to the SAR protocol.4 Preheats ranged between 160°C and 300°C for 10 s and a cut-heat of 160°C for 0 s was applied. The Lx and Tx OSL signals were stimulated at 125°C for 40 s with blue light-emitting diodes (LEDs) at 90% power. Measurements were carried out on a Risø automated OSL/TL DA-15 reader. This instrument has both infrared and blue LED stimulation systems and infrared and green laser systems for single-grain measurement. A green long-pass GG-420 filter was installed in front of the blue stimulation diode clusters.22 Both IR and blue diode arrays were equipped with optical feedback systems that stabilized their emission power.22 The 90Sr/90Y source was calibrated by using gamma-irradiated (5 Gy) calibration quartz (180-212 µm) giving ~10.9 Gy/min. A systematic error for the reader was determined from the error of 10 sequential measurements of an aliquot subjected to a fixed irradiation and measurement protocol. This gave a value of 1.8%.
Assessing the equivalent dose (De) determinations
See Appendix 1.
Assessing the dose rate determinations
See Appendix 2.
OSL dates
The OSL results in Tables 3 and 4 and are presented graphically in relation to the stratigraphy in Fig. 1. This includes previous luminescence dates obtained by IRSL, TL17,18 and OSL16 techniques.

Discussion
The younger OSL samples can be compared with the corresponding 14C dates, but the comparison is not direct. OSL ages are calculated in true calendar years, and the age is reported relative to the calendar date of the analysis. 14C dates, by contrast, are relative to the year AD 1950, and the age is calculated using the Libby half-life for 14C, which is known to be in error by approximately 3%.37 This means that '14C years' are not the same as 'luminescence years'. An additional level of complexity arises from natural fluctuations in the production of 14C in the atmosphere. Both the secular variation in 14C and the error resulting from the incorrect half-life used in 14C dating are accommodated in the 'calibration' of 14C dates. In this process, the measured 14C date is compared with 14C dates from tree rings of known age in order to determine the calendar age of the sample. It became clear recently that differences in carbon cycling in the northern and southern hemispheres gives an approximate 40 year apparent age to the southern hemisphere. This has to be taken into account in the calibration step for 14C dates because the tree-ring calibration data set derives entirely from the northern hemisphere. It has been shown38 that using a fixed offset between the northern and southern hemispheres is erroneous and calibration of the southern hemisphere is therefore best achieved on dendro-chronologically dated wood. Unfortunately, no such data set exists for the southern hemisphere for the period before 1000 years ago. Furthermore, the calibration record between 26 kyr and 50 kyr ago is constructed from a variety of data sets such as laminated lake sediments, corals and speleothems. There are offsets greater than 2000 years between these data sets.39 The calibration step is nevertheless important and the consistent use of one calibration data set may produce errors in this time range, but the errors will be consistent between different calibrated 14C dates.
The RCC 14C dates in this study were calibrated using the southern hemisphere 1998 calibration data set (SH98).40 It should be noted that these data are interpolated on relatively few measurements41,42 combined with an average 40 year offset from the northern hemisphere 1998 data set (INTCAL 98).43 Where OSL dates were derived using the SAR protocol, the results were compared with the RCC 14C chronology (Table 5). In order to compare calibrated 14C dates with OSL dates, it is necessary to convert them to the same reference. The term 'correlated 14C age' in this study refers to calibrated 14C ages expressed in calendar years relative to AD 2005 (the year in which the OSL dates were performed) in order to make a direct comparison with the OSL dates. Figure 2 presents a more detailed comparison between OSL and 14C and identifies miscorrelations. Because the 14C calibration can produce asymmetrical error margins, the one-sigma range is presented in Table 5.
Without the benefit of high-resolution gamma spectrometer measurements (HRGS) we use the comparison between 14C and OSL dates as an indication of the accuracy of the dosimetry. In particular the effect of the disparate XRF and field gamma spectrometer measurements (FGS) for %K were assessed. The XRF-derived results are consistently better correlated with the radiocarbon chronology than the FGS derived measurement (not shown), which suggests that there is a problem with the calibration of the FGS. A further comparison was made between the U and Th dose contribution determined from the FGS and TSAC (see Table 3). This difference was not substantial and the conclusion is that the stripping of the gamma spectra was incorrect for the K channel, and correct for the U and Th channels. Only dates based on the XRF dosimetry were further analysed. Table 3 summarizes the final De values and dose rates that were used to calculate the depositional age of the RCC.
Of the OSL-dated samples that have associated radiocarbon dates, RCC 16, RCC 18 and RCC 9 overlap within the 1-sigma error range, whereas RCC 10 and RCC 21 (using single-grain analysis) overlap at the 2-sigma range. The age of RCC 19 is overestimated by approximately 30% and it is anomalous in the depth/age relationship established from both the radiocarbon and OSL chronologies (see Fig. 1). The result for RCC 19 is particularly unsatisfactory as the OSL analysis for this sample presents perhaps the most convincing case for an acceptable date. The De values appear to indicate a single population with minimal scatter around the central value. Such an age discrepancy may result from localized turbation (such as pit digging) that would have elevated older sediments to the surface without necessarily zeroing the OSL signal, or the problem may relate to sampling problems associated with fine stratigraphy (the sampling tube was 30 cm long and 5 cm in diameter), but these seem unlikely. A more likely scenario is that this sample was contaminated with feldspar in the same way that the single-aliquot analysis of RCC 21 was. In the case of RCC 21, the overdispersal of De values (15.8%) (discussed in Appendix 1) prompted the single-grain analysis, but because RCC 19 had a low overdispersion value of 7.2%, the possibility of feldspar contamination was not initially considered, and a single-grain analysis was not performed.
The overall correlation between the radiocarbon chronology and the OSL chronology in the upper RCC sequence gives some confidence that the OSL dates from the pre-14C Middle Stone Age layers are accurate. However, it is noted that RCC 7 yields a date that is younger than those stratified above it (RCC 14, 15 and 6). For this sample either the dose rate is overestimated or the De value is underestimated. The SAR protocol that is used to measure the De value fails when the OSL/dose-response curve saturates. RCC 7's is the only growth curve in this study that showed evidence of saturation at approximately 150 Gy, so that the De value of 127 Gy may be an underestimate. Alternatively, the underestimate of age for RCC 7 may be the result of an overestimation of the dose rate. Previous studies13 suggested that RCC has been a chemically dynamic environment. No bone is preserved in these layers and the stratigraphic section shows that the deposit has deformed substantially through profile compaction and leaching. Several age underestimates are noted in other dating studies of the MSA layers using different luminescence techniques and datable materials (Table 4) and it is possible that dosimetry presents a problem. This has not been demonstrated but the result for RCC 7 is rejected as an outlier.
Conclusion
The most probable ages for RCC, presented in Table 6, reflect combined OSL and 14C age ranges that have been calibrated and presented in years before AD 2005. It should be noted that the age ranges obtained for RCC are the most probable. To fine-tune these results, further study will need to be conducted focusing on the dosimetry and effect of feldspars. The values in Table 6 are rounded to the nearest 500 years and exclude outliers from both the 14C and OSL chronology. The transition between the Robberg and MSA/LSA transition at RCC is clearly defined at 20 000 years ago by 14C dates. The final MSA at RCC is currently dated to 27 000 years ago by both 14C and luminescence chronologies. The MSA/Early Later Stone Age transition at Border Cave is placed at 41 000 years ago and the final ELSA are at about 30 000 years ago (calibrated relative to AD 2005).44 The corresponding period at RCC is represented by the top of the 'almost sterile' orange sand through to the layers classified as MSA IV by Wadley.10 This focuses attention on the RCC 19 OSL date of 31.7 kyr, which is rejected on the basis of the other OSL dates stratified above and below it as well as the 14C dates. A literal acceptance of this date would shift the MSA/LSA transition at RCC closer to the age range defined at Border Cave. If it is shown that RCC 19 is contaminated with feldspar as has been suggested here, then the date is an overestimation of the MSA/LSA, and the 14C chronology will stand. The latter interpretation is the simplest explanation of the data, and is supported by the similarity in stone tool assemblages from the MSA IV stone tool assemblage dated to between approximately 38 000 years ago and 27 000 years ago (layers LYN to Ru) with those defined as ELSA at Border Cave.44,45
Published dates for Howiesons Poort assemblages in South Africa range between approximately 80 000 and 50 000 years ago.16,18,46-50 As the dating techniques improve, this range is likely to narrow. Unfortunately, a largely random scatter in the previous Howiesons Poort dates from RCC undermines their credibility, and it is likely that problems of feldspar contamination are the underlying cause. With the improvement in the SAR OSL dating technique, the results are significantly improved, and this study yields a coherent set of OSL dates that place the Howiesons Poort between 70 000 and 60 000 years ago.
1. Huntley D.J., Hutton J.T. and Prescott J.R. (1993). The stranded beach-dune sequence of south-east South Australia: a test of thermoluminescence dating, 0-800 ka. Quat. Sci. Rev.. 12, 1-20. [ Links ]
2. Singarayer J.S., Bailey R.M., Ward S. and Stokes S. (2001). Assessing the completeness of quartz OSL in the natural environment. Radiation Measurements 40, 13-25. [ Links ]
3. Bailey R.M. (2003). The use of measurement-time dependent single-aliquot equivalent-dose estimates from quartz in the identification of incomplete signal resetting. Radiation Measurements 37, 673-683. [ Links ]
4. Murray A.S. and Wintle A.G. (2000). Luminescence dating of quartz using an improved single-aliquot regenerative-dose protocol. Radiation Measurements 32, 57-73. [ Links ]
5. Butzer K.W. (1984). In Late Cainozoic Palaeoclimates of the Southern Hemisphere, ed. J.C. Vogel, pp. 235-264. Balkema, Rotterdam. [ Links ]
6. Butzer K.W. (1984). In Southern African Prehistory and Palaeoenvironments, ed. R.G. Klein, pp. 1-64. Balkema, Rotterdam. [ Links ]
7. Vogel J.C. (1970). Groningen radiocarbon dates. IX. Radiocarbon 12, 444-471. [ Links ]
8. Vogel J.C. and Marais M. (1971). Pretoria radiocarbon dates. Radiocarbon 1, 387-394. [ Links ]
9. Beaumont P.B. and Vogel J.C. (1972). On a new radiocarbon chronology for Africa south of the Equator, Part 1. Afr. Stud. 31, 65-89. [ Links ]
10. Wadley L. (1991). Rose Cottage Cave: background and a preliminary report on the recent excavations. S. Afr. Archaeol. Bull. 46, 125-130. [ Links ]
11. Wadley L. and Vogel J.C. (1991). New dates from Rose Cottage Cave, Ladybrand, eastern Orange Free State. S. Afr. J. Sci. 87, 605-608. [ Links ]
12. Wadley L. (2005). Review of dated Stone Age sites recently excavated in the eastern Free State, South Africa. S. Afr. J. Sci.. 91, 574-579. [ Links ]
13. Woodborne S. and Vogel J.C. (1997). Luminescence dating at Rose Cottage Cave: a progress report. S. Afr. J. Sci. 93, 467-470. [ Links ]
14. Wadley L. (1997). Rose Cottage Cave: archaeological work 1987 to 1997. S. Afr. J. Sci. 93, 439-447. [ Links ]
15. Clark A.M.B. (1999). Late Pleistocene technology at Rose Cottage Cave: a search for modern behaviour in an MSA context. Afr. Archaeol. Rev. 16, 93-119. [ Links ]
16. Cochrane G.W. (2004). The role of diversity in the evolution of symbolic behaviour: insights from South African lithic assemblages. Ph.D thesis, University of the Witwatersrand, Johannesburg. [ Links ]
17. Woodborne S. (1999). Dating the Middle Stone Age in South Africa. National Research Foundation Final Report: 15/1/3/2/00231. Pretoria. [ Links ]
18. Valladas H., Wadley L., Mercier N., Froget L., Tribolo C., Reyss J.L. and Joron J.L. (2005). Thermoluminescence dating on burnt lithics on Middle Stone Age layers at Rose Cottage Cave. S. Afr. J. Sci. 101, 169-174. [ Links ]
19. Wintle A.G. and Murray A.S. (2006). A review of quartz optically stimulated luminescence characteristics and their relevance in single-aliquot regeneration dating protocols. Radiation Measurements 41, 369-391. [ Links ]
20. Stokes S. (1992). Optical dating of young (modern) sediments using quartz: results from a selection of depositional environments. Quat. Sci. Rev. 11, 153-159. [ Links ]
21. Mejdahl V. (1985). Thermoluminescence dating of partially bleached sediments. Nuclear Tracks and Radiation Measurements 10, 711-715. [ Links ]
22. Bøtter-Jensen L., Andersen C.E., Duller G.A.T. and Murray A.S. (2003). Developments in radiation, stimulation and observation facilities in luminescence measurements. Radiation Measurements 37, 535-541. [ Links ]
23. Wallinga J., Murray A.S., Duller G.A.T. and Törnqvist T.E. (2001). Testing optically stimulated luminescence dating of sand-sized quartz and feldspar from fluvial deposits. Earth Planet. Sci. Lett. 193, 617-630. [ Links ]
24. Murray A.S. and Roberts R.G. (1998). Measurement of the equivalent dose in quartz using a regenerative-dose single-aliquot protocol. Radiation Measurements 29, 503-515. [ Links ]
25. Roberts R.G., Galbraith R.F., Olley J.M., Yoshida H. and Laslett G. (1999). Optical dating of single and multiple grains of quartz from Jinmium rock shelter, northern Australia: Part II, Results and implications. Archaeometry 41, 365-395. [ Links ]
26. Aitken M.J. and Smith B.W. (1988). Optical dating: recuperation after bleaching. Quat. Sci. Rev. 7, 387-393. [ Links ]
27. Murray A.S. and Olley J.M. (2002). Precision and accuracy in the optically stimulated luminescence dating of sedimentary quartz: a status review. Geochronometria 21, 1-16. [ Links ]
28. Aitken M.J. (1998). An Introduction to Optical Dating. Oxford University Press, Oxford. [ Links ]
29. Duller G.A.T. (2003). Distinguishing quartz and feldspar in single grain luminescence measurements. Radiation Measurements 37, 161-165. [ Links ]
30. Jacobs Z., Wintle A.G. and Duller G.A.T. (2003). Optical dating of dune sand from Blombos Cave, South Africa: I - multiple grain data. J. Hum. Evol. 44, 599-612. [ Links ]
31. Jacobs Z., Wintle A.G. and Duller G.A.T. (2006). Evaluation of SAR procedures for De determination using single aliquots of quartz from two archaeological sites in South Africa. Radiation Measurements 41, 520-533. [ Links ]
32. Wintle A.G. and Murray A.S. (1998). Towards the development of a preheat procedure for OSL dating of quartz. Radiation Measurements 29, 81-94. [ Links ]
33. Galbraith R.F., Roberts R.G., Laslett G.M., Yoshida H. and Olley J.M. (1999). Optical dating of single and multiple grains of quartz from Jinmium rock shelter, northern Australia: Part I, Experimental design and statistical models. Archaeometry 41, 339-364. [ Links ]
34. Adamiec G. and Aitken M.J. (1998). Dose-rate conversion factors: update. Ancient TL 16, 37-49. [ Links ]
35. Rees-Jones J. (1995). Optical dating of young sediments using fine-grain quartz. Ancient TL 13, 9-14. [ Links ]
36. Wadley L. (1996). The Robberg industry of Rose Cottage Cave, Eastern Free State: the technology, spatial patterns and environment. S. Afr. Archaeol. Bull. 51, 64-74. [ Links ]
37. Stuiver M. and Polach H.A. (1977). Discussion: Reporting of 14C data. Radiocarbon 19, 355-363. [ Links ]
38. McCormac F.G., Hogg A.G., Blackwell P.G., Buck C.E., Higham T.F.G. and Reimer P.J. (2004). SHCAL04 Southern Hemisphere Calibration, 0-11.0 cal kyr BP. Radiocarbon 46, 1087-1092. [ Links ]
39. Van der Plicht J., Beck J.W., Bard E., Baillie M.G.L., Blackwell P.G., Buck C.E., Friedrich M., Guilderson T.P., Hughen K.A., Kromer B., McCormac F.G., Bronk Ramsey C., Reimer P.J., Reimer R.W. Remmele S., Richards D.A., Southon J.R., Stuiver M. and Weyhenmeyer C.E. (2004). NOTCAL04 - Comparison/Calibration 14C records 26-50 cal kyr BP. Radiocarbon 46, 1225-1238. [ Links ]
40. Stuiver M., Reimer P.J. and Braziunas T.F. (1998). High-precision radiocarbon age calibration for terrestrial and marine samples. Radiocarbon 40, 1127-1151. [ Links ]
41. Talma A.S. and Vogel J.C. (1992). Late Quaternary palaeotemperatures derived from a speleothem from Cango Cave, Cape Province, South Africa. Quat. Res. 37, 203-213. [ Links ]
42. Talma A.S. and Vogel J.C. (1993). A simplified approach to calibrating 14C dates. Radiocarbon 35, 317-322. [ Links ]
43. Stuiver M., Reimer P.J., Bard E., Beck J.W., Burr G.S., Hughen K.A., Kromer B., McCormac F.G., Van der Plicht J. and Spurk M. (1998). IntCal98 radiocarbon age calibration, 24 000-0 cal BP. Radiocarbon 40, 1041-1083. [ Links ]
44. Grün R. and Beaumont P. (2001). Border Cave revisited: a revised ESR chronology. J. Hum. Evol. 40, 467-482. [ Links ]
45. Bird M.I., Fifield L.K., Santos G.M., Beaumont P.B., Zhou Y., Di Tada M.L. and Hausladen P.A. (2003). Radiocarbon dating from 40 to 60 ka BP at Border Cave, South Africa. Quat. Sci. Rev. (Quat. Geochronol.) 22, 943-947. [ Links ]
46. Feathers J. K. (2002). Luminescence dating in less than ideal conditions: case studies from Klasies River Mouth and Duinefontein, South Africa. J. Archaeol. Sci. 29, 177-194. [ Links ]
47. Grün R. and Beaumont P. B. (2001). Border Cave revisited: a revised ESR chronology. J. Hum. Evol. 40, 467-482. [ Links ]
48. Grün R., Shackleton N. J. and Deacon H. J. (1990). Electron-spin resonance dating from Klasies River Mouth Cave. Curr. Anthropol. 32, 427-432. [ Links ]
49. Miller G. H., Beaumont P. B., Deacon H. J., Brooks A. S., Hare P. E. and Jull A. J. T. (1999). Earliest modern humans in South Africa dated by isoleucine epimerization in ostrich eggshell. Quat. Sci. Rev. 18, 1537-1548. [ Links ]
50. Tribolo C. (2003). Apport des methodes de la luminescence à la chronologie des techno-facies du Middle Stone Age associés aux premiers hommes modernes du Sud de l'Afrique. D.Phil. thesis, University of Bordeaux I. [ Links ]
51. Vogel J. C. (2000). Radiometric dates for the Middle Stone Age in South Africa. In Humanity from African Naissance to Coming Millennia, eds P.V. Tobias, M.A. Raath, J. Moggi-Cecchi and G.A. Doyle, pp. 261-268. University of Florence Press, Florence. [ Links ]
Received 11 August 2006. Accepted 17 November 2007.
This article is accompanied by supplementary tables and figures online at www.sajs.co.za
* Author for correspondence. E-mail: mpienaar@csir.co.za
Assessing the equivalent dose (De) determinations
Aliquots from samples RCC 6-10, 18, 19 and 21 were assessed against OSL rejection criteria that were assumed to eliminate most errors derived from the OSL behaviour and sedimentary history of the grains (see Table 1 in supplementary material online). The first and probably the most important test is termed the dose recovery test.23 If the SAR protocol is applied to grains that are artificially irradiated with a known dose and it does not yield that dose (a laboratory dose is not recovered), there is a high probability that the equivalent dose (De) will be inaccurate. Dose recovery experiments24,25 were performed on six aliquots per sample. The aliquots were optically bleached using blue LEDs for 40 s at 125°C. After zeroing, a known laboratory dose assumed to be representative of the equivalent dose was administered and a conventional SAR protocol was performed using a preheat of 240°C and a cut heat of 160°C to see if the dose could be recovered. The recovery ratios were above 0.98 with the exception of sample RCC 8, which gave a 0.92 ± 0.01 recovery ratio.
Recuperation, or 'charge transfer', is the trapping of electrons in the OSL-related traps when they are ejected from non-OSL traps during heat treatment (preheating). This phenomenon can result in unacceptable variability in De values.26 Recuperation was tested by expressing the ratio between an additional zero dose OSL signal and the natural OSL signal as a percentage of the natural [(L5/T5))/(L1/T1)]. All values greater than 5% were rejected.27 No samples from RCC had recuperation values greater than 1.5%.
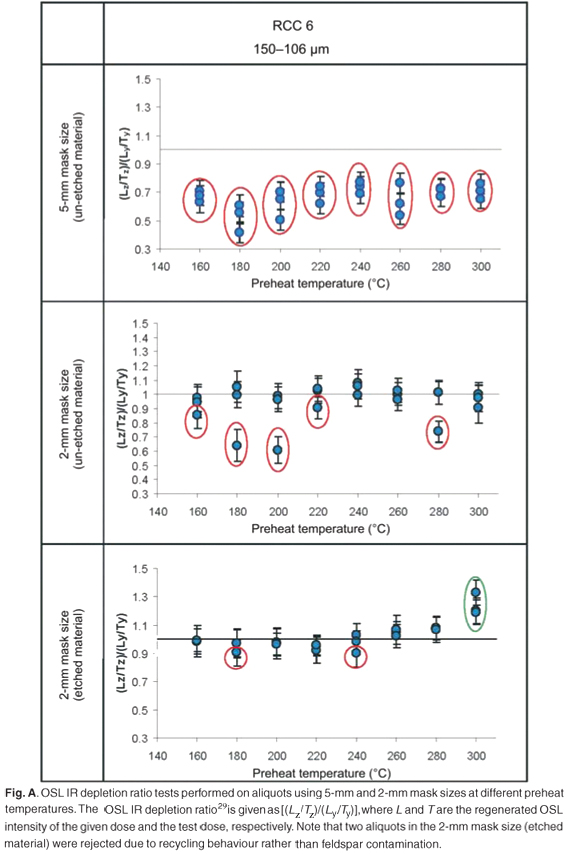
Scatter in the equivalent dose measurements can result from feldspar grains that have not been eradicated during pre-treatment. Feldspar contamination in quartz aliquots can result in overestimated De values because of the potassium contribution to the internal dose, or it can result in an underestimation of De if anomalous fading has taken place.28 The OSL IR depletion ratio test29 relies on the depletion of the OSL signal in feldspars under room temperature IR stimulation, whereas quartz is unaffected. Two successive OSL measurements were made with the same applied dose, but with an IR bleaching step (IR diodes set to 90% power for 100 s) before the second OSL measurement. Any depletion of the signal measured would be the result of feldspar contamination. A reduction criterion of more than two standard deviations from unity was used to determine an acceptable ratio of [(L1/T1)/(L2/T2)].30 Aliquots with an OSL IR depletion ratio below this rejection criterion were assumed to contain feldspar and were omitted from further analysis. Figure A (see supplementary material online) shows the OSL IR depletion ratio test for un-etched aliquots of RCC 6 using a large (5 mm) mask; a 2-mm mask and the results of aliquots of the same sample that was etched in HF acid. Of 408 aliquots in the entire study, 106 (~26%) were rejected due to feldspar contamination. The following analysis is restricted to only the 74% of aliquots that passed the OSL IR depletion ratio test.
The recycling ratio (R-ratio) test was used to check reproducibility within the SAR measurement cycle.4 In this study, two regenerative doses were repeated: one with a low dose to mimic the first regenerative point in which most sensitivity changes took place, and a second point with a high dose.31 The two recycling ratios [(Lx1/Tx1)/(Lx2/Tx2)] should be very close to unity if appropriate sensitivity corrections during a SAR measurement cycle are applied. In practice, less than two standard deviations from unity is acceptable.2 Most of the aliquots from RCC pass this test, indicating good recycling behaviour.
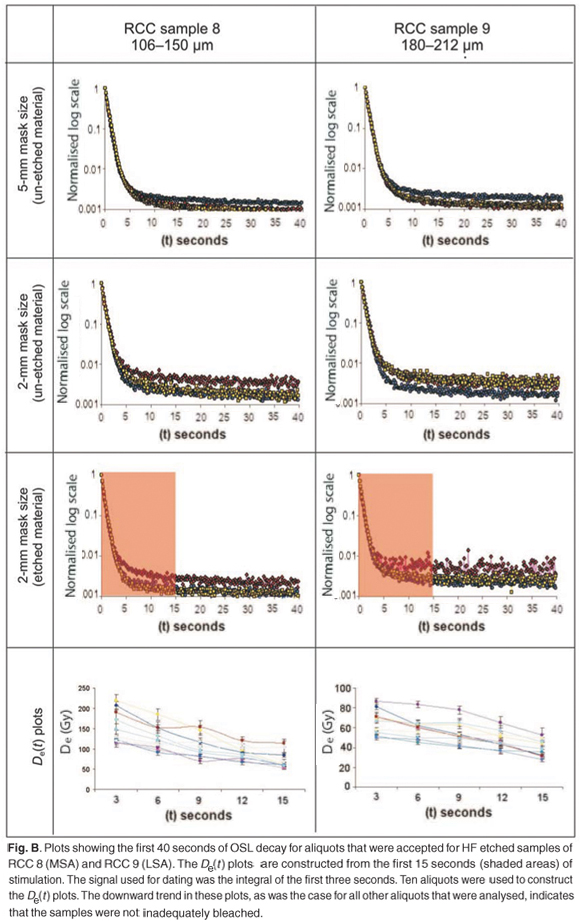
The test used to establish adequate bleaching is the De (t) method.3 This relies on the fact that the OSL signal comprises a thermally stable fast bleaching component and slow bleaching components that can be resolved. If the sample is partially bleached, then the slower bleaching components yield a greater residual signal. This test calculates De as a function of stimulation time (using approximately 0.5-second integration channels), and it was performed on samples RCC 6-10, 18, 19 and 21. Ten random aliquots representative of a preheat range between 160°C and 300°C were used for each sample. The results indicated that no partial bleaching had occurred. Partial bleaching would be anticipated with fluvial deposition or weathered spall contamination, and the results seem to indicate a predominantly aeolian mode of deposition (see Fig. B online).
After all rejection criteria4 have been met, the remaining aliquots were subject to a preheat plateau test. For each aliquot the De value was plotted against preheat temperature to establish if the thermal treatment was too passive and did not adequately remove the unstable signal components. This was a test of the appropriateness of the preheat protocol; where a plateau was not established in a given preheat temperature range, all aliquots preheated in that range were rejected.32
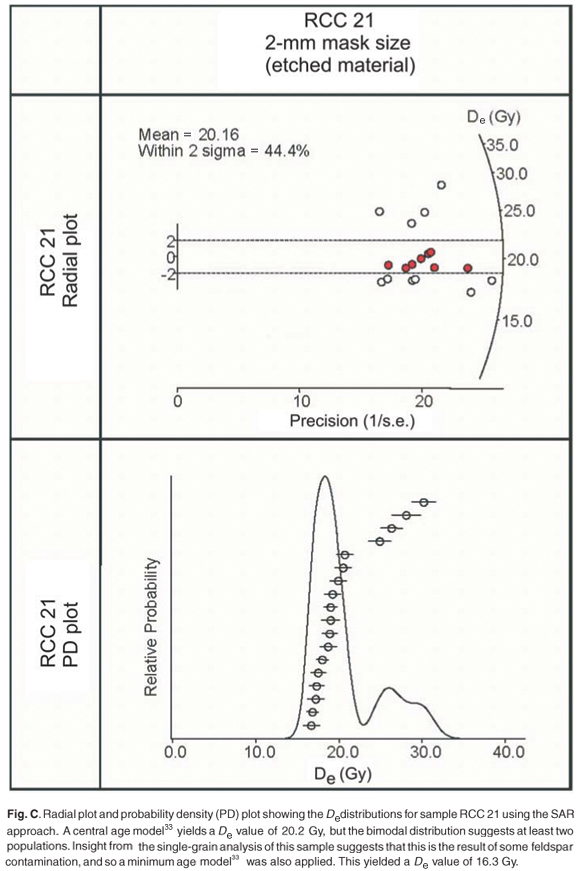
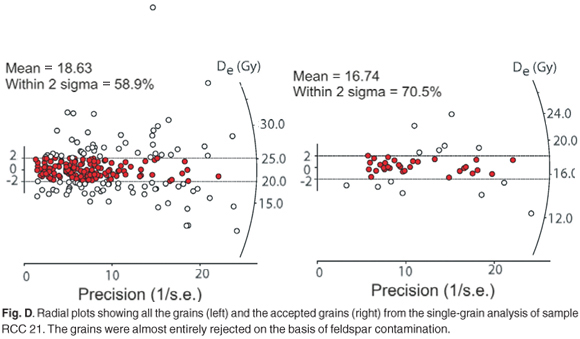
The final assessment was of the distribution of De values in the form of over-dispersion values31 (see Table 1 online) and a visual assessment in radial and probability density plots. With the exception of RCC 21 (see Fig. C online), all the samples were scattered evenly around a central mean so the central age model was used33 to determine the De values. Because of its asymmetric De distribution, RCC 21 was selected for single-grain analysis (see Fig. D online). This method used the same protocol as the multi-grain aliquots except that a laser was used to stimulate individual grains. The logic behind the single-grain analysis is to separate different populations of grains from a sample of mixed age and in this way explain the observed over-dispersion. A total of 1000 grains were analysed, but in the case of RCC 21 the analysis did not show a mixed population. Instead, over 50% of grains were rejected due to feldspar contamination when using the OSL IR depletion ratio test.29 This is surprising as the same fraction of pre-treated grains was used to make the single-aliquot and the single-grain analyses, and only one of the 24 single aliquots was rejected on this criterion. The HF etch appeared not to have removed all feldspars, but the IR-depletion test on the aliquots did not identify the problem with any accuracy. The result of the single-grain analysis indicated that the high De values in the single-aliquot analysis were the result of feldspar contamination. It is not clear why the feldspar test was more effective using laser stimulation on individual grains than using diode stimulation on aliquots. Because the single aliquots for RCC 21 must also have contained feldspar, and the feldspars led to De overestimations, it was more appropriate to apply a minimum age model.33 This yielded a De value of 16.3 Gy, which corresponds well with the single-grain value of 17.0 ± 1.0 Gy.
Assessing the dose rate determinations
The dose rate was measured using a variety of methods. Thick source alpha counting (TSAC) analyses were done in the Pretoria laboratory, field gamma spectrometer measurements (FGS) were conducted for some of the samples with an Aptec system at the time of sampling, and high-resolution gamma spectrometer measurements (HRGS) were performed on a set of samples sent to Denmark for analysis by A.S. Murray.14 Bulk potassium was measured by X-ray fluorescence (XRF) analysis by a commercial subcontracted laboratory (Setpoint). The element concentrations of uranium, thorium and potassium were converted into dose rates using the method outlined by Adamiec and Aitken34 using an assumed average water content of 5 ± 5% and an alpha efficiency (where appropriate) of 0.04 ± 0.02.35 The moisture content for RCC was measured between 1% and 3%, but it is assumed that this was not the average value over the depositional history of the site. The large error in the water content estimation is assumed to cover the range of variability that might have occurred had the site been substantially wetter than the present from time to time.
The %K values obtained by FGS and XRF analysis did not always produce the same results (see Table 2 online). Potassium feldspar was found in relatively high concentrations throughout the site and the average contribution of 40K to the total dose rate for all samples was 65%. The large contribution from 40K to the dose rate limits the effects of the Th and U measurement error in the total environmental dose rate, but it amplified the discrepancy between %K values determined by different techniques. Where there were both XRF and FGS measurements for samples, the FGS/XRF ratio was calculated (Table 2). The ratios averaged at 0.86 ± 0.13%. The XRF technique measured the average K concentration of the bulk sample taken back to the laboratory, whereas FGS integrated the gamma spectrum from a sphere of approximately 30 cm radius in situ in the locale from which the sample was removed. A possible cause might be the inhomogeneous distribution of K due to the large numbers of hearths present in the archaeological record.10,36 The two approaches may have measured different things, but if this was the cause of the discrepancy then a random distribution of FGS/XRF ratios might be anticipated. Alternatively, a consistently biased error may have arisen from systematic errors in either the FGS or XRF.
The contribution of alpha radiation is assumed to be negligible on samples that were subject to HF etching. The result from single-grain analysis of RCC 21 illustrates that feldspars were not entirely removed by the HF treatment and the possibility that the outer surface of quartz grains was not completely etched must be considered. Where both etched and un-etched material was analysed, the latter was preferred on the basis of the better dosimetry. Only sample RCC 8 produced a statistically distinct date using the etched and un-etched material, and the latter was more closely aligned with RCC 12 date from the same layer.
Pienaar M., Woodborne S. and Wadley L. (2008). Optically stimulated luminescence dating at Rose Cottage Cave S. Afr. J. Sci. 104, 65-69.

