Servicios Personalizados
Articulo
Indicadores
Links relacionados
-
 Citado por Google
 -
 Similares en Google
Compartir
South African Journal of Science
versión On-line ISSN 1996-7489
versión impresa ISSN 0038-2353
S. Afr. j. sci. vol.103 no.7-8 Pretoria jul./ago. 2007
RESEARCH ARTICLE
The nutrient status of South African rivers: concentrations, trends and fluxes from the 1970s to 2005
S. de VilliersI, II, *; C. ThiartII, III
IDepartment of Geology, Geography and Environmental Studies, Stellenbosch University, Private Bag X1, Matieland 7602, South Africa
IIAEON (African Earth Observatory Network)
IIDepartment of Statistical Sciences, University of Cape Town, Rondebosch 7700, South Africa
ABSTRACT
Eutrophication of river systems, resulting from nutrient enrichment, is globally considered to be one of the most serious threats to freshwater ecosystem services such as water quality and biodiversity. This study provides a comprehensive overview of the nutrient status of the 20 largest river catchments in South Africa, based on dissolved inorganic nitrogen (NO3– + NO2–) and phosphorus (PO43–) long-term water quality monitoring data collected by the Department of Water Affairs and Forestry. Nutrient levels exceeding recommended water quality guidelines for plant life are observed in all of the rivers, except one. Additionally, dissolved-phosphorus levels exceeding recommended concentrations for aquatic animal life prevail episodically in all but 6 of the catchments. Alarmingly, statistically significant (P < 0.05) upward trends in dissolved PO43– levels are found in almost 60% of the rivers evaluated. The most likely cause of increasing nutrient enrichment is effluent from dysfunctional sewage works and unsewered human settlements. This poses a serious and costly threat to water quality and biodiversity. Nutrient fluxes associated with agricultural runoff, representing loss of soil fertility, translate into fertilizer-equivalent costs exceeding several hundred million rands annually.
Introduction
Anthropogenic disturbances to the natural nitrogen and phosphorus cycles over the last couple of decades have resulted in eutrophication being considered one of the most serious problems facing freshwater ecosystems globally.1–6 Nutrient enrichment alters the competitive balance between plant species, resulting in the degradation of aquatic plant communities, which provides food, shelter and breeding habitats for a range of animal species. Additionally, elevated nutrient levels can be detrimental to the health of humans and toxic to aquatic animals. The most dramatic manifestation of eutrophication in freshwater and marine aquatic systems is extensive kills of both invertebrates and fishes, as a result of oxygen depletion related to the decomposition of the excess organic matter produced. Nutrient levels in rivers are also of significance to the health of water bodies fed by it, such as wetlands, estuaries, groundwater and surface freshwater reservoirs.
The dissolved inorganic nitrogen and phosphorus content of river water derives from both natural and anthropogenic sources. In the absence of pollution, the nutrient content of river water represents primarily a balance between the production of dissolved species through the chemical weathering of nitrogen-and phosphorus-containing geological deposits in the catchment, and consumption by biological productivity in the system.1,4,7
The principal anthropogenic point sources of inorganic nitrogen and phosphorus in aquatic ecosystems are: municipal sewage effluents and overflows of storm and sanitary sewers, wastewater from livestock farming, industrial wastewater effluents, and runoff from waste disposal sites, working mines and unsewered industrial sites. The main anthropogenic diffuse sources are: agricultural activities (use of manure and nitrogenous fertilizers, cultivation of N2-fixing crops), runoff from nitrogen-saturated and burned forests and grasslands, urban runoff from unsewered, sewered and failed septic systems, runoff from construction sites and abandoned mines, polluted ground waters, anthropogenic atmospheric deposition loads (such as from fossil fuel combustion) and biomass burning. Globally, the dominant source of the increase, by a factor of about 4, in nutrient levels are widespread agricultural intensification and increased discharge of domestic wastes.1–4
This study provides the first comprehensive overview of the nutrient status of South Africa's rivers. In addition to geographic gradients in dissolved [NO3–+NO2–] and [PO43–] levels, seasonal nutrient profiles, temporal trends and fluxes are evaluated. The classification of the trophic status of South Africa's aquatic ecosystems is currently restricted to four broad categories: oligotrophic, mesotrophic, eutrophic, and hypertrophic.8,9 Additionally, Target Water Quality Range (TWQR) values are stipulated for the water-use sectors of domestic, recreational, industrial, irrigation, stock watering, and aquaculture,9 but not for aquatic ecosystems. This is because aquatic ecosystems in different localities have very different requirements, and the site-specific studies needed to derive TWQR values have not been carried out in South Africa. River water nutrient levels presented in this study are, therefore, compared to internationally accepted guidelines for aquatic ecosystem health.
Study area, database and data handling
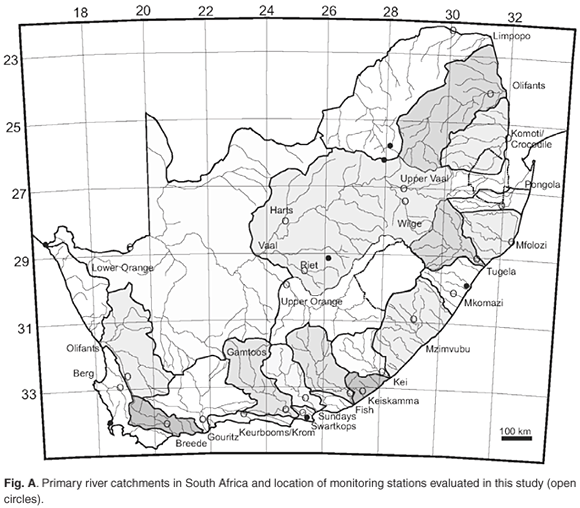
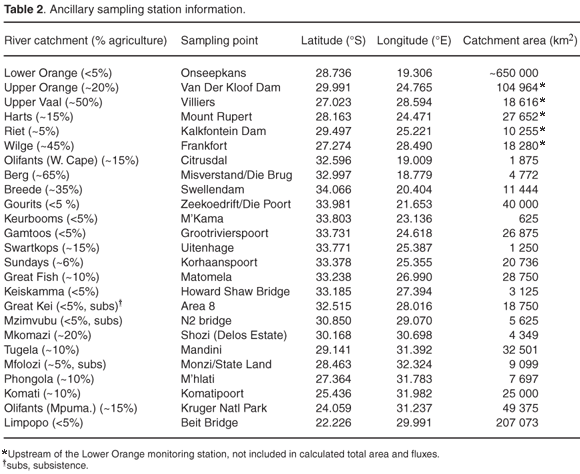
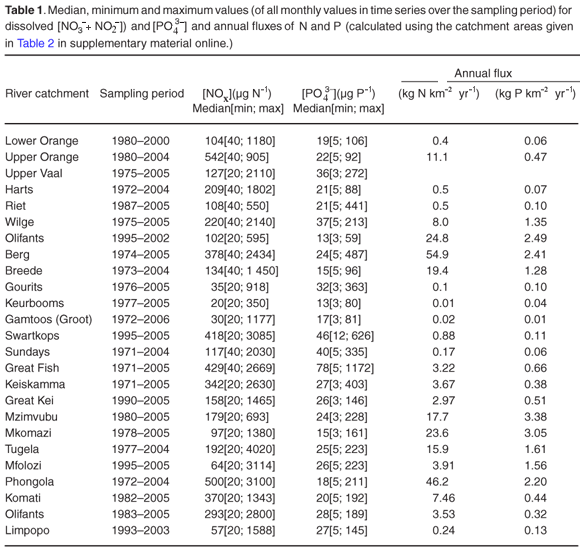
Long-term water quality monitoring results for the 20 largest primary river catchments in South Africa (see Table 1, and Table 2 and Fig. A in supplementary material online) was generously provided by the Department of Water Affairs and Forestry (DWAF) on special request. Water quality monitoring parameters include the dissolved inorganic nitrogen species [NO2– +NO3–] (expressed as µg N l–1, with 20–40 µg N l–1 detection limits) and dissolved inorganic phosphate (also referred to as soluble reactive phosphate, SRP) reported as [PO43–](µgPl–1, with 3–5 µg P l–1 detection limits) at all the stations evaluated. Data for [NH4+] and total dissolved phosphorus (TP) are available at only some of the stations or some sections of the record. Additionally, where [NH4+] data are available, values are typically close to or at the analytical detection limit (~40 µg N l–1) and less than 10% of [NO2–+NO3–] ([NOx]) values. For the purposes of this study, therefore, the more comprehensive [NOx] and [PO43–] data only were evaluated.
Sampling frequency varies among sites, from almost weekly to monthly. Where more than one water quality data point is available in any given month, an average value was calculated to provide time-series data at a monthly resolution. This also provides compatibility with the DWAF's total monthly water flow records (available at www.dwaf.gov.za). Further data reductions, such as the calculation of median concentration values for the entire time series and monthly medians for the construction of a representative annual profile for each site (Fig. 1) are elaborated on below.
The aim of this study was to assess comparative nutrient concentrations and fluxes at the primary catchment scale. To that effect, water quality monitoring stations as far downstream as possible in each catchment area were selected. An exception to this is the large Orange River system, which was also evaluated at a secondary catchment scale at monitoring sites along the Vaal River and its tributaries. A total of 25 coincident water quality and flow monitoring stations with drainage areas, ranging from 625 to more than 650 000 km2, were evaluated and statistically analysed (see Table 1 and Fig. A online). The cumulative area represented by the sum of the catchment areas of the chosen sampling points represents more than 95% of the surface area of South Africa.
The damming of rivers and the construction of water transfer pipelines has had a dramatic effect on water budgets within South Africa's river systems. The most significant of these are the completion of the Vaal Dam in 1938, the Bloemhof Dam (also on the Vaal River) in 1970, the Gariep Dam in 1972, the Van der Kloof Dam in 1977 and the Orange–Fish Tunnel in 1975.10 The purpose of this study was not to evaluate the effect of these disturbances of water flow on nutrient budgets. In almost all instances, in fact, water quality monitoring data represent conditions after the dam building phase of the early 1970s. Notable exceptions are the Upper Vaal and Fish rivers. Extensive damming of the Upper Vaal prohibits combining water flow data with nutrient concentrations as a meaningful way of calculating fluxes in the present Upper Vaal River catchment. The Orange–Fish Tunnel water transfer scheme has similar implications for nutrient levels and fluxes in the Fish and Sundays rivers, and data presented have to be interpreted in that context. In some instances, long-term water quality monitoring is carried out at sites at, or just downstream of, large dams, which does require the use of river flow data from upstream locations for meaningful flux calculation purposes. This is the case at the following water quality monitoring sites (water flow station in brackets): the Van der Kloof Dam (Vluytjieskraal at 29.809ºS, 24.438ºE), Harts River (Espagsdrift upstream of the Loskop Dam at 27.902ºS, 24.609ºE), and Riet River (Kromdraai upstream of the Kalkfontein Dam at 29.655ºS, 25.970ºE).
Long-term temporal trends in nutrient concentrations were statistically evaluated by fitting a straight line to the data, with the method of ordinary least squares (OLS). The OLS procedure provides a best linear unbiased estimator of the slope and intercept if the Gauss–Markov conditions are met.11 Some of the data sets exhibit serial correlation or autocorrelation, in which case the slope was estimated using a generalized least-squares estimator according to the Prais–Winston method.12
Results and discussion
River water nitrate, nitrite and phosphate levels
Median [NO3–+NO2–] and [PO43–] values, together with the minimum and maximum values in the time series, are listed in Table 1. Nutrient levels close to or below the analytical detection limits are observed in all of the rivers at some stage during the observation period (minimum values in Table 1). These values, <40 µg N l–1 and <5 µg P l–1, are indicative of near pristine or low natural background levels. Recommended water quality criteria for the protection of aquatic animals are 80–350 µg NO2–-N l–1 and 2000–3600 µg NO3–-N l–1 for the inorganic nitrogen in the form of nitrate and nitrite,13,14 and between 20 and 100 µg P l–1 for soluble reactive phosphorus.6 Unionized ammonia (NH3) is the most toxic form of inorganic nitrogen to aquatic animals, and water quality criteria ranging from 50–350 µg NH3-N l–1 for short-term exposures and 10–20 µg NH3-N l–1 for long-term exposures have been recommended.5,15–17 Evaluation of available pH and NH4+ data for South African rivers suggests that, at the primary catchment scale, NH3 concentrations are negligible and not a concern (de Villiers, unpublished).
Recommended levels of dissolved inorganic nitrogen and phosphorus, for the prevention of eutrophication, are lower than those listed above for aquatic animals. There is some uncertainty about the lower limit of phosphorus required for freshwater plant growth. Levels higher than 30 µg total P l–1 is generally considered conducive to eutrophication, provided that inorganic nitrogen or other nutrients are not limiting.5,18 Plants require nitrogen and phosphorus in a ratio of between 7 and 8 (weight ratio) and concomitant dissolved values of > 400 µg total Nl–1 and > 30 µg total P l–1 are generally considered favourable for eutrophication in freshwater systems. Dissolved [NOx] accounts for most of the total dissolved nitrogen, but dissolved [PO43–] is typically only a fraction of total phosphorus. Available total phosphorus data for the Great Fish, Great Kei and Olifants (Mpumalanga) rivers suggest total phoshorous/PO43–loads of 1.9. 6.8 and 3.2 µg P l–1, respectively (unpublished data), i.e. dissolved [PO43–] levels account for only a fraction of the total phosphorus present. For the purposes of the discussion below, [PO43–]=20µgPl–1 is conservatively used as a threshold value for eutrophication in freshwater systems, in combination with the recommended 400 µg N l–1 value for [NOx]. One should note, however, that aquatic animals naturally adapted to low inorganic nitrogen levels may have lower toxicity thresholds and that these values are unknown for South Africa's freshwater ecosystems.
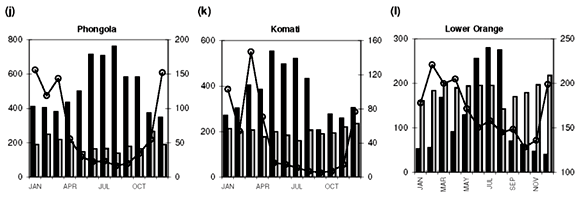
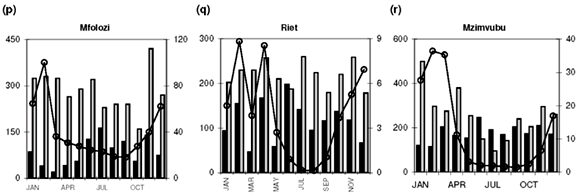
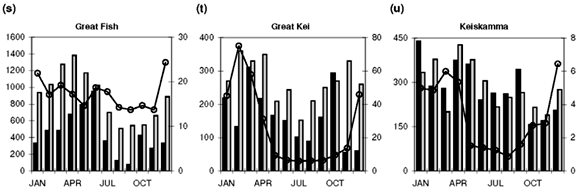
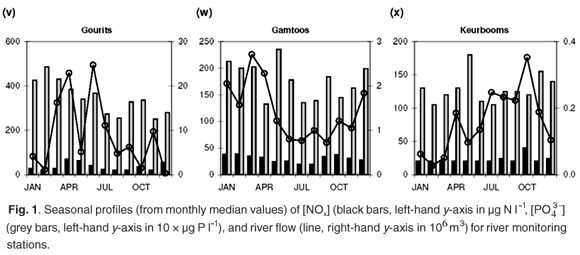
Median [NOx] values exceeding 400 µg N l–1 are found in the Swartkops, Phongola, Upper Orange and Great Fish rivers (Table 1). Seasonal [NOx] profiles (Fig. 1f, j, o, s) confirm the occurrence of values exceeding 400 µg N l–1 throughout, or most of, the year in these catchments. However, maximum values for [NOx] in the time-series data for each catchment indicate that, with the exception of the Keurbooms River, values exceeding 400 µg N l–1 occur at least episodically in all of the river systems. The constructed seasonal profiles (Fig. 1) indicate that, in addition to the four rivers already mentioned, [NOx] > 400 µg N l–1 prevails for at least five months of the year in the Berg (Fig. 1a) and Komati (Fig. 1k) rivers and for one to two months a year in the Upper Vaal (Fig. 1e), Olifants (Mpumalanga) (Fig. 1h), Limpopo (Fig. 1m) and Keiskamma (Fig. 1u) river systems. The Gourits (Fig. 1v), Gamtoos (Fig. 1w) and Keurbooms (Fig. 1x) rivers are the most pristine in respect of their [NOx] levels.
Median [PO43–] values exceeding 20 µg P l–1 are found in 18 of the 25 catchments studied (Table 1). Additionally, maximum values in the time-series data suggest that concentrations exceed the 100 µg P l–1 recommended maximum value for aquatic animal life6 at least episodically in all but six of the catchments (Table 1). Seasonal profiles reveal an even starker picture (Fig. 1; 10 × [PO43–] values plotted on the left-hand y-axis). [PO43–] values exceeding 20 µg P l–1 prevail throughout the year in the Upper Vaal (Fig. 1e), Swartkops (Fig. 1f), Great Fish (Fig. 1s) and Gourits (Fig. 1v) river catchments, and for most of the year in the Berg (Fig. 1a), Tugela (Fig. 1c), Wilge (Fig. 1d), Olifants (Mpumalanga) (Fig. 1h), Phongola (Fig. 1j), Komati (Fig. 1k), Limpopo (Fig. 1m), Harts (Fig. 1n), Upper Orange (Fig. 1o), Mfolozi (Fig. 1p), Riet (Fig. 1q), Mzimvubu (Fig. 1r), Great Kei (Fig. 1t) and Keiskamma (Fig. 1u) river catchments.
As mentioned above, the development of eutrophic conditions requires also the presence of nutrients and, provided nothing else is limiting plant productivity, [NOx]>400 µgNl–1 and [PO43–]>20µgPl–1. Such conditions are observed for most of the seasonal cycle in the Berg (Fig. 1a), Swartkops (Fig. 1f), Komati (Fig. 1k) and Great Fish (Fig. 1s) rivers. The following catchments exhibit potential for eutrophication during part of the annual cycle: Upper Vaal (Fig. 1e), Olifants (Mpumalanga) (Fig. 1h) and Keiskamma (Fig. 1u) rivers. It is important to note that evaluation of data at the primary catchment scale provides only a conservative estimate of the potential threat of eutrophication. At smaller geographic scales, for example in the close vicinity of point sources, much greater levels of nutrient enrichment will occur.
Temporal trends
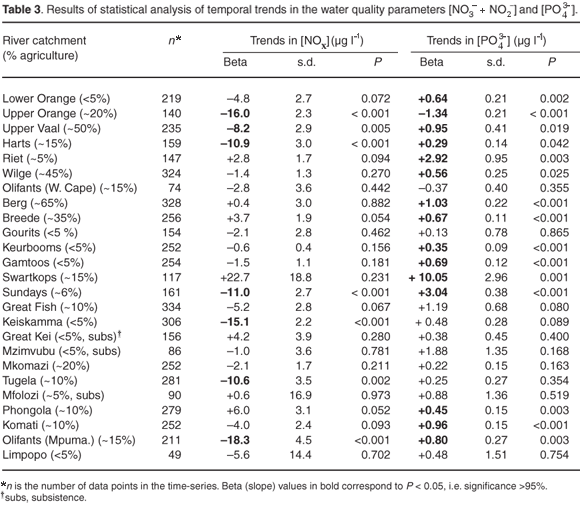
Very significant (P < 0.05) downward trends in [NOx] are observed in 7 of the catchments studied (see Table 2 in supplementary material online): the Upper Orange, Upper Vaal, Harts, Sundays, Keiskamma, Tugela and Olifants (Mpumalanga) rivers. With the exception of the Keiskamma system, all of these catchments support substantial agricultural activity and the downward trend in [NOx], and elevated [NOx] are consistent with reduced use of fertilizers since the late 1970s.19 The intensively cultivated Berg and Breede river systems, however, show signs of increasing [NOx] levels, at the P < 0.10 level in the case of the Breede (see Table 3 online). This is consistent with enhanced agricultural activity in their particular catchments, in contrast to the national trend. There is also evidence for increasing [NOx] levels, at P < 0.10, in the Riet and Phongola systems.
A significant downward trend in dissolved [PO43–](P < 0.001) is found in only one catchment, the Upper Orange River (Table 3), associated with a significant downward trend in [NOx]. Fourteen of the other 24 monitoring sites manifest significant upward trends in [PO43–], at P < 0.05, and an additional two sites an upward trend at P < 0.10 (Table 3). The most pronounced increase in [PO43–] is found in the Swartkops River, with levels increasing at 10.05 µg P l–1 yr–1. With a median value of 46 mg P l–1, this translates into a [PO43–] doubling time of less than 5 years. In combination with the high median and rising [NOx] levels, the Swartkops presents itself as one of the most threatened freshwater systems in South Africa.
Discrete versus point sources of nutrients
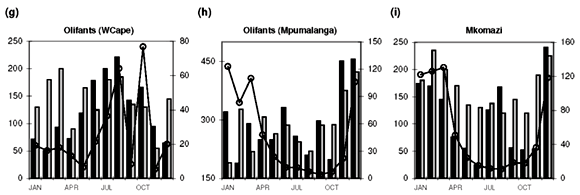
Diffuse nutrient sources produce seasonal concentration profiles coincident with river runoff, that is, concentrations that peak during high runoff conditions. Classic examples of the concentration–runoff profiles produced by a dominant diffuse source are observed for [NOx] and [PO43–] in the Berg (Fig. 1a), Breede (Fig. 1b), Tugela (Fig. 1c), Wilge (Fig. 1d), Upper Vaal (Fig. 1e) and Swartkops (Fig. 1f) rivers. Agricultural activity is an important use of land (Table 1) in all of these areas and the seasonal nutrient profiles are therefore consistent with fertilizer application as the primary diffuse source of both [NOx] and [PO43–] in these catchments. A dominant diffuse source is also suggested by seasonal [NOx] profiles in the Olifants (W. Cape) (Fig. 1g), Olifants (Mpumalanga) (Fig. 1h) and Mkomazi (Fig. 1i) rivers, and seasonal [PO43–] profiles in the Olifants (Mpumalanga) (Fig. 1h), Limpopo (Fig. 1m), Harts (Fig. 1n) and Mzimvubu (Fig. 1r) rivers.
Point sources, in contrast to diffuse sources, result in seasonal concentration profiles that have no relation to runoff they provide a relatively constant input throughout the year, or have an inverse relation to river runoff. Catchments that demonstrate clear evidence for a dominant point source for elevated dissolved [NOx] (>400 µg N l–1) are: the Phongola (Fig. 1j), Komati (Fig. 1k), Lower Orange (Fig. 1l), Limpopo (Fig. 1m), Harts (Fig. 1n) and Upper Orange (Fig. 1o) rivers. Strong evidence for a dominant point source of elevated [PO43–] (>20 µg P l–1) is found in the Gourits (Fig. 1v) River only. Sewage pollution, from either dysfunctional wastewater treatment plants or unsewered human settlements, is the main point source of both [NOx] and [PO43–] in river systems.
The Phongola and Komati rivers have seasonal [NOx] profiles that, as mentioned above, indicate a dominant point source. 'Background' concentrations during high runoff conditions, however, are quite high in both these rivers. It is possible, considering the existence of sugarcane plantations and dry-season burning practices in the corresponding catchments, that these seasonal profiles reflect a combination of strong diffuse and point sources. Biomass burning, related to agricultural activity in this instance, represents a diffuse source of [NOx] to river systems, but because burning occurs during the dry season, it will manifest as elevated [NOx] levels during low-flow conditions. During high-flow conditions, background [NOx] will be raised as a result of runoff from fertilized areas.
Nutrient fluxes
Seasonal [NOx] and [PO43–] profiles were combined with seasonal runoff profiles to calculate annual fluxes (Table 1). Runoff exerts a strong control on calculated fluxes, but it is evident from flux/area ratios that it is not the dominant control. The highest NOx flux/area value is observed in the Berg River, which has a relatively small annual runoff, but whose catchment is the most extensively cultivated of those studied (Table 1).
Indeed, all of the catchments with more than 20% agricultural land-use area have high N and P flux values, >8 kg N km–2 yr–1 and >0.47 kg P km–2 yr –1, respectively. The Olifants (W. Cape) and Phongola rivers are characterized by fluxes of 24.8 and 46.2 kg N km–2 yr–1, which are high compared with those of some of the more heavily cultivated catchments (Table 1). As mentioned above, the seasonal [NOx] profile of the Olifants (W. Cape) (Fig. 1g) River suggests a diffuse, agricultural, source. The relatively high NOx flux/area ratio can therefore be interpreted as suggestive of higher fertilizer application rates than in other cultivated areas. The Phongola River's seasonal [NOx] profile (Fig. 1j) indicates a pronounced point source, as already discussed; the flux calculation underlines the potential quantitative significance of point versus diffuse sources.
The nutrient/area fluxes derived for South African river catchments (Table 1) are much lower than those reported for developed countries, where large fertilizer application rates (>8000 kg N km–2 and >1000 kg P km–2)20 and intense cultivation have dominated the landscape for a long time. In such areas, catchment nutrient fluxes exceeding 800 kg N km–2 yr–1 and 50 kg Pkm–2 yr–1 have been documented.21 These amounts are at least an order of magnitude higher than those reported here for South African river catchments. Although this nutrient load translates into the presence of generally more pristine freshwater ecosystems than those found in industrialized countries, the lower fluxes does not mean that there is no cause for concern. In South Africa and most of the rest of Africa, in spite of the preponderance of nutrient-poor soils, fertilizer application rates are very low, typically less than 1000 kg NPK km–2.19,22 It has been argued that unless this is greatly increased to stimulate agricultural productivity, 'the foundations of sustainable economic growth in Africa' will be seriously undermined.19 The net annual nutrient (nitrogen, phosphorus and potassium) loss for South African soils has been estimated at ~111 × 106 kg NPK, with an estimated fertilizer cost equivalent of ~US$21 million.19 The cumulative river fluxes of nitrogen and phosphorus of 2.5 × 10⁶ kgNyr–1 and ~0.3 × 10⁶ kgPyr–1 (soluble phosphorus only, typically 10–40% of total P), combined with a cumulative river potassium flux of ~24 × 106 kgKyr–1 (de Villiers, unpubl. data), is equivalent to about 25% of net annual losses of soil nutrients in South Africa. The cost corresponding to the removal of these nutrients by rivers is substantial,22,23 not only in terms of equivalent fertilizer cost and the contribution of agricultural output to national economies in Africa, but also that associated with the degradation of ecosystem services such as water quality and biodiversity. The total cost associated with soil nutrient losses and their counterpart, the nutrient enrichment of freshwater ecosystems, can conservatively be estimated to amount to several hundred million rands per annum.
Conclusions
• Pristine conditions (<50 µg N l–1 and <10 µg P l–1) prevail periodically in all of the river systems (with the exception of the Swartkops River).
• Elevated dissolved inorganic nitrogen ([NOx] >400 µg N l–1) occurs at least episodically in all of the rivers, except the Keurbooms River.
• Seasonal nutrient profiles indicate that [NOx] >400 µg N l–1 persists for at least five months a year in the Swartkops, Phongola, Upper Orange, Great Fish, Berg and Komati rivers.
• [PO43–] levels exceeding the 100 µg P l–1 maximum recommended water quality guideline for aquatic animal life arise, at least episodically, at all but six of the river monitoring stations.
• [PO 43–] exceeding 20 µg P l–1 prevails throughout the year in the Upper Vaal, Swartkops, Great Fish and Gourits rivers, and for most of the year in the Berg, Tugela, Wilge, Olifants (Mpumalanga), Phongola, Komati, Limpopo, Harts, Upper Orange, Mfolozi, Riet, Mzimvubu, Great Kei and Keiskamma catchments.
• Conditions favourable to the development of eutrophic conditions are present for most of the year in the Berg, Swartkops, Komati and Great Fish river catchments.
• Seasonal profiles suggest that both diffuse sources (such as agriculture) and point sources (for instance sewage effluent) are important contributors to enriched nutrient levels in South Africa's rivers.
• Nutrient fluxes associated with river loads equates to a significant loss of fertilizer-equivalent nutrients. Given the nutrient-poor status of most of South Africa's soils, and the importance of agriculture to the national economy, this is a cause for serious concern.
The data presented in this study argue strongly for determined efforts to reduce, or prevent, nutrient enrichment of freshwater ecosystems. From a water management perspective, an easy solution presents itself in the form of the exceptional ability of wetlands, natural or constructed, to remove nutrients associated with, for example, agricultural runoff.24–29 The nutrient retention rates of wetlands exceed the runoff rates documented in this study (Table 1) by several orders of magnitude. Typical nitrate (as N) and total phosphorus wetland retention rates vary from 3000 to 285000 kg N km–2 yr–1 and 100–71 000 kg P km–2 yr–1.29 This extraordinary ability of wetlands to retain nutrients plays a critical role in the regulation and lowering of dissolved nitrogen and phosphorus levels in freshwater ecosystems, as well as in the prevention of groundwater contamination. At the same time, wetland destruction will, not can, result in dramatic nutrient enrichment of the freshwater systems they feed into, resulting in enhanced eutrophication, reduced water quality and accelerated loss of biodiversity. The implementation of environmental legislation meant to protect wetlands is critical and will have widespread, beneficial consequences.
The study would not have been possible without the very generous provision of water quality data by the Department of Water Affairs and Forestry. Feedback on an early draft of the manuscript by Susan Taljaard and Pierre de Villiers is much appreciated. This is AEON contribution number 42. Funding was provided by a grant from the NRF (GUN FA2005032300019).
1. Vitousek P.M., Aber J.D., Howarth R.W., Likens G.E., Matson P.A., Schindler D.W. et al. (1997). Human alteration of the global nitrogen cycle: sources and consequences. Ecol. Appl. 7, 737–750. [ Links ]
2. Carpenter S.R., Caraco N.F., Correll D.L., Howarth R.W., Sharpley A.N. and Smith V.H. (1998). Nonpoint pollution of surface waters with phosphorus and nitrogen. Ecol. Appl. 8, 559–568. [ Links ]
3. Howarth R.W., Anderson D., Cloern J., Elfring C., Hopkinson C., Lapointe B. et al. (2000). Nutrient pollution of coastal rivers, bays, and seas. Iss. Ecol. 7, 1–15. [ Links ]
4. Galloway J.N. and Cowling E.B. (2002). Reactive nitrogen and the world: 200 years of change. Ambio 31, 64–71. [ Links ]
5. Camargo J.A. and Alonso A. (2006). Ecological and toxicological effects of inorganic nitrogen pollution in aquatic ecosystems: a global assessment. Environ. Int. 32, 831–849. [ Links ]
6. Mainstone C.P. and Parr W. (2002) Phosphorus in rivers – ecology and management. Sci. Tot. Environ. 282–283, 25–47. [ Links ]
7. Rabalais N.N. (2002). Nitrogen in aquatic ecosystems. Ambio 31, 102–112. [ Links ]
8. Department of Water Affairs and Forestry (2002). National Eutrophication Monitoring Programme: Implementation Manual. Pretoria. [ Links ]
9. Department of Water Affairs and Forestry (1996). South African Water Quality Guidelines, vol. 8. Field Guide. Pretoria. [ Links ]
10. World Commission on Dams. Orange River Development Project, South Africa. Case study prepared as an input to the World Commission on Dams, Cape Town. Online: www.dams.org [ Links ]
11. Sen A. and Srivastava M. (1990). Regression Analysis, Theory, Methods and Applications. Springer-Verlag, New York. [ Links ]
12. Neter J., Kutner M.H., Nachtsheim C.J. and Wasserman W. (1996). Applied Linear Statistical Models. McGraw-Hill, New York. [ Links ]
13. Camargo J.A., Alonso A. and Salamanca A. (2005). Nitrate toxicity to aquatic animals: a review with new data for freshwater invertebrates. Chemosphere 58, 1255–1267. [ Links ]
14. Canadian Council of Ministers of the Environment (2003). Canadian water quality guidelines for the protection of aquatic life: nitrate ion. CCMI, Winnipeg. [ Links ]
15. Constable M., Charlton M., Jensen F., McDonald K., Craig G. and Taylor K.W. (2003). An ecological risk assessment of ammonia in the aquatic environment. Hum. Ecol. Risk Assess. 9, 527–548. [ Links ]
16. Environment Canada (2001). Priority substances assessment report: ammonia in the aquatic environment. Minister of Public Works and Government Services Canada, Ottowa. [ Links ]
17. Environmental Protection Agency (1986). Quality criteria for water, 440/5-86001; (1999) Update of ambient water quality criteria for ammonia, 822/R-99-014. Washington, D.C. [ Links ]
18. Swedish EPA. Environmental quality criteria: coasts and seas (2000). Report 5052. Stockholm. [ Links ]
19. Henao J. and Baanante C. (1999). Nutrient depletion in the agricultural soils of Africa. 2020 Brief No. 62. Online: www.ifpri.org/2020/briefs/number62.htm [ Links ]
20. Räike A., Pietiläinen O-P., Rekolainen S., Kauppila P. et al. (2003). Trends of phosphorus, nitrogen and chlorophyll a concentrations in Finnish rivers and lakes in 1975–2000. Sci. Tot. Environ. 310, 47–59. [ Links ]
21. Granlund K., Räike A., Ekholm P., Rankinen K. and Rekolainen S. (2005). Assessment of water protection targets for agricultural nutrient loading in Finland. J. Hydrol. 304, 251–260. [ Links ]
22. Bationo A., Lompo F. and Koala S. (1998). Research on nutrient flows and balances in west Africa: state-of-the-art. Agric. Ecosyst. Environ. 71, 19–35. [ Links ]
23. Nandwa S.M. and Bekunda M.A. (1998). Research on nutrient flows and balances in East and Southern Africa: state-of-the-art. Agric. Ecosyst. Environ. 71, 5–18. [ Links ]
24. Reed S.C., Middlebrooks E.J. and Crites R.W. (1988). Natural Systems for Wastewater Management and Treatment. McGraw-Hill, New York. [ Links ]
25. Kovacic D.A., Gentry M.B. and Lowell E. (2000). Effectiveness of constructed wetlands in reducing nitrogen and phosphorus export from agricultural tile drainage. J. Environ. Qual. 29, 1262–1274. [ Links ]
26. Hammer D.A. (1992). Designing constructed wetlands systems to treat agricultural non-point source pollution. Ecol. Engng 1, 49–82. [ Links ]
27. Comin F.A., Romero J.A., Astorga V. and Garcia C. (1997). Nitrogen removal and cycling in restored wetlands used as filters of nutrients for agricultural run-off. Water Sci. Technol. 33, 225–261. [ Links ]
28. Arheimer B. and Wittgren H. (1995). Modeling the effects of wetlands on regional nitrogen transport. Am. Biol. 23, 378–386. [ Links ]
29. Fink D.F. and Mitch W.J. (2004). Seasonal and storm event nutrient removal by a created wetland in an agricultural watershed. Ecol. Engng 23, 313–325. [ Links ]
Received 2 October 2006. Accepted 15 August 2007.
This article is accompanied by supplementary material online at www.sajs.co.za
* Author for correspondence. E-mail: steph@sun.ac.za
Supplementary material to:
de Villiers S. and Thiart C. (2007). The nutrient status of South African rivers: concentrations, trends and fluxes from the 1970s to 2005. S. Afr. J. Sci. 103, 343–349.
