


Serviços Personalizados
Artigo
 Inglês (pdf)
 Artigo em XML
 Referências do artigo
Indicadores

Links relacionados
-
 Citado por Google
 -
 Similares em Google
Compartilhar

 Permalink
South African Journal of Science
versão On-line ISSN 1996-7489
versão impressa ISSN 0038-2353
S. Afr. j. sci. vol.103 no.7-8 Pretoria Jul./Ago. 2007
SAEON REVIEWS
Long-term measurements of sulphur dioxide, nitrogen dioxide, ammonia, nitric acid and ozone in southern Africa using passive samplers
J.J. MartinsI; R.S. DhammapalaI; G. LachmannI; C. Galy-LacauxII; J.J. PienaarI, *
ISchool of Chemistry, North-West University, Potchefstroom Campus, Private Bag X6001, Potchefstroom 2520, South Africa
IILaboratoire d'Aérologie, 14 Avenue Edouard Belin, Toulouse 31400, France
ABSTRACT
This paper reports the measurements of monthly mean gaseous sulphur dioxide, nitrogen dioxide, ammonia, nitric acid and ozone at four remote sites—Louis Trichardt (South Africa), Cape Point (South Africa), Amersfoort (South Africa) and Okaukuejo (Namibia)— in southern Africa, over a period of nine to 11 years, using passive samplers. The 10-year mean sulphur dioxide concentrations varied from 0.43 parts per billion (ppb) at Okaukuejo to 2.8 ppb at Amersfoort. Nitrogen dioxide varied from 0.34 ppb at Okaukuejo to 2.5 ppb at Amersfoort, nitric acid from 0.23 ppb at Louis Trichardt to 0.90 ppb at Amersfoort, and ammonia from 1.2 ppb at Amersfoort to 1.5 ppb at Cape Point. Ozone exhibited a fairly constant high mean value of about 27 ppb throughout the region except for the Louis Trichardt site, with a relatively high 10-year mean of 35 ppb. The annual concentrations of all chemical species measured decreased from 1995 to 2001, after which they increased slightly. The large amounts of biofuels that are combusted on the continent, mainly in winter, substantially influence the concentrations of all measured species. The seasonal concentrations of all the gases seem to peak in winter and spring at all sites, except for ammonia at Cape Point and Okaukuejo, and sulphur dioxide at Cape Point, which peaks during the summer. Strong inter-annual variations were observed that prove the scientific value of decision-making based on long-term observations.
Introduction
Long-term air pollution measurements play a critical role in assessing the impact of the evolution and the sustainability of ecosystems. This information is needed to improve our understanding of the behaviour of the atmosphere and its interactions with the biosphere.1 The chemical content of atmospheric deposition is the product of numerous physical and chemical mechanisms that include emission, transport, chemical reactions and removal processes. The long-term study of deposition of atmospheric species consequently enables tracking the temporal and spatial evolution of atmospheric chemistry, and is a pertinent indicator of natural and anthropogenic influences.
Pressures of costs and changing priorities make it difficult to maintain and expand long-term measurement programmes. Passive (or diffusive) samplers, one of the tools of modern atmospheric chemistry research,2–4 present a means of addressing these types of measurements in that they provide a cost-effective way of monitoring many key pollutant species. These samplers were tested and used in the Deposition of Biogeochemically Important Trace Species (DEBITS) programme of the International Global Atmospheric Chemistry (IGAC) and the World Meteorological Organisation's Global Atmospheric Watch (WMO-GAW) programme, to assess dry deposition of these chemical types.1,2 The samplers are small, lightweight, silent, do not require electricity or field calibration, and can easily be deployed by non-specialists. As a result, they can be used to obtain long-term measurements at rural, regional and global scales.
Nitrogen and sulphur are some of the key elements that influence productivity in the biosphere.5 The deposition of their compounds is thus important in atmospheric studies. Due to the availability of passive samplers capable of measuring atmospheric sulphur dioxide (SO2), nitrogen dioxide (NO2), ammonia (NH3) and nitric acid (HNO3) concentrations, these compounds were included in the scope of DEBITS measurements.1 As the atmospheric chemistry of ozone (O3) is closely linked to that of several sulphur and nitrogen containing species, ozone measurements were also included.
The purpose of this paper is to report, for the first time, a 10-year data series of SO2,NO2,NH3,O3 and HNO3 concentrations at four remote sites in southern Africa. The findings reported here cover the period 1995 to 2005 and can be used in deposition modelling and impact assessment studies.
Sampling network
Passive samplers were deployed at four sampling locations (see Table 1). The gases SO2,NO2,O3 and NH3 were monitored from the start at all sites, and HNO3 monitoring was begun in May 2003. The Ministry of Environment and Tourism based in Windhoek, Namibia, was instrumental in setting up the Okaukuejo site and arranged for an official from the Etosha Ecological Institute to perform the routine work involved. The site is situated approximately 500 m west of the large Etosha salt pan, which is nearly always dry, and about 1 km from the nearest tourist road. The site is surrounded by small, vegetated sand hummocks. Very few people, vehicles or animals approach it.

The Louis Trichardt site is situated on a private farm, on the edge of an escarpment, about 20 km outside the town's main business centre. Although semi-arid locations are situated just a few kilometres away, this site is in a subtropical region affected by moist air masses transported from the Mozambique Channel. A third site is located 15 km from the town of Amersfoort on a private farm in the south of Mpumalanga province. Downwind of the Gauteng region and major power and petrochemical plants, it represents a regional location but one that lies within a global hot-spot in terms of satellite observations of SO2 and NO2 concentrations.6
The three locations mentioned above were identified as IGAC-DEBITS-IDAF programme sites, whereas Cape Point has been included by the WMO as a GAW coastal background site in the southern hemisphere. It is located at one of the southernmost points on the African continent.
Passive sampling
The theory and development of diffusive samplers have been described elsewhere.7–11 Briefly, pollutants diffuse into the samplers at rates controlled by their respective diffusion coefficients. Each pollutant then undergoes a chemical reaction on the surface of a paper disk, which has previously been impregnated with a chemical capable of reacting specifically with it.7,9,10 The samplers were prepared at North-West University and sealed in plastic film containers before being mailed to the site operators. The samplers were mounted 1.5 m above ground level in specially manufactured holders to curb any natural interference with the sampling process. After one month's exposure, the samplers were returned to the university in the sealed film containers for analysis.
Quality assurance and quality control
Data reported in this paper were collected using passive samplers developed and tested under the IGAC-DEBITS programme, as well as in various international studies.2 Passive sampler performance was compared in a field campaign using samplers that were assembled and analysed at the IVL (an accredited lab in Sweden) and CSIRO (Australia). Good correlations were obtained in these inter-comparison studies.7 The results of passive sampling were also compared with those of calibrated active samplers at Eskom's Elandsfontein site (for SO2,NO2 and O3) and at the WMO GAW site at Cape Point (for O3 and, since 2005, SO2).12 The performance of the NH3 sampler was checked against a calibrated active sampler in the Vaal Triangle.13 In the comparison studies with active samplers, it was found that small correction factors need to be incorporated for NO2 and O3. It was also found that NH3 samples have to be analysed within a month after exposure.
A field blank was included with each set of samplers deployed. Detection limits for each trace gas were calculated from field blanks and found to be 0.1 parts per billion (ppb) for SO2, 0.05 ppb for NO2, 0.2 ppb for NH3, 0.6 ppb for O3 and 0.1 ppb for HNO3, when averaged over a month. Only data above detection limits are reported in what follows.
All samples were collected in duplicate and their average was used in all computations, except when contamination of one of the samples was suspected (this was evident in less than 5% of all data). The covariance of all duplicate samples (a measure of precision) was 16.6%, 20%, 2.4%, 15.3% and 8.3% for SO2, HNO3, O3,NH3andNO2,respectively.These covariancescomparewell with those reported by the IDAF laboratory at the Laboratoire d'Aérology in Toulouse, France, for the same pollutants (17.4%, 28.9%, 7.9%, 14.6% and 3.7%, for SO2, HNO3,O3,NH3 and NO2, respectively).
The outcome of the above QA/QC measures suggests that sampling and analytical protocols employed here are viable means of obtaining atmospheric data at remote sites.
Results and discussion
Table 2 shows the average concentrations of all gases monitored from 1995 to 2005, as well as the number of duplicate samples above detection limits. The high NO2 and SO2 concentrations for Amersfoort compared with the other sites are because it is downwind of nearby industrial sources for much of the time.14 The high ozone concentrations observed at Louis Trichardt have been confirmed by modelling studies15 and are probably due to ozone precursors from regional biomass burning.
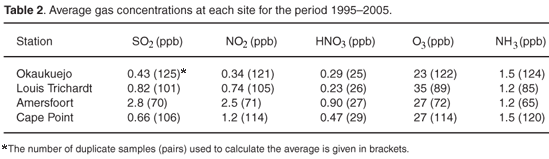
The role of NH3 and SO2 in aerosol formation is widely recognized.2,16 The NH3/SO2 ratios of 3.49, 1.46 and 2.73 were observed at Okaukuejo, Louis Trichardt and Cape Point, respectively, whereas a ratio of 0.42 was observed at Amersfoort. While differences in these ratios are mostly SO2-driven, they are relatively close to values reported by Carmichael et al.2 for Cape Point (ratio 3.3) and Elandsfontein (0.3) in 1999–2000. The same authors also report higher NH3/SO2 ratios for several other background sites in Africa, but the differences stem mainly from lower SO2 concentrations. The higher background SO2 levels in southern Africa are a consequence of industrial activities and coal-fired power plants in South Africa.
Annual averages
Summaries of annual minimum, mean, median and maximum concentrations for each pollutant except HNO3 at all sites over the sampling period are presented in Figs 1–4. Figure 1 shows that the SO2 annual mean concentration at Amersfoort decreased from 3.6 ppb in 1997 to 1.7 ppb in 2004. Inter-annual variations are also evident, however, in that 3.0 and 4.5 ppb was observed during 2002 and 2005, respectively. For the Cape Point site, the SO2 mean annual concentration (<1 ppb) showed little variation between 1995 and 2005, except in 2002 and 2005, when values of 1.3 and 1.2 ppb were observed. The Okaukuejo and Louis Trichardt sites show a slight constant decline for the SO2 mean annual concentration and are all below 1 ppb for the period 1995–2003, except for 1998 for Louis Trichardt, when the value was 1.8 ppb. The SO2 concentrations for Louis Trichardt and Okaukuejo increased slightly from 2003.

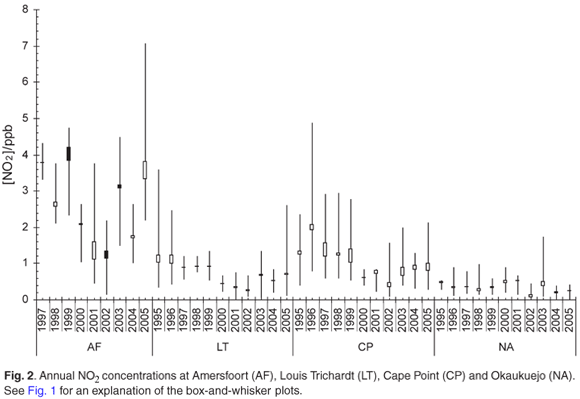


The mean annual NO2 concentrations at Amersfoort (Fig. 2) decreased from 3.8 ppb in 1997 to 1.2 ppb in 2002, and increased again to 3.8 ppb. The NO2 mean annual concentration at Cape Point decreased from 2.1 ppb in 1996 to 0.5 ppb in 2002 and then increased again to 0.8 ppb in 2005. The NO2 concentration at Louis Trichardt decreased from 1.2 ppb in 1996 to 0.3 ppb in 2002 and then increased to 0.8 ppb in 2005. The NO2 annual mean concentration at Okaukuejo was constant and under 0.6 ppb for the entire study period.
The annual mean HNO3 concentrations (see Table 2, data not shown in figures as only two years of data are currently available) increased at the Amersfoort site. At Louis Trichardt, the value seems to increase slightly whereas the concentrations at the Okaukuejo site appeared to stay relatively constant. The mean values at Cape Point were constant at 0.5 ppb for the last two years.
The annual mean O3 concentration in Fig. 3 for all the sites steadily decreased from 1994 to 2001, after which it increased. This tendency is especially evident in the data obtained at Cape Point and Louis Trichardt. A similar profile over this period was observed for these two and (to a lesser extent) the Amersfoort and Okaukuejo sites.
The annual mean concentration of NH3 at Cape Point, Louis Trichardt and Okaukuejo increased during the first four years (1995–98) and then decreased until 2005 for all three sites, except for 1999 and 2000 at Cape Point (Fig. 4). At the Amersfoort site, the annual mean NH3 concentration decreased from 2.0 ppb in 1999 to 0.5 ppb in 2005.
Monthly averages
Summaries of monthly minimum, mean, median and maximum concentrations for each pollutant except HNO3 at all sites over the sampling period are shown in Figs 5–8. The monthly mean SO2 concentrations were a maximum for Amersfoort, Louis Trichardt and, to a lesser extent, Okaukuejo during the dry winter and early spring months of June to October. The reverse was observed at the Cape Point site, where the maximum SO2 concentrations are recorded from January to April. The higher values during winter are probably linked to both increased emissions during the lower temperatures (resulting in increased energy use) as well as the stable atmospheric conditions experienced during the winter months. The Cape Point station is situated in a winter rainfall region and there the SO2 maximum was observed during the dry summer months.


The monthly mean NO2 concentrations show a clear seasonal signal at all the SouthAfrican sites (Fig. 6). TheOkaukuejo site (in Namibia) seems to be the exception, where more-constant NO2 values throughout the year were observed. The early spring maximum in NO2 concentrations at the South African sites may be linked to biogenic activity, as it marks the start of the growing season. The NO2 concentrations begin to rise a little earlier than at the inland sites because of enhanced biogenic activity in this region during the winter months. High NO2 values at Amersfoort are indicative of the anthropogenic contribution from the Mpumalanga highveld.
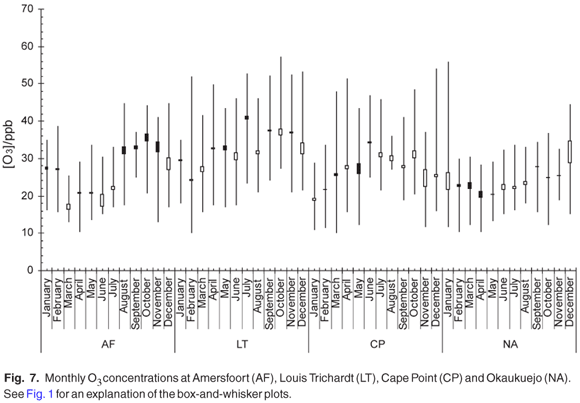
The clear spring and early summer maximum was observed for the monthly mean O3 concentrations at Amersfoort, Louis Trichardt and Cape Point, whereas the maximum O3 concentrations were observed from January to December at Okaukuejo (Fig. 7). The O3 maximum shows, as expected, a direct relation with the NO2 maximum, which is one of the precursors for the photochemical production of ozone. Although the reason that low O3 levels with little variability were observed at Okaukuejo is unknown at this stage, Carmichael et al.2 reported O3 concentrations as low as 7 ppb at a background site in the Ivory Coast.
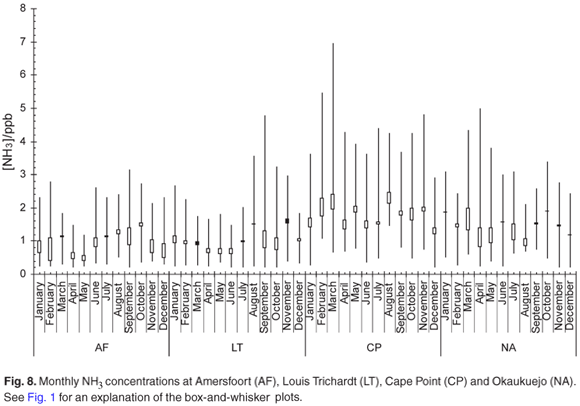
The monthly mean NH3 concentration (Fig. 8) increased during the stable winter months at Amersfoort. These slightly elevated levels are probably linked to a less effective removal process during this time of the year. It is known that NH3 is one of the pollutants emitted by industry in this region. The relatively high NH3 values observed at Cape Point could be linked to the high density of nesting birds around the site. The monthly mean NH3 concentration at Okaukuejo remains relative constant throughout the year. We note that the NH3 maximum was observed at exactly the same time as for HNO3.
Conclusions
The gaseous concentrations of SO2,NO2, HNO3,NH3 and O3 were measured on a monthly basis at four regional sites in southern Africa over several years. The monthly SO2 concentrations ranged from 0.2 ppb (at the rural sites of Louis Trichardt and Okaukuejo) to 6.3 ppb (industrial site of Amersfoort). Monthly NO2 concentrations ranged from 0.2 ppb (Louis Trichardt and Okaukuejo) to 7.1 ppb (Amersfoort). The mean SO2 concentration over the period 1994–2005 was below 1.0 ppb for all the stations except Amersfoort, which had a concentration of 2.8 ppb. The mean NO2 concentration over the same period was below 1.5 ppb for all the stations except Amersfoort, where a concentration of 2.5 ppb was observed. The NH3 concentrations ranged from 0.4 ppb (Amersfoort) to 7.2 ppb at Cape Point, whereas the O3 concentrations ranged from 10 ppb (Amersfoort) to 57 ppb at Louis Trichardt. The mean HNO3 concentrations were below 1.0 ppb for the study period, and ranged from 0.2 ppb at Louis Trichardt to 2.5 ppb at Amersfoort. The relatively large fluctuations in the Amersfoort data set are probably due to the direct influence of industrial pollution plumes at this site. The relatively large spatial differences clearly indicate the anthropogenic effect on the chemical species recorded in the atmosphere of the region.
We gratefully acknowledge the financial supported of Eskom Enterprises, Sasol Research and Development, the National Research Foundation, the Department of Science and Technology and North-West University. Monitoring of all these chemical species is still continuing at these sites as part of the DEBITS network with the following personnel as site operators: Wilfred Winfred (Okaukuejo), Chris James (Louis Trichardt), Memory Deacon (Amersfoort) and Ernst Brunke (Cape Point).
1. Pienaar J.J. (2005). DEBITS (Deposition of Biogeochemically Important Trace Species) enter Phase II as an IGAC task. IGACtivities Newsl. 31, 13–17. [ Links ]
2. Carmichael G.R., Ferm M., Thongboonchoo N. and Jung-Hun W. et al. (2003). Measurements of sulfur dioxide, ozone and ammonia concentrations in Asia, Africa, and South America using passive samplers. Atmos. Environ. 37, 1293–1308. [ Links ]
3. Ayers G.P., Keywood M.D., Gillet R.W., Manins P.C., Malfroy H. and Bardsley T. (1998). Validation of passive diffusion samplers for SO2 and NO2. Atmos. Environ. 32, 3587–3592. [ Links ]
4. Ferm M. and Svanberg P.A. (1998). Cost-efficient techniques for urban-and background measurements of SO2 and NO2. Atmos. Environ. 32, 1377–1381. [ Links ]
5. Ashmore M., Emberson L. and Murray F. (Eds) (2003). In Air Pollution Impacts on Crops and Forests – A Global Assessment. Air Pollution Reviews, vol. 4. Imperial College Press, London. [ Links ]
6. Jaegle L., Steinberger L., Martin R.V. and Chance K. (2005). Global partitioning of NOx sources using satellite observations: relative roles of fossil fuel combustion, biomass burning and soil emission. Faraday Disc. 130, 407–423. [ Links ]
7. Dhammapala R. (1996). Use of passive samplers for the sampling of atmospheric pollutants. M.Sc. thesis, Potchefstroom University for CHE, South Africa. [ Links ]
8. Palmes E.D. and Gunnison A.F. (1973). Personal monitoring device for gaseous contaminants. Am. Ind. Hygiene Assoc. J. 34, 78–81. [ Links ]
9. Ferm M. (1991). A sensitive diffusional sampler. IVL publication B-1020, Swedish Environmental Research Institute, Box 47086, 402 58 Goteborg, Sweden. [ Links ]
10. Koutrakis P., Wolfson J.M., Bunyaviroch A., Froehlich S.E., Hirano K. and Mulik J.D. (1993). Measurement of ambient ozone using a nitrite-coated filter. Anal. Chem. 65, 209–214. [ Links ]
11. Ferm M. (2001). The theories behind diffusive sampling. In Proc. International Conference on Measuring Air Pollutants by Diffusive Sampling, pp. 31–40, Montpellier, France. [ Links ]
12. Pienaar J.J. and Julies A.P. (2001). Present status and performance of passive samplers – theoretical considerations. In Proc. Air Quality Workshop, African Centre for Energy and Environment, Warmbaths, South Africa. [ Links ]
13. van der Walt H.J., du Toit P., Julies A.P. and Pienaar J.J. (1998). Integration of passive samplers into a modern ambient air quality monitoring network. In Proc. 11th World Clean Air and Environment Congress and Exhibition, Durban. [ Links ]
14. Held G., Gore B.J., Surridge A.D., Tosen G.R., Turner C.R. and Walmsley R.D. (1996). Chemical transformations of atmospheric pollutants. In Air Pollution and its Impacts on the South African Highveld. Environmental Scientific Association, Cleveland, Johannesburg. [ Links ]
15. Zunckel M., Koosailee A., Yarwood G., Maure G., Venjonoka K., van Tienhoven A.M. and Otter L. (2006). Modelled surface ozone over southern Africa during the Cross Border Air Pollution Impact Assessment Project. Environmental Modelling & Software 21(7), 911–924. [ Links ]
16. Carmichael G.R., Street D.G., Calori G., Amann M., Jacobson M.Z., Hansen J. and Ueda H. (2002). Changing trends in sulfur emissions is Asia: implications for acid deposition, air pollution and climate. Environ. Sci. Technol. 36(22), 4707–4713. [ Links ]
* Author for correspondence. kobus.pienaar@nwu.ac.za

