


Serviços Personalizados
Artigo
 Inglês (pdf)
 Artigo em XML
 Referências do artigo
Indicadores

Links relacionados
-
 Citado por Google
 -
 Similares em Google
Compartilhar

 Permalink
Onderstepoort Journal of Veterinary Research
versão On-line ISSN 2219-0635
versão impressa ISSN 0030-2465
Onderstepoort j. vet. res. vol.81 no.2 Pretoria Fev. 2014
PROCEEDINGS
Mobile technologies for disease surveillance in humans and animals
Mpoki MwabukusiI; Esron D. KarimuriboI, II; Mark M. RweyemamuI; Eric BedaI
ISouthern African Centre for Infectious Disease Surveillance, Tanzania
IISokoine University of Agriculture, Department of Veterinary Medicine and Public Health, Tanzania
ABSTRACT
A paper-based disease reporting system has been associated with a number of challenges. These include difficulties to submit hard copies of the disease surveillance forms because of poor road infrastructure, weather conditions or challenging terrain, particularly in the developing countries. The system demands re-entry of the data at data processing and analysis points, thus making it prone to introduction of errors during this process. All these challenges contribute to delayed acquisition, processing and response to disease events occurring in remote hard to reach areas. Our study piloted the use of mobile phones in order to transmit near to real-time data from remote districts in Tanzania (Ngorongoro and Ngara), Burundi (Muyinga) and Zambia (Kazungula and Sesheke). Two technologies namely, digital and short messaging services were used to capture and transmit disease event data in the animal and human health sectors in the study areas based on a server-client model. Smart phones running the Android operating system (minimum required version: Android 1.6), and which supported open source application, Epicollect, as well as the Open Data Kit application, were used in the study. These phones allowed collection of geo-tagged data, with the opportunity of including static and moving images related to disease events. The project supported routine disease surveillance systems in the ministries responsible for animal and human health in Burundi, Tanzania and Zambia, as well as data collection for researchers at the Sokoine University of Agriculture, Tanzania. During the project implementation period between 2011 and 2013, a total number of 1651 diseases event-related forms were submitted, which allowed reporters to include GPS coordinates and photographs related to the events captured. It was concluded that the new technology-based surveillance system is useful in providing near to real-time data, with potential for enhancing timely response in rural remote areas of Africa. We recommended adoption of the proven technologies to improve disease surveillance, particularly in the developing countries.
Introduction
The use of mobile and wireless technologies to support the achievement of health objectives (i.e. mHealth) has the potential to transform the face of health service delivery across the globe. A powerful combination of factors is driving this change. These include rapid advances in mobile technologies and applications, a rise in new opportunities for the integration of mobile health into existing eHealth services and the continued growth in coverage of mobile cellular networks (Vital Wave Consulting 2009).
The ability to collect data is the key to the success of many organisations operating in the developing world. Given the weaknesses of current tools and the surge in mobile phone growth, there is an opportunity for mobile and cloud technologies to enable timely and efficient data collection and thus change how healthcare is delivered to millions of people (Anokwa et al. 2009).
Smart phones offer PC-like functionality and web connectivity far superior to traditional mobile phones. Built-in global positioning system (GPS) receivers provide the detailed location of the phone, accelerometers can recognise changes in movement and cameras provide the ability to record static images as well as video. Data networks allow built-in software to access the Internet, providing access to web browsing, email, mapping (such as Google Maps) and the viewing and editing of office documents using touch screen keyboards (or hardware keyboards) for textual input (Aanensen et al. 2009).
The aim of this paper is to discuss and share the implementation and outcomes of a mobile technologies project introduced by the Southern African Centre for Infectious Disease Surveillance (SACIDS), with the goal of improving disease surveillance in animal and human health sectors.
Research method and design
Case study sites
The study was conducted in different ecosystems characterised by interaction between humans and domestic and wild animals (Ngorongoro and Kibaha districts in Tanzania), or cross-border districts shared by neighbouring countries such as Ngara (Tanzania) and Muyinga (Burundi) and the Zambezi River Basin ecosystem districts in Zambia (Sesheke and Kazungula), bordering Zimbabwe, Namibia and Botswana. In this kind of environment, the chance of contracting and spreading infectious diseases is very high.
Implementation
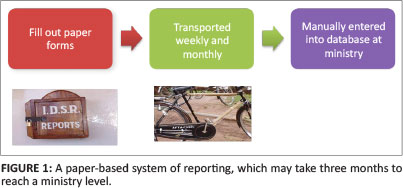
Selection of suitable technology (over a paper-based system of reporting - Figure 1) and designing processes were carried out after a rapid situation analysis to assess existing surveillance systems in animal and human health in May 2010, in order to understand the structure and requirements of surveillance systems in the animal and human health sectors in Tanzania (Karimuribo et al. 2012).
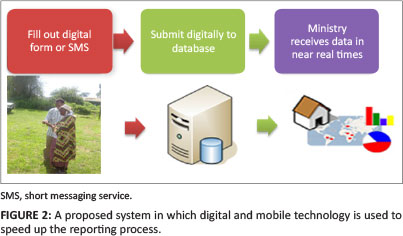
The two chosen technologies (digital forms and short messaging services [SMS] - Figure 2) were based on a server-client model (Figure 3), wherein a mobile phone or personal computer operates as a client, communicating directly to the server via an Internet connection, or SMS via the global system for mobile communications (GSM) network. The server then stores all collected data from the field using mobile phones or personal computers and provides users access to the data via an integrated web-interface (SMS and digital forms data can be accessed via the same interface).
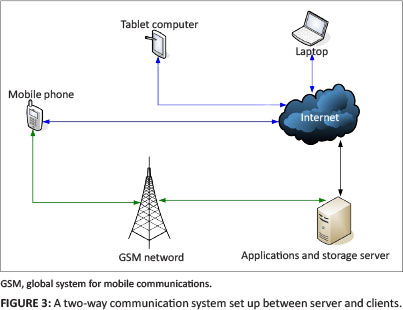
The server-client model can be described with three functional components: (1) data collection - referred as hardware devices and software combinations that enable surveillance data to be submitted to a central database, (2) data aggregation - a central server for hosting collected and sent or synchronised data. For each data collection technology (SMS and digital form) there is an intermediary tool for receiving and placing data in the common database and (3) data visualisation and management - a web application that acts as interface between the database and user so as to simplify data management and analysis with the following capabilities: inputting data the web, providing map representation of geo-tagged data, viewing images and downloading data in Excel format for further analysis
One of the factors we considered before implementation was to use a cost-effective technology. Open Source technology was chosen, not only because it is cost-effective, but also because it has a wide community of developers, which gives us a wide area for improving the system in the future and the capability of deploying this in different languages for the end user.
Open source technology is defined as the production and development philosophy of allowing end users and developers to not only see the source code of software, but modify it as well. (Garger & Lamar 2010)
Digital forms framework
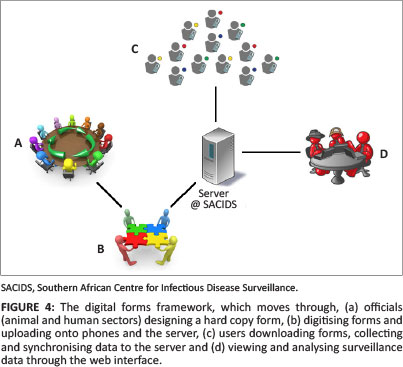
First of all, the forms or questionnaires are prepared by officials related to the field (animal or human health) in hard copy format before being transferred to a digital format. Following the digitisation process, they are uploaded onto mobile phones and the server. Users can then download new forms, collect and synchronise data to the server. Finally, through a web interface, data can be viewed and analysed (Figure 4).
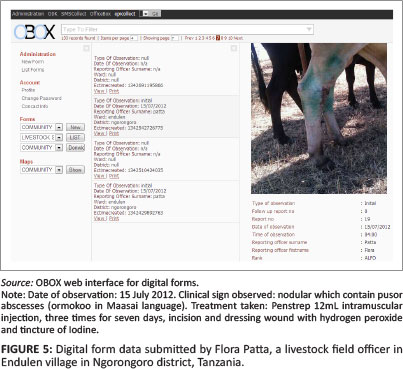
Only authorised users provided with an account (username and password) can access the data via the web interface in different levels. On top of that, the web interface has the capability of viewing images and maps, which can result in a quick response in case of outbreak. On the left pane of the web interface (Figure 5) there are four sections. Firstly is 'Administration', which will only be visible to administrators. Secondly is 'Account', where the users' password and profile can be edited. Thirdly is 'Forms', where a form can be chosen to be filled out using the web interface through the 'New' button, listing submitted data through 'List' button and downloading data in an Excel format through the 'Download' button for further analysis. Lastly there is 'Maps', on which, through the 'Show' button, you will be able to view a map that represents the geo-tagged data submitted. The middle pane lists a few details of the data submitted and by clicking on the 'View' button, a full list will be shown on the right pane, as seen in Figure 5. Data can also be printed using a 'Print' button.
Tools used to implement the digital forms
The primary tools used were smart phones (Android version 2.3.5 - minimum required version is 1.6), a data server with Ubuntu version 10.0.4.1 and the data collection applications, EpiCollect and Open Data Kit. The two data applications follow the three model components mentioned above (data collection, data aggregate and data visualisation and management). The project adopted the data collection aspect without any changes, whereby applications are installed in smart phones and digitised forms uploaded into applications. The data aggregation, visualisation and management aspects were customised by the SACIDS information communication technology (ICT) team from the source code provided by the two applications. The results of customisation were two applications using the same database and data accessible via a single web interface.
SMS forms framework
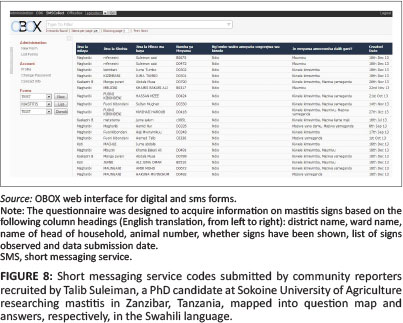
Kannel, an open source wireless application protocol and SMS gateway, was implemented to build the SMS application, whereby any phone with SMS capability can be used. Questions are designed to be answered in a code format (Figure 6 and Figure 7) and, at the back end, will be mapped to their respective answers in clear and simple language for easy readability via the web interface (Figure 8).
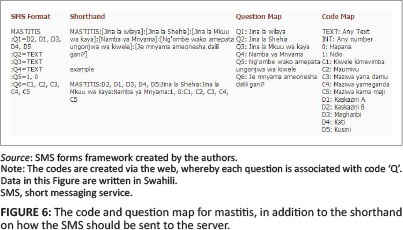
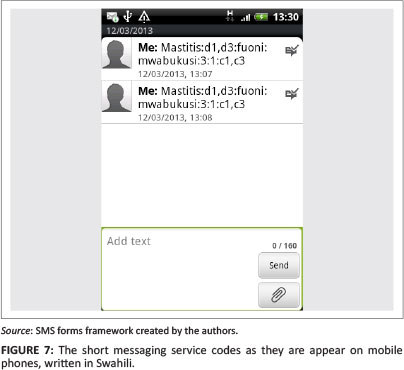
In Figure 6, in the 'Question Map' column, Q1-Q6 represents question numbers and questions were formulated using Swahili language. For multiple choice questions, the selections were also coded, for example, from the 'Code Map' column, 0 represents the word Hapana, which means 'No', 1 represent Ndio, which means 'Yes', C1-C5 represents signs observed and D1-D5 represents districts names. In the field, data reporters will be given a sheet of questions together with codes and an example of how SMS data is to be written. In the 'Shorthand' column in Figure 6 is an example that demonstrates the format: start with disease or form name, use a colon to separate one answer code from another and, for the multiple choice, use a comma to separate the selection codes. Figure 7 shows an example of SMS codes as they would appear when written and sent from a mobile phone.
This SMS application was officially rolled out at the end of 2013 for use by a PhD student, Talib Suleiman, from the Sokoine University of Agriculture in Tanzania for collecting mastitis data in Zanzibar and Rift Valley fever data in Ngorongoro.
Tools used to implement the SMS forms
The primary tools used were any phone capable of sending SMS, the same data server used for the digital forms and the Kannel application, which was then customised by SACIDS ICT team using the provided source code by Kannel community to build an application termed SMScollect. We also used a modem that acted as an SMS receiver. This modem connected to the server through software configurations in the server. SMS's sent by phones to the modem number are transferred directly from the modem to the server database to be converted into an easily readable format via the web interface.
Results
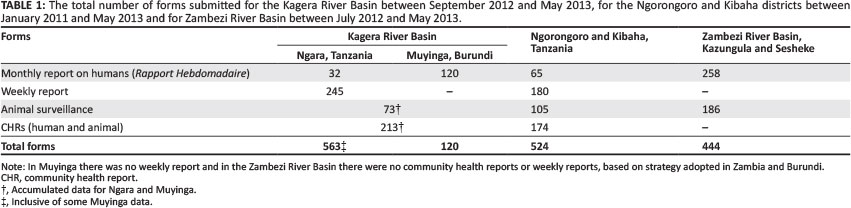
Table 1 summarises the data collected via digital forms technology from January 2011 to May 2013 for the Ngorongoro and Kibaha Districts and from September 2012 to May 2013 for the Kagera River Basin (Ngara and Muyinga Districts). A total of four forms were used: animal disease surveillance, community health report for human and animals, and monthly and weekly reports for humans. Table 1 indicates a good number of data reported compared with the few mobile phones that were distributed in study areas: Kagera River Basin (27 phones), Ngorongoro (27 phones) and Kibaha (7 phones).
Discussion
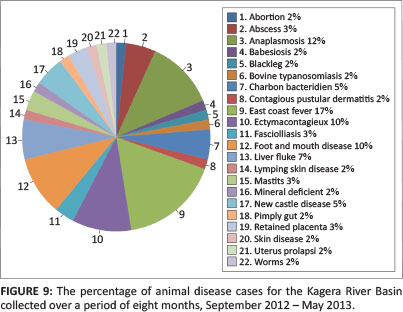
Through the use of this new digital and SMS forms technology, officials from human and animal health have been able to conduct follow ups on disease cases more easily than before. As all data are sent in a digital format directly to the database, they can be accessed, downloaded in Excel format and analysed within a very short time. The ability of downloading data in Excel for further analysis has been useful for the district veterinary and medical officers in writing disease cases reports. Figure 9 shows a pie chart that represents animal disease surveillance data submitted by Kagera River Basin livestock field officers' via digital forms between September 2012 and May 2013. As data were submitted digitally, the stage in which data were entered manually into the database for analysis was skipped, potentially reducing the chance of human error affecting data capturing.
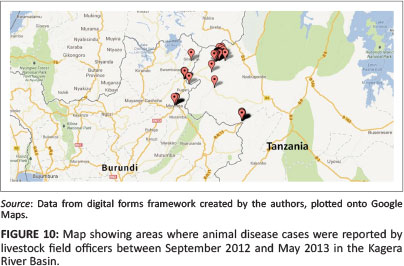
Using a map generated from GPS coordinates submitted directly from the field, areas where disease cases occurred can be easily located. For example, Figure 10 shows coordinates of data submitted by livestock field officers in the Kagera River Basin. The map shows that many cases occurred on the northern part of Ngara, Tanzania, where three countries - Tanzania, Burundi and Rwanda - meet. Here, livestock are being moved across the borders; there is also a livestock auction located around the area and a game reserve. With the combination of the abovementioned factors, the concentration of disease cases in this area is high.
Conclusion
This new reporting system has been able to help provide a quick response to some of the cases and has therefore been deemed a successful tool that should be implemented on a wider scale in the field. One example of its success was seen in early January 2013, when a Ngara district veterinary officer, Dr Richard Ngowi, managed to conduct a quick follow up after a number of reported foot-and-mouth disease (FMD) cases (Figure 9 shows a 10% prevalence of FMD over other diseases). As a result, on 04 February 2013, Dr Ngowi declared the district to be infected by FMD and under quarantine. The quarantine notice was subsequently posted to the SACIDS website (http://www.sacids.org/kms/frontend/?m=38).
Acknowledgements
The authors would like to acknowledge the support and cooperation we received from The Rockefeller Foundation (2009 DSN 305 Grant), the Ministries of Health and Social Welfare in Tanzania, Burundi and Zambia, the Ministries of Livestock in Tanzania, Burundi and Zambia, the Sokoine University of Agriculture, as the hosting institute, the University of Zambia as collaborating institute, as well as officials from Ngorongoro, Kibaha, Ngara and Muyinga districts, and the East African Integrated Disease Surveillance Network, Imperial College London (for providing initial implementation support).
Competing interests
The authors declare that they have no financial or personal relationships that may have inappropriately influenced them in writing this article.
Authors' contributions
M.M. (Southern African Centre for Infectious Disease Surveillance) was responsible in technology implementation and writing the manuscript. E.D.K. (Sokoine University of Agriculture) was the project leader and responsible for project design in epidemiology. M.M.R (Southern African Centre for Infectious Disease Surveillance) was the project principal investigator. E.B. (Southern African Centre for Infectious Disease Surveillance) was the project leader for the technological aspect, made contributions to the conceptual design of the overall information technology (IT) infrastructure framework and provided guidance in its implementation.
References
Aanensen, D.M., Huntley, D.M., Feil, E.J., Al-Own, F. & Spratt, B.G., 2009, 'EpiCollect: Linking smartphones to web applications for epidemiology, ecology and community data collection', PLoS ONE 4(9), e6968. http://dx.doi.org/10.1371/journal.pone.0006968 [ Links ]
Anokwa, Y., Hartung, C., Brunette, W., Borriello, G. & Lerer, A., 2009, 'Open source data collection in the developing world', Computer 42(10), 97-99. http://dx.doi.org/10.1109/MC.2009.328 [ Links ]
Garger, J. & Lamar, S., 2010, An introduction to open source technology, viewed 03 May 2013, from http://www.brighthub.com/computing/linux/articles/62137.aspx [ Links ]
Karimuribo, E.D., Sayalel, K., Beda, E., Short, N., Wambura, P., Mboera, L.G. et al., 2012, 'Towards one health disease surveillance: The Southern African Centre for Infectious Disease Surveillance approach', Onderstepoort Journal of Veterinary Research 79(2), Art. #454, 7 pages. http://dx.doi.org/10.4102/ojvr.v79i2.454 [ Links ]
Vital Wave Consulting, 2009, mHealth for development: The opportunity of mobile technology for healthcare in the developing world, UN Foundation - Vodafone Foundation Partnership, Washington, DC. [ Links ]
 Correspondence:
Mpoki Mwabukusi
PO Box 3297
Morogoro, Tanzania
mpokijs@gmail.com
Note: Proceedings of the 2nd One Health Conference in Africa. Jointly organised by the Southern African Centre for Infectious Disease Surveillance and the Tanzania National Institute for Medical Research, held at the Snow Crest Hotel in Arusha, Tanzania from 16th to 19th April 2013: http://www.sacids.org/kms/frontend/index.php?m=119.

