


Services on Demand
Article
 English (pdf)
 Article in xml format
 Article references
Indicators

Related links
-
 Cited by Google
 -
 Similars in Google
Share

 Permalink
Onderstepoort Journal of Veterinary Research
On-line version ISSN 2219-0635
Print version ISSN 0030-2465
Onderstepoort j. vet. res. vol.80 n.1 Pretoria Jan. 2013
ORIGINAL RESEARCH
Development of real-time reverse transcription polymerase chain reaction assays to quantify insulin-like growth factor receptor and insulin receptor expression in equine tissue
Stephen B. HughesI; Melvyn QuanII; Alan GuthrieIII; Martin SchulmanI
IDepartment of Production Animal Science, University of Pretoria, Onderstepoort, South Africa
IIDepartment of Veterinary Tropical Diseases, University of Pretoria, Onderstepoort, South Africa
IIIEquine Research Centre, University of Pretoria, Onderstepoort, South Africa
ABSTRACT
The insulin-like growth factor system (insulin-like growth factor 1, insulin-like growth factor 2, insulin-like growth factor 1 receptor, insulin-like growth factor 2 receptor and six insulinlike growth factor-binding proteins) and insulin are essential to muscle metabolism and most aspects of male and female reproduction. Insulin-like growth factor and insulin play important roles in the regulation of cell growth, differentiation and the maintenance of cell differentiation in mammals. In order to better understand the local factors that regulate equine physiology, such as muscle metabolism and reproduction (e.g., germ cell development and fertilisation), real-time reverse transcription polymerase chain reaction assays for quantification of equine insulin-like growth factor 1 receptor and insulin receptor messenger ribonucleic acid were developed. The assays were sensitive: 192 copies/µL and 891 copies/µL for insulin-like growth factor 1 receptor, messenger ribonucleic acid and insulin receptor respectively (95% limit of detection), and efficient: 1.01 for the insulin-like growth factor 1 receptor assay and 0.95 for the insulin receptor assay. The assays had a broad linear range of detection (seven logs for insulinlike growth factor 1 receptor and six logs for insulin receptor). This allowed for analysis of very small amounts of messenger ribonucleic acid. Low concentrations of both insulin-like growth factor 1 receptor and insulin receptor messenger ribonucleic acid were detected in endometrium, lung and spleen samples, whilst high concentrations were detected in heart, muscle and kidney samples, this was most likely due to the high level of glucose metabolism and glucose utilisation by these tissues. The assays developed for insulin-like growth factor 1 receptor and insulin receptor messenger ribonucleic acid expression have been shown to work on equine tissue and will contribute to the understanding of insulin and insulin-like growth factor 1 receptor physiology in the horse.
Introduction
Gene expression analysis is of fundamental importance in biomedical research (Bustin 2002). The various methods used include: Northern blotting, in situ hybridisation, ribonuclease (RNAse) protection assays, complementary deoxyribonucleic acid (cDNA) arrays and real-time reverse transcription polymerase chain reaction (RT-PCR) (Giulietti et al. 2001). Polymerase chain reaction based assays are the most commonly used method for characterising gene expression and comparing messenger ribonucleic acid (mRNA) levels in different samples (Bustin 2002).
The polypeptide hormones, insulin-like growth factor 1 (IGF1) and insulin (INS) are similar in structure (Rinderknecht & Humbel 1978; Torres et al. 1995). They elicit similar biological responses, regulate cell proliferation and mediate metabolic signals, but with differing potencies (Morgan, Jarnagin & Roth 1986). These ligands cross-react competitively with IGF1R receptor (IGF1R) and INS receptor (INSR) (Torres et al. 1995).
IGF1R and INSR are closely related members of the tyrosine kinase receptor super-family (Garrett et al. 1998). These receptors are expressed in almost all mammalian cell types and are large trans-membrane tetrameric glycoproteins, which consist of two alpha-subunits and two beta-subunits (α2β2) and are linked by disulfide bonds (Garrett et al. 1998). Each alpha-subunit contains the extra-cellular ligand-binding site and is about 125 kilo-dalton (kDa) - 140 kDa in size. Each beta-subunit has a trans-membrane domain and the catalytic intra-cellular tyrosine kinase domain is about 95 kDa - 97 kDa. Tyrosine kinases are enzymes that phosphorylate the tyrosine portion of proteins (Abbott, Bueno, Pedrini & Murray et al. 1992). These receptors, like their ligands, are encoded by distinct genetic loci, which are believed to have evolved from a common ancestral gene (Kim & Accili 2002). They share > 50% overall amino acid sequence identity and 84% identity with tyrosine kinase domains (Jones & Clemmons 1995; Pandini et al. 2002).
In domestic animals, IGF1 and INS play essential roles in reproduction (Velazquez, Spicer & Wathes 2008). To understand the roles IGF1 and INS play in the local regulation of the formation and competence of equine oocytes and spermatozoa, real-time RT-PCR assays were developed to evaluate IGF1R and INSR gene expression in equine tissues.
Materials and methods
Sample collection
To develop the assays, testes were harvested from each of three healthy Friesian, Thoroughbred, and Warmblood stallions that had been admitted for routine orchidectomies at the Onderstepoort Veterinary Academic Hospital (OVAH). To evaluate the assays, tissue samples from four mixed-breed adult horse mares were collected immediately after slaughter at a horse abattoir. The samples collected were obtained from the liver, spleen, kidney, lung, heart, skeletal muscle and endometrium.
All tissue samples were collected using sterile forceps and a surgical blade and the blocks (5 mm χ 5 mm χ 5 mm) of tissue were placed into plastic 2.0 mL cryotubes (Nunc, USA), containing approximately 10 volumes of RNAlater® (Ambion, USA). The samples were kept at 4 °C for 24 hours and then stored at -80 °C until analysis.
RNA extraction
To extract RNA, a sample of tissue was thawed at room temperature and approximately 30 mg of tissue was placed into a MagNA Lyser® Green Beads tube (Roche, Germany) containing 900 µL RLT buffer (Qiagen, USA) and 9 µL 14.3 M β-mercaptoethanol (β-ME) (Sigma). The samples were homogenised with a MagNA Lyser® Instrument (Roche, Germany) and two runs of 7000 revolutions per minute (rpm) for 45 seconds were performed; they were cooled on ice for 2 minutes between runs. Samples were kept at room temperature for 30 minutes, then centrifuged at 14 000 rpm for 3 minutes. The supernatant was removed (approximately 600 µL) and transferred to 1.5 mL micro-centrifuge tubes.
RNA was extracted from the samples using the RNeasy® Mini kit (Qiagen, USA) according to the manufacturer's instructions and eluted in 50 µL nuclease-free water. RNA concentration and purity was determined from the A260/A280 ratio, as measured by a NanoDrop ND-1000 spectrophotometer (Thermo Fisher Scientific, USA).
Design of primers for amplification and sequencing of equine receptor mRNA
The complete Equus caballus genome had not been published at the time of this study. Only a trace-file archive of the genome was available publically on GenBank (NCBI) (n.d.).
The human mRNA sequences for IGF1R (NM 000875) and INSR (NM 000208) were assumed to be closely related to the equine equivalents and were used to perform a discontinuous megablast (Altschul et al. 1990) with the equine trace-file archive to identify equine IGF1R and INSR trace file sequences. Trace files were assembled using the Staden package (Staden 1996; Staden, Beal & Bonfield 2000). A local alignment between each equine genomic DNA contig and the respective human mRNA sequence was performed using the Water program in EMBOSS (Rice, Longden & Bleasby 2000). Equine exons were identified as regions with a high degree of alignment between the human mRNA and the equine DNA sequences. The non-exon sequences were deleted from the trace file and the position of the exon-intron junctions noted. The exons were reassembled to yield a putative equine mRNA sequence. The positions of the exon-exon junctions corresponded with the human exon-exon junctions. The putative equine mRNA sequences were used to design primers with the aid of FastPCR® software v3.6.89 (Kalender 2007).
IGF1R and INSR mRNA amplification and sequencing
A one-step reverse transcription polymerase chain reaction (RT-PCR) for IGF1R and INSR mRNA was performed with the GeneAmp® Gold RNA PCR Core Kit (Lifetech, USA) according to the manufacturer's instructions. Two 25 µL reactions were performed per RNA sample (2 µL) for each primer pair. Cycling conditions for the RT-PCR were 42 °C for 12 minutes, 95 °C for 10 minutes and 40 cycles at 94 °C for 20 seconds, 57 °C for 30 seconds and 72 °C for 60 seconds. This was followed by a final extension step at 72 °C for 7 minutes and a hold at 4 °C on a GeneAmp® PCR System 9700 (Lifetech, USA). Amplification of the target DNA was confirmed by running five µL of PCR product on an ethidium bromide-stained 1.5% agarose gel, electrophoresed at 110 volts and the DNA was visualised by UV trans-illumination. The two RT-PCR reactions per sample were combined and purified using a QIAquick® PCR purification kit (Qiagen, USA), according to the manufacturer's instructions. The purified DNA was eluted in 50 µL elution buffer (EB) (Qiagen, USA).
The same primers used for amplification were used for direct sequencing. A BigDye® Terminator v3.1 cycle sequencing kit (Lifetech, USA) was used according to the manufacturer's instructions. Phred (Ewing & Green 1998; Ewing et al. 1998) and the Staden package (Staden 1996; Staden, Beal & Bonfield 2000) were used for base calling and sequence assembly. The assembled IGF1R and INSR sequence for each of the three breeds of stallion was aligned with the equivalent human mRNA sequence using ClustalW software (EMBL-European Bioinformatics Institute n.d.).
Quantitative two-step real-time RT-PCR
The sequences generated were used with Primer Express® software (Lifetech, USA) to design equine IGF1R and INSR mRNA primers and TaqMan® TAMRA™ probes (Lifetech, USA). The primers were designed to amplify 68 and 74 nucleotide regions of the respective IGF1R and INSR genes.
The probes were designed to span exon-exon junctions to ensure detection of mRNA amplification over genomic DNA. The probes were labeled with different fluorescent dyes (FAM and VIC) to allow differentiation between IGF1R and INSR.
TaqMan® reverse transcription reagents (Lifetech, USA) were used as described in the supplied protocol. Reverse transcription was performed with random hexamers. A volume of 7.7 µL RNA was added to the reagents up to a total volume of 20 µL/reaction. cDNA from the tissue samples (liver, spleen, heart, lung, kidney, muscle and endometrium) collected from four horses was placed in a 9700 thermal cycler (Lifetech, USA) and the following conditions were used: 25 °C for 10 minutes, 42 °C for 30 minutes, 95 °C for 5 minutes and a hold at 4 °C.
A LightCycler® TaqMan® Master kit (Roche, Germany) was used as described in the supplied protocol for the realtime PCR. Five µL of cDNA, a final concentration of 0.5 µM primers and a final concentration of 0.1 µM probe were used per reaction. Cycling conditions in a LightCycler 2.0 (Roche, Germany) were as described in the protocol, with an annealing temperature of 60 °C. With each sample tested, a no-RT control was run as a control to screen for genomic DNA contamination. RNA copies per milligram of tissue were calculated using the following formulae:
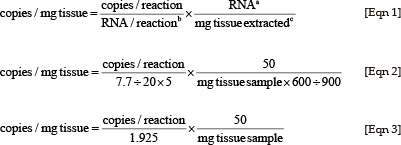
The volume (µL) of RNA extracted (indicated with a) using the RNeasy spin column (Qiagen, USA), b indicated 7.7 µL of RNA that were converted into 20 µL of cDNA and 5 µL of cDNA used or reaction and c indicates the 30 mg of tissue was homogenised in 900 µL RLT buffer (Qiagen, USA) and 600 µΐ used for RNA extraction.
Generation of IGF1R and INSR standard curves
The real-time RT-PCR products were purified with the QIAquick PCR purification kit (Qiagen, USA) and quantified using a NanoDrop ND-1000 spectrophotometer (Thermo Fisher Scientific, USA). The amplicons were cloned using the pGEM® - T Easy Vector System (Promega, USA) according to the manufacturer's instructions. The plasmids were linearised with Sal 1 restriction enzyme. Plasmids were sequenced using T7 and SP6 primers to ensure the absence of mutations in the inserts. The linearised plasmid was transcribed using the MEGAshortscript™ Kit (Ambion, USA) according to the manufacturer's instructions.
RNA was resuspended in 20 µL TE buffer (Ambion, USA) and quantified using a NanoDrop ND-1000 spectrophotometer, using an extinction coefficient of 33 for small RNA < 200 nucleotides (MEGAshortscript™ protocol). The RNA concentrations and the molecular weight of the transcripts were used to calculate the RNA copy numbers. Aliquots of ten-fold dilution series (1 χ 100 to 1 χ 109 copies/µL) were prepared and stored at -80 °C until needed. The control step for the presence of plasmid DNA in the serial RNA dilutions was checked by running real-time PCR on the RNA, without first performing a reverse transcription reaction (no-RT control).
Real-time RT-PCR of the standard dilution series, using 7.7 µΐ of RNA per reaction, was repeated in triplicate on two separate days. All the data were used to calculate a linear regression equation in Microsoft Excel® (Microsoft, USA) of cycle threshold (CT) against log copy number. The regression equation was used to calculate mRNA copy numbers per reaction from the CT. Efficiency of the assay was calculated using the following equation:

The limit of detection was defined as the copy number concentration where 95% of the RT-PCR's would yield a positive result (CT< 40) and was calculated using the Karber equation (Karber 1931).
Results
Amplification and sequencing of equine IGF1R and INSR mRNA
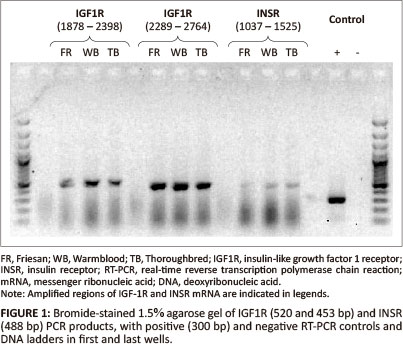
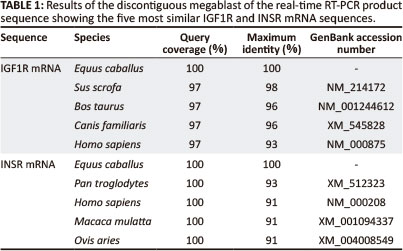
Two pairs of primers were designed to amplify an approximate 1000 base pair (bp) region of the putative equine IGF1R mRNA in two overlapping segments: Forward_1 (gct aat tgt gaa gtg gaa ccc ac), Reverse_1 (gta caa agt gaa tgg ccg gag), Forward_2 (aca atg tca cag acc cag agg ag), Reverse_2 (aga aca cag gat cag tcc acg ac); and one pair to amplify a 488 bp region of the putative INSR mRNA: Forward_3 (tga tgt gta ccc cgt gcc tgg) and Reverse_3 (tgg tct tca ggg cga tgt cgt). A region of both equine IGF1R and INSR mRNA that spanned exon-exon junctions was amplified by PCR and products of the expected size were obtained (Figure 1). These RT-PCR products were visualised on a gel; for IGF1R the expected sizes were 520 bp and 453 bp, and for INSR 488 bp. The PCR products were sequenced and the sequences obtained for IGF1R and INSR mRNA were identical for each breed of horse. Basic Local Alignment Search Tool (BLAST) (Altschul et al. 1990) showed a 92% and 93% identity of the equine IGF1R and INSR mRNA sequences with the human homologs (Table 1).
Quantitative two-step real-time RT-PCR
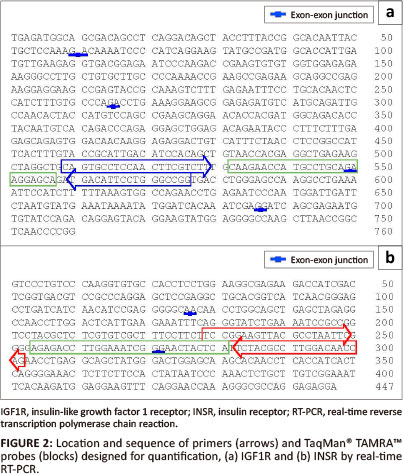
The equine mRNA primers and TaqMan® TAMRA™ (Inqaba Biotechnical Industries, South Africa) probes that were designed were:
IGF1R - forward primer (cag tgc ctc caa ctt cgt ctt), reverse primer (ccg gcc cag gaa tgt ca) and probe (VIC-caa gaa cca tgc ctg cag aag gag ca), and the product size amplified was 67 nucleotides.
INSR - forward primer (tcc gga agt tac gcc taa ttc), reverse primer (ctg gtt gtc caa ggc gta ga) and probe (FAM-tga gta gtt ccc gat ttc caa ggt ctc t), and the product size amplified was 73 nucleotides (Figure 2).
IGF1R and INSR standard curves
Clones with the real-time RT-PCR product insert were sequenced to confirm the presence and sequence of the insert. No mutations in the clones were detected.
Transcription of the plasmid yielded 2.40 µg RNA/µL and 4.51 µg RNA/µL for IGF1R and INSR respectively.
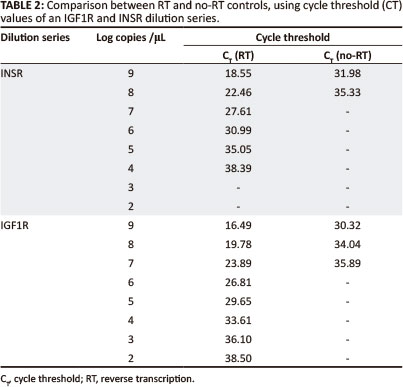
Plasmid DNA contamination was evaluated by running a no-RT control and a no template control in the real-time PCR. Plasmid DNA was detected, but for IGF1R, the DNA concentration was 9800, and for INSR 76 000 times less than the RNA; this was therefore considered to not be significant (Table 2).
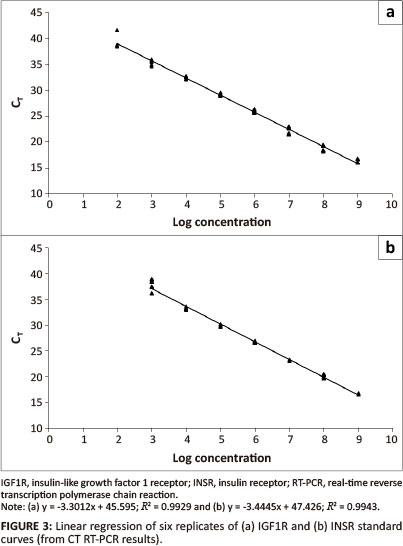
The calculated regression equation for the IGF1R dilution series was:

The calculated regression equation for the INSR dilution series was:

The efficiency and sensitivity of the IGF1R assay are 1.01 and 192 copies/µL and for the INSR assay 0.95 and 891 copies/ µL respectively.
Application of quantitative real-time RT-PCR assays
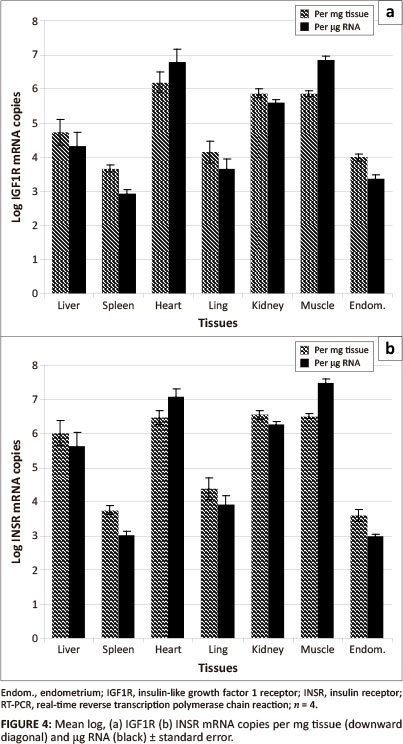
The log transformed mean IGF1R mRNA concentration of equine (n = 4) tissue samples (liver, spleen, heart, lung, kidney, muscle and endometrium) was 10491 ± 10104 standard deviations (SD) copies per mg tissue with a range of 10366
(spleen) to 10619 (heart) (Figure 4). Using RNA as the unit of measurement, the mean IGF1R mRNA concentration was 104.78 ± 101.63 SD per µg RNA with a range of 10292 (spleen) to 106.83 (muscle). In all cases, with the exception of heart and muscle, the IGF1R mRNA concentrations per mg tissue were higher than the concentration per µg RNA.
Discussion
This study describes the development of real-time RT-PCR assays for the preliminary characterisation of IGF1R and INSR mRNA expression in selected equine tissues. In order to develop these real-time RT-PCR assays, equine IGF1R and INSR trace files were identified from a megablast with human IGF1R and INSR mRNA. This initial step was necessary as the only public horse genome data that were available at the time of this study was a DNA trace-file archive, accessible through GenBank (NCBI) (n.d.). This increased the complexity of the study. There is more equine genome data available now, but much of the mRNA sequence data are predicted, whereas the equine mRNA data used in this study were sequenced directly.
The assays were designed to span exon-exon junctions to preferentially amplify mRNA over genomic DNA. Exons were identified as areas with a high degree of identity between the equine DNA trace-files and the human mRNA sequences. Large regions of non-similar sequences separated the exons in the equine trace files. The exon-exon junctions of the equine mRNA were identical to that of the human, suggesting a common homology.
Both assays were efficient, sensitive and had a broad linear range of detection (seven logs for IGF1R and six logs for INSR). The assays worked well in our hands and were sensitive and specific for the detection of equine IGF1R and INSR mRNA.
IGF1R and INSR were present on the surface of almost all cell types (Desoye et al. 1997; LeRoith et al. 1995; Seino, Seino & Bell 1990). However, the expression of these receptors in different tissue types may vary depending on the metabolic and mitogenic characteristics of the cells within these tissues and there may be variation between individual animals due to age (Georgieva et al. 2003; Hess & Roser 2001; Lackey, Gray & Henricks 2000), nutritional state (Balage et al. 1990; LeRoith et al. 1995) and stage of reproductive cycle (Desoye et al. 1997; Ginther et al. 2003; Lackey et al. 2000; Shimizu et al. 2008; Silva, Figueiredo & Van den Hurk 2009). In our study the IGF1R and INSR profiles in various equine tissues were similar. Low concentrations of both IGF1R and INSR mRNA were detected in endometrium, lung and spleen samples, whilst high concentrations were detected in heart, muscle and kidney samples. The high level of INSR expression in the heart, muscle and kidney is probably associated with the high level of glucose metabolism and utilisation by these tissues. For all tissues, except the endometrium, the INSR mRNA concentrations were higher than the IGF1R mRNA concentrations. The mean INSR:IGF1R mRNA ratio was highest in the liver tissue (22:1) and lowest in the endometrial tissue (1:2). The liver manufactures most of the circulating IGF1 (Jones & Clemmons 1995; Navarro et al. 1999) and has the highest levels of IGF1 mRNA and peptide expression, but the lowest expression of IGF1R mRNA (Jones & Clemmons 1995). It is highly probable that an organ manufacturing a hormone with an endocrine function will have a low concentration of receptors for that hormone. This would ensure that the hormone enters the general circulation and exerts its endocrine effect elsewhere in the body.
Conclusion
The sensitivities of the assays at 95% using the Karber equation are 192 copies/µL and 891 copies/µL for IGF1R mRNA and INSR respectively. This allows analysis of very small amounts of mRNA. However, for these assays to be reliable they need extensive and accurate optimisation. Hence, a study to describe the steps used to optimise and validate the assays for real-time RT-PCR of equine IGF1R and INSR mRNA is needed. Such a study should attempt to avoid co-amplification of genomic DNA, reduce inter-assay variability and be normalised to a relevant housekeeping gene. Measuring gene expression at the mRNA level requires the inclusion of a reliable housekeeper gene for accurate data interpretation (housekeeper genes are evenly expressed amongst different tissues of an organism, at different stages of development, between normal and diseased states and should not be affected by experimental treatment itself (e.g., beta-actin, glyceraldehyde-3-phosphate dehydrogenase and 18S ribosomal RNA). The assays may then be used routinely and incorporated into gene expression research in the field of equine medicine, such as joint cartilage injury and repair, as well as in the field of equine reproduction, such as stallion fertility. Quantifying the amount of mRNA using real-time PCR enabled the measurement of differential gene expression, but the level of mRNA transcription may not be necessarily proportional to the level of mRNA translation due to RNA-binding translational activators and repressors. Hence, real-time PCR should be coupled to techniques for measuring or quantifying protein levels (TaqMan® Protein Assays, Western blotting, ELISA or immuno-precipitation immuno-fluorescence).
Acknowledgements
The authors would like to thank the following groups at the Faculty of Veterinary Science, University of Pretoria, for their financial support and use of their laboratories: Equine Research Centre, Veterinary Genetics Laboratory and the Department Veterinary Tropical Diseases.
Competing interests
The authors declare that they have no financial or personal relationship(s) that may have inappropriately influenced them in writing this article.
Authors’ contributions
M.S. (University of Pretoria) was the project supervisor, formulated the objective of the project and secured funding for the project. M.Q. (University of Pretoria) and A.G. (University of Pretoria) were co-supervisors. S.H. (University of Pretoria) was the primary researcher and together with M.Q. wrote the manuscript. S.H. and M.Q. were responsible for the experimental and project design. S.H. performed all of the experiments and M.Q. helped with some of the experiments. M.Q. made significant contributions to the content of the manuscript, as did M.S.
References
Abbott, A.M., Bueno, R., Pedrini, M.T., Murray, J.M. & Smith, R.J., 1992, 'Insulin-like growth factor I receptor gene structure', Journal of Biological Chemistry 267, 10759-10763. PMid:1316909 [ Links ]
Altschul, S.F., Gish, W., Miller, W., Myers, E.W. & Lipman, D.J., 1990, 'Basic local alignment search tool', Journal of Molecular Biology 215, 403-410. PMid:2231712 [ Links ]
Balage, M., Grizard, J., Sornet, C., Simon, J., Dardevet, D. & Manin, M., 1990, 'Insulin binding and receptor tyrosine kinase activity in rat liver and skeletal muscle: Effect of starvation', Metabolism 39, 366-373. http://dx.doi.org/10.1016/0026-0495(90)90250-G [ Links ]
Bustin, S.A., 2002, 'Quantification of mRNA using real-time reverse transcription PCR (RT-PCR): Trends and problems', Journal of Molecular Endocrinology 29, 23-39. http://dx.doi.org/10.1677/jme.0.0290023, PMid:12200227 [ Links ]
Desoye, G., Hartmann, M., Jones, C.J., Wolf, H.J., Kohnen, G., Kosanke, G. & Kaufmann, P., 1997, 'Location of insulin receptors in the placenta and its progenitor tissues', Microscopy Research & Technique 38, 63-75. http://dx.doi.org/10.1002/(SICI)1097-0029(19970701/15)38:1/2<63::AID-JEMT8>3.0.CO;2-V [ Links ]
Ewing, B. & Green, P., 1998, 'Base-calling of automated sequence tracers using phred. II. Error probabilities', Genome Research 8, 186-194. http://dx.doi.org/10.1101/gr.8.3.175, PMid:9521922 [ Links ]
Ewing, B., Hiller, L., Wendl, M.C. & Green, P., 1998, 'Base-calling of automated sequence tracers using phred.I. Accuracy assessment', Genome Research 8, 175-185. http://dx.doi.org/10.1101/gr.8.3.175, PMid:9521921 [ Links ]
EMBL-European Bioinformatics Institute, n.d., 'ClustalW software', viewed 12 May 2008, from www.ebi.ac.uk/Tools/clustalw [ Links ]
Garrett, T.P., McKern, N.M., Lou, M., Frenkel, M.J., Bentley, J.D., Lovrecz, G.O., Elleman, T.C., Cosgrove, L.J. & Ward, C.W., 1998, 'Crystal structure of the first three domains of the type-1 insulin-like growth factor receptor', Nature 394, 395-399. http://dx.doi.org/10.1038/28668, PMid:9690478 [ Links ]
Genbank, n.d., National Center for Biotechnology Information (NCBI), viewed 12 May 2008, from http://www.ncbi.nlm.nih.gov/sites/entrez.html [ Links ]
Georgieva, T.M., Georgiev, I.P., Ontsouka, E., Hammon, H.M., Pfaffl, M.W. & Blum, J.W., 2003, 'Abundance of message for insulin-like growth factors-I and -II and for receptors for growth hormone, insulin-like growth factors-I and -II, and insulin in the intestine and liver of pre- and full-term calves', Journal of Animal Science 81, 2294-2300. PMid:12968705 [ Links ]
Ginther, O.J., Beg, M.A., Donadeu, F.X. & Bergfelt, D.R., 2003, 'Mechanism of follicle deviation in monovular farm species', Animal Reproduction Science 78, 239-257. http://dx.doi.org/10.1016/S0378-4320(03)00093-9 [ Links ]
Giulietti, A., Overbergh, L., Valckx, D., Decallonne, B., Bouillon, R. & Mathieu, C., 2001, 'An overview of real-time quantitative PCR: Applications to quantify cytokine gene expression', Methods 25, 386-401. http://dx.doi.org/10.1006/meth.2001.1261, PMid:11846608 [ Links ]
Hess, M.F. & Roser, J.F., 2001 'The effects of age, season and fertility status on plasma and intratesticular insulin-like growth factor I concentration in stallions', Theriogenology 56, 723-733. http://dx.doi.org/10.1016/S0093-691X(01)00602-1 [ Links ]
Jones, J.I. & Clemmons, D.R., 1995, 'Insulin-like growth factors and their binding proteins: Biological actions', Endocrine Reviews 16, 3-34. PMid:7758431 [ Links ]
Kalender, R., 2007, 'FastPCR: A PCR primer and probe design and repeat sequence searching software with additional tools for the manipulation and analysis of DNA and protein', viewed 24 April 2008, from http://www.biocenter.helsinki.fi/bi/programs/fastpcr.htm [ Links ]
Kaber, G., 1931, '50% end point calculation', transl., Archivfur Experimentelle Pathologies und Pharmakologie 162, 480-483. [ Links ]
Kim, J. & Accili, D., 2002, 'Signaling through IGF-I and insulin receptors: Where is the specificity?', Growth Hormone & IGF Research 12, 84-90. http://dx.doi.org/10.1054/ghir.2002.0265, PMid:12175645 [ Links ]
Lackey, B.R., Gray, S.L.L. & Henricks, D.M., 2000, 'Physiological basis for use of insulinlike growth factors in reproductive applications: A review', Theriogenology 53, 1147-1156. http://dx.doi.org/10.1016/S0093-691X(00)00259-4 [ Links ]
LeRoith, D., Werner, H., Beitner-Johnson, D., & Roberts, C.T., Jr., 1995, 'Molecular and cellular aspects of the insulin-like growth factor I receptor', Endocrine Reviews 16, 143-163. PMid:7540132 [ Links ]
Morgan, D.O., Jarnagin, K. & Roth, R.A., 1986, 'Purification and characterization of the receptor for insulin-like growth factor I', Biochemistry 25, 5560-5564. http://dx.doi.org/10.1021/bi00367a032, PMid:2946318 [ Links ]
Navarro, I., Leibush, B., Moon, T.W., Plisetskaya, E.M., Banos, N., Méndez, E., Planas, J.V. & Gutierrez, J., 1999, 'Insulin, insulin-like growth factor-I (IGF-I) and glucagon: The evolution of their receptors', Comparative Biochemistry and Physiology Part B: Biochemistry and Molecular Biology 122, 137-153. http://dx.doi.org/10.1016/S0305-0491(98)10163-3 [ Links ]
Pandini, G., Frasca, F., Mineo, R., Sciacca, L., Vigneri, R. & Belfiore, A., 2002, 'Insulin/ insulin-like growth factor I hybrid receptors have different biological characteristics depending on the insulin receptor isoform involved', Journal of Biological
Chemistry 277, 39684-39695. http://dx.doi.org/10.1074/jbc.M202766200, PMid:12138094
Rice, P., Longden, I. & Bleasby, A., 2000, 'The European Molecular Biology Open Software Suit', Trends in Genetics 16, 276-277. http://dx.doi.org/10.1016/S0168-9525(00)02024-2 [ Links ]
Rinderknecht. E. & Humbel., R.E., 1978, 'The amino acid sequence of human insulin-like growth factor 1 and its structural homology with proinsulin', Journal of Biological Chemistry 253, 2769-2776. PMid:632300 [ Links ]
Seino, S., Seino, M. & Bell, G.I., 1990, 'Human insulin-receptor gene', Diabetes 39, 129-133. http://dx.doi.org/10.2337/diabetes.39.2.129, PMid:2227119 [ Links ]
Shimizu, T., Murayama, C., Sudo, N., Kawashima, C., Tetsuka, M. & Miyamoto, A., 2008, 'Involvement of insulin and growth hormone (GH) during follicular development in the bovine ovary', Animal Reproduction Science 106, 143-152. http://dx.doi.org/10.1016/j.anireprosci.2007.04.005, PMid:17507188 [ Links ]
Silva, J.R.V., Figueiredo, J.R. & Van den Hurk, R., 2009, 'Involvement of growth hormone (GH) and insulin-like growth factor (IGF) system in ovarian folliculogenesis', Theriogenology 71, 193-1208. http://dx.doi.org/10.1016/j.theriogenology.2008. 12.015,PMid:19193432 [ Links ]
Staden, R., 1996, 'The Staden sequence analysis package', Molecular Biotechnology 5, 233-241. http://dx.doi.org/10.1007/BF02900361, PMid:8837029 [ Links ]
Staden, R., Beal, K.F. & Bonfield, J.F., 2000, 'The Staden package 1998', Methods Molecular Biology 132, 115-130. PMid:10547834 [ Links ]
Torres, A.M., Forbes, B.E., Aplin, S.E., Wallace, J.C., Francis, J.L. & Norton, R.S., 1995, 'Solution structure of human insulin-like growth factor II. Relationship to receptor and binding protein interactions', Journal of Molecular Biology 248, 385-401. http:// dx.doi.org/10.1016/S0022-2836(95)80058-1 [ Links ]
Velazquez, M.A., Spicer, L.J. & Wathes, D.C., 2008, 'The role of endocrine insulinlike growth factor-I (IGF-I) in female bovine reproduction', Domestic Animal Endocrinology 35, 325-342. http://dx.doi.org/10.1016/j.domaniend.2008.07.002, PMid:18703307 [ Links ]
 Correspondence:
Stephen Hughes
Email: shughes.vet@gmail.com
Postal address: Section of Reproduction, Department of Production Animal Science, Faculty of Veterinary Science, Private Bag X04, University of Pretoria, Onderstepoort 0110, South Africa
Received: 03 Jan. 2012
Accepted: 18 June 2013
Published: 30 Aug. 2013

