


Services on Demand
Article
 English (pdf)
 Article in xml format
 Article references
Indicators

Related links
-
 Cited by Google
 -
 Similars in Google
Share

 Permalink
South African Dental Journal
On-line version ISSN 0375-1562
Print version ISSN 0011-8516
S. Afr. dent. j. vol.76 n.6 Johannesburg Jul. 2021
http://dx.doi.org/10.17159/2519-0105/2021/v76no6a7
REVIEW
A review of the 2030 Human Resources for Health Strategy: Implications for dentistry in South Africa
A BhayatI; NR NkambuleII; TK MadibaIII
IMPH, MSc, M Dent, Head of Community Dentistry, Department of Community Dentistry, University of Pretoria, Pretoria, South Africa. ORCID Number: 0000-0002-8103-1233
IIB Dent Ther, BDS, MPH, DHSM, MChD, Department of Community Dentistry, University of Pretoria, Pretoria, South Africa. ORCID Number: 0000-0003-2524-6413
IIIB Dent Ther, BDS, DHSM, MChD, Department of Community Dentistry, University of Pretoria, Pretoria, South Africa. ORCID Number: 0000-0002-0171-0595
ABSTRACT
INTRODUCTION: The South African National Department of Health (NDoH) released a report in March 2020: "2030 Human Resources for Health (HRH) Strategy: Investing in the Health Workforce for Universal Health Coverage".
This report, has implications for the training of dental personnel and the planning of dental services in South Africa (SA). The aim was to summarise and critique the HRH strategic document with reference to dentistry.
METHODS: This was an independent review of the report and included recommendations and implications for the training of dental personnel in SA. The report employed two models to predict the number of dental personnel that will be required; one on achieving provincial equity and the other on improving access to Primary Heath Care (PHC) facilities. The calculations were based on dental personnel employed in the public sector and the number of uninsured people in SA
RESULTS: The first model predicted a shortfall of 486 dentists, 60 specialists, 13 Dental Technicians (Dent Tech), 162 Dental Therapists (DTs) and 104 Oral Hygienists (OHs). The second model, based on PHC utilization, predicted a surplus of 341 dentists and a shortage of 1128 OHs and 1164 DTs. In order to meet these shortages, NDoH would have to allocate R840 million or 2.3 Billion rands respectively, depending on which model is chosen.
CONCLUSION: Irrespective of the model utilised, the NDoH needs to create and All more dental posts, especially in provinces with low dental practitioner to population ratios. Dental training institutions need to align the training of dental graduates to meet the demands as set out in the report.
INTRODUCTION
The report titled "2030 Human Resources for Health (HRH) Strategy: Investing in the Health Workforce for Universal Health Coverage" was released in March 2020. This document was developed by the Ministerial Task Team (MTT) which was established by the former Minister of Health (Dr Aaron Motswaledi).
The MTT consisted of various stakeholders and academics from different sectors of health and was one of the most comprehensive HRH reports produced. The MTT was established to draft the document and to pave the way forward for the training and planning of health care workers in South Africa (SA).
The report consists of two components; the forecast of health workforce needs and costs until the year 2025 and the Ave goals that have been identified to improve health care delivery in SA by the year 2030. This review analyses only the 2025 human resource needs and its implications for dentistry; a subsequent paper will be published critiquing the five goals in terms of dentistry.
The report utilized three different models to forecast the health workforce needs and costs for the year 2025.1 The first model was based on achieving inter provincial equity amongst health care workers, the second model used the Primary Health Care (PHC) approach package of delivering health services and the third model identified the shortfall in medical specialists. Since the third model did not include any dental specialists, this model was not analysed and hence was not reported on in the current review.
In terms of dentistry, the ratio of human resources to population varies considerably across the world and as such the World Health Organization (WHO) does not specify an ideal ratio.2 However, in Africa the ratio is approximately 1:150 000 compared to industrialized countries which have a ratio of 1: 2000 dentists to population ratio.2 Hence when planning human resources in dentistry, this should be taken into account.
AIM
The aim was to analyse and critique the HRH strategic document with particular reference to the impact it could have on dental personnel.
METHODS
This was an independent review of the HRH strategic document with inputs from three community dentistry specialists. The recommendations and interpretations are the views of the authors and not necessarily from the report itself. It is essential to understand how the number of health care practitioners and the population utilising the public health care services were calculated in this report as the results and recommendations are based entirely on these calculations.
The calculation of the health workforce needs and costs with regard to dentistry
The most common means to determine the number of dental personnel (dentists, dental specialists, oral hygien-ists, dental therapists, dental assistants and dental technicians) is to utilise the registers of the Health Professionals Council of South Africa (HPCSA) and the South African Dental Technicians Council (SADTC).3,4 However, these registers contain the details of all dental personnel (DP) including those who have emigrated, retired or changed their profession. Many DP continue to pay their annual fees and maintain their membership even though they might not be practicing in SA. This results in an overestimate of the number of DP and hence an over estimate of the DP to population ratio which has a significant impact on the training, planning and distribution of DP.
As a result, the MTT used an innovative method to try and achieve a more accurate number of the current practising health care workers in SA. They utilized the number of health workers employed in the public sector in 2019 from the Governments Personnel and Salary system (PERSAL). This method ensured that all DP employed in the public sector were included in the forecasting models for the year 2025. The MTT did not include private practitioners in these calculations.
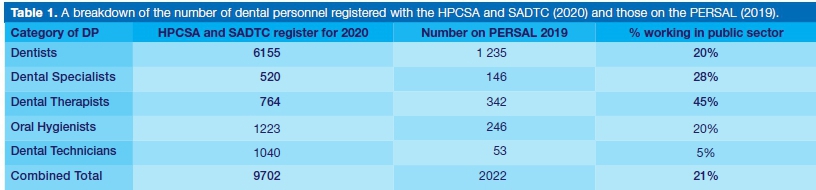
The number of DP registered with the HPCSA and the SADTC in 2020 and those employed within the public sector are shown in Table 1.4,5 Approximately 20% of all registered dentists, 45% of DTs, 20% of OHs and only 5% of D Techs were employed within the public sector.
The prediction and calculation of the costs required in employing additional DP was also determined using the PERSAL system. The PERSAL system has specific grades of salaries for different DP and as such, the cost were calculated by including inflation and applying it to the different salary grades.
The calculation of the number of health care users
The number of health care users is usually based on the population of the country and predictions of population growth are calculated using various tools and forecast methods. However, the MTT defined the number of users of the public health care system as those who did not have medical aid insurance coverage.6
Since the health care workers were limited to the public sector, the MTT decided to use the population that would utilise the public sector and hence subtracted the number of insured people from the total population both nationally and per province. The 2018 National General Household Survey reported that 16.5% of the population were covered by medical aids and assumed the remaining 83.5% would utilise the public sector for their health care treat-ment.7,8,9 Hence the ratio of heath care worker to population was based on the number of uninsured people both provincially and nationally.
Model 1 (Achieving inter-provincial equity)
This model was based on improving inter-provincial equity in the public sector by 2025. South Africa, like the majority of countries has a huge disparity across its nine provinces. As a result, the ratio of health care workers to population varies across the provinces from low to acceptable levels of DP to population ratios.
This inequitable distribution of DP places strain on some of the provinces and as a result impacts on the quality of health care being delivered. Therefore, the MTT ranked the nine provinces according to their ratio of health workers to the uninsured population based on the PERSAL system. The objective was to improve the practitioner to population ratios especially in the six lowest provinces.
The MTT decided to improve the ratios to the level of the third highest province - which was termed the 3rd Rank Province - (3rd RP) equity target ratio. The third highest province was chosen as the target as this would bring the lower two tertiles at least to the minimum level of the first tertile.
Then the number of additional health workers and budget required by 2025 was calculated in order to achieve the 3rd RP target ratios as per other similar studies.1 The objective was to try and have all the provinces at a similar ratio to ensure that all communities have fair and equitable access to health care services.
Model 2 (Primary Health Care approach)
This model was based on utilization rates of the Primary Health Care (PHC) package by all uninsured citizens in SA. This was compiled with the assistance of the Medical Research Council (MRC) and predicted the number of DP that would be required to offer appropriate and acceptable access to PHC services.10 The PHC service offers a range of treatments defined in the 2010 document on Revitalising PHC.11
The current 2018-19 public sector PHC utilisation rate is an average of 2.1 visits per person per year; but based on the burden of diseases and coverage level guidelines from the National Department of Health (NDoH), patients should ideally access PHC facilities approximately 3.2 times per annum.1 This model therefore calculated the number of DP that will be required to provide all uninsured people access to an average of 3.2 visits per annum.1
RESULTS
The ratio of DP employed on the PERSAL to the uninsured population in SA is shown in Table 2.1 There was a wide disparity between the number of dentists (2.55), DTs (0.71), OHs (0.51) and D Tech (0.11) per 100 000 public sector population.
Results from Model 1 calculations
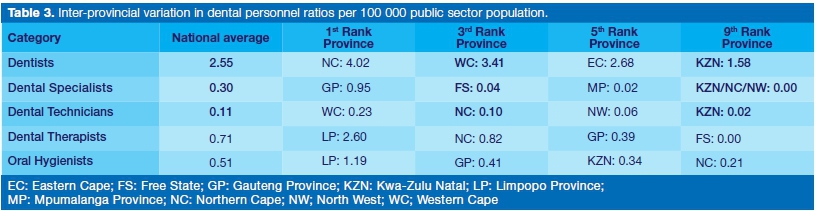
The current inter-provincial variations in DP ratios per 100 000 public sector population showed that the Northern Cape (NC) had the highest ratio of dentists to population (4.02) while Kwa Zulu Natal (KZN) had the lowest (1.58) (Table 3).1
Limpopo Province (LP) had the highest number of DTs and OHs per public population while Free State (FS) and Northern Cape (NC) had the lowest ratio respectively. Gauteng had the highest ratio of dental specialists (0.95) while NC, NW and KZN had very few or no dental specialists at all.
Due to the disparity in the population to staffing ratio amongst the nine provinces, some provinces had a higher population to practitioner ratio compared to others. In order for all nine provinces to achieve a similar ratio of population to practitioner ratio, the model used the third ranked province as a benchmark.
Using this model, government would require an additional 486 dentists, 60 specialists, 13 D Techs, 162 DTs and 104 OHs (Table 4).1 It would cost the state approximately 840 million Rands to achieve these required numbers.
Results from Model 2
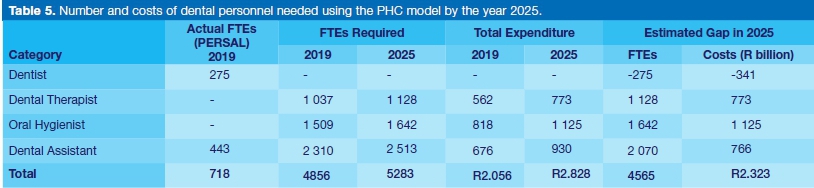
This model predicted a shortage of 1128 DTs, 1642 OHs and 2070 DAs by the year 2025 (Table 5).1 These shortages were calculated by subtracting the actual Full Time Equivalents (FTEs) in 2019 from FTEs required in 2025. This model also reported a surplus of 275 dentists as shown in Table 5.1
Dental Technicians were excluded from this analysis as the PHC package does not include rehabilitative services such as prosthodontic and orthodontic services. Although dental specialists are also not included in the basic PHC package of care, the PHC approach allows for secondary and tertiary facilities to offer specialised services such as maxillo-facial and oral surgery. It is likely, that the bulk of specialists required would be employed at secondary and tertiary facilities and would include maxillo-facial surgeons.
The second column of Table 5, the actual FTEs based on the 2019 PERSAL, is the number of full-time dental personnel per facility in relation to all full-time health care workers nationally. Since there were so few DTs and OHs compared to other health care workers, their FTEs were negligible and hence not recorded. This was confirmed by the large number of DTs and OHs that will have to be employed to achieve the national ratio in line with other mid-level workers. The NDoH would have to allocate in excess of 2.3 Billion Rands to achieve the required number of DP as suggested in the report.
DISCUSSION
Although the calculation of the number of human resources was innovative, the calculations of ratios between DP and the population were based on the number of DP employed in posts within the public sector only. Hence, any shortfall or surplus that was calculated meant that there was a shortage or surplus of filled posts within the public sector and not necessarily a shortage/surplus of DP in the country. As a result, any recommendations of training additional DP need to be interpreted with caution as there could already be sufficient numbers of DP in SA, but not enough funded posts that can be filled within the public sector.
The low number of D Techs to 100 000 uninsured people (0.11), could be due to the limited number of dental prosthesis and rehabilitative services offered at public dental facilities.12 Most rehabilitative services are offered at the tertiary institutions and it is likely that most of the D Techs were employed at those institutions.
The limited number of prosthodontic and orthodontic services rendered at the public dental facilities are usually outsourced to private laboratories as it is more cost effective compared to employing a full time D Tech together with all the necessary laboratory equipment.
A strength of using the PERSAL system in predicting HRH needs is that funding for additional posts can be easily calculated as the public sector has specific salary ranges for the different health care worker categories. If this report used the HPCSA or any other registers, calculating the salaries and financial costs would be cumbersome and complicated as salaries vary tremendously among private health care workers.
Although these registers have limitations, they do provide a trend which can be used to compare the numbers of DP working in the public and private sectors. Approximately only 20% of all registered DP were employed within the public sector in 2019. This comprised of 45% of all DTs, 28% of all specialists, 20% of all dentists and 20% of all OHs. Only 5% of D Techs worked in the public sector and this could be due to the minimal amount of rehabilitative services rendered at public health facilities. This relatively low number of DP employed in the public sector could be due to a lack of posts, poor financial remuneration or due to a lack of services that are being rendered.13
The 20% of DP that were employed within the public sector had to provide dental care to as much as 80% of the South African population and this could be one of the many reasons why communities don't have adequate access to curative and preventive dental care.
Regarding the utilization of the public sector, this report assumed that all uninsured members will exclusively utilise the public sector and all insured members will exclusively utilise the private sector.
This is not the case as many insured patients use the public sector and vice versa. Therefore, it does have a weakness and hence the results and forecast needs to be interpreted with caution.
Interprovincial equity model
It was surprising that the most urbanised provinces; Gau-teng, KZN and Western Cape (WC) did not have the best practitioner to population ratios as was expected. This could be due to the population density in these provinces.
Similarly, it was interesting to note that LP had the best ratios for both DTs (2.60) and OHs (1.19). This could indicate that the number and type of oral health personnel in this province was in line with the national plan of increasing the number of mid-level workers to offer dental services.
The number of required DP is not the actual number required to train but the number of posts that would have to be created and funded in different provinces across the country in order to have a fair and equitable distribution of oral health care workers. This implies that most of these posts will have to be in the 6 provinces that have the lowest DP to population ratio. Additional dentists, dental specialists and D Techs need to be employed in KZN, more DTs need to be employed in FS and more OHs in the NC provinces.
Unfortunately the model combined all dental specialists into one category and as such the calculation of the number and type of dental specialists required could not be accurately quantified. The majority of specialist were employed in Gauteng and this was possibly due to the three dental schools that are located in Gauteng. These dental schools would have employed the majority of specialists due to the training of both under and post graduate dental students.
The provinces with very few specialists; NW, KZN and NC do not have any training facilities for dentists and dental specialists and this could be a reason for the low number in these provinces.
Primary Health Care Utilization model
The reason for the surplus of dentists in this model is due to the PHC basket of services which can be rendered by DTs, OHs and DAs. If this model is used to calculate the HRH needs, then training institutions would have to increase the number of DTs, OHs and DAs in order to meet the demands. In addition, provinces would have to create and All these posts accordingly.
It is unlikely that training institutions would be able to graduate the large numbers of DTs (1128), OHs (1642) and DAs (2513) that have been predicted in this model. Another option would be to retain the dentists in the public sector until sufficient numbers of OHs and DTs are available.
If the South African government introduces the NHI in the near future, it will be based on the PHC package of services and hence the number and type of personnel required will be similar to the requirements as laid out in this model. It is also essential to realise that mid-level workers have been identified as the key role players in delivering health care services to the uninsured population. As a result, more emphasis must be placed on the training of mid-level workers (DTs and OHs) in the dental field.
Forecasting the oral health care workers needs for 2025
There are generally two ways to improve the ratios of DP to the uninsured population. One is to increase the numerator by increasing and then filling the number of DP posts within the public sector; and the other mechanism would be to decrease the denominator. The denominator could be decreased by reducing the uninsured population through having more people on medical aid schemes either by decreasing the medical aid membership fees, increasing employment rates and subsequent access to medical aids or by increasing the type and number of benefits from medical aid companies.
Impact of COVID-19
These predictions are fluid and depend on a variety of external factors. With the advent of COVID 19, these predictions could all be skewed as the pandemic has had serious direct and indirect effects on the South African landscape. Due to the lockdown, the economy has shrunk and unemployment has increased. Any factor that increases unemployment will increase the number of uninsured people as they would not be able to afford medical aid fees and hence, essentially reduce the ratio of DP to 100 000 population. If the mortality rate increases drastically due to COVID 19, that could reduce the population and hence also impact on the DP to population ratio. In addition, anecdotal evidence has shown that COVID-19 has been responsible for a large number of deaths amongst health care workers which would also negatively impact on the health worker to population ratio.
Training and retention
In addition to increasing the number of qualified DTs and OHs to meet the shortfall, Government would also have to develop means of retaining them within the public sector. DTs have a high attrition rate; some go back to study dentistry while others change their profession completely.14 If government decides to train and employ mid-level workers as per the HRH document, the issue of retention within the professions and within the public sector is a crucial factor that needs to be addressed.
Many DTs and OHs cite poor financial remuneration as the main reason for exiting or not applying for employment within the public sector.14 This issue could be partly addressed by introducing Compulsory Community Service (CCS) for the OH and DT graduates.15 This would ensure a continuous stream of newly qualified graduates that would be able to render their services in provinces where their services are urgently required.
The average and predicted salaries for selected health care workers is shown in Table 6. Oral hygienists and DTs, on average, earn less than half (48%) the salary of a dentist and around 73% of other similar health care workers such as physiotherapists, occupational therapists and speech therapists.1 Therefore, in order to make the oral hygiene and dental therapy professions attractive and retain these personnel in their respective careers within the public sector, government must re-examine their financial remuneration packages.
Model 3 (Determines the number of medical specialists)
Since this model did not include dental specialists, this model was not analysed nor critiqued.
Recommendations
1. The NDoH must create and fill more public sector dental posts especially in provinces where there is a shortage of oral health personnel. The creation of more posts could also assist in addressing the misdistribu-tion of DP by increasing the number of DP employed in the public sector.
2. Compulsory Community Service for OH and DT graduates should be discussed and analysed as an option which could ensure a continuum of primary dental care for communities in need.
3. Training institutes must align the type and number of DP being trained with the disease burden and the current shortages of dental staff as indicated in this report. There should also be programs and courses developed to improve the career pathways of mid-level DP.
4. A national database should be developed to keep track of all health care professionals including their practicing status and geographical practice location. This will allow for better predictions and planning of health personnel. This should include both the public and private sectors and must be updated annually to ensure correctness and adequate and appropriate planning.
5. The number of dental specialists employed in the public sector needs to be analysed. In those provinces where there is a shortage, more specialist posts need to be created and filled.
6. Lastly, government must identify mechanisms in which it can retain mid-level staff in their professions and within the public sector and one option would be to improve their financial remuneration.
CONCLUSION
Irrespective of the model utilised, there is a dire shortage of all types of dental personnel within the public sector. As a result, the NDoH needs to create and fill more posts, especially in provinces with low dental practitioner to population ratios. In order to deal with the shortage of personnel, dental training institutions need to align their training of graduates to the needs and demands as set out in the report.
To ensure equity, access to dental care and prevention of dental diseases, both an increase in the posts within the public sector and an increase in the number of oral health personnel will be required. The NDoH must also identify mechanisms in which it can retain mid-level oral health workers in their professions and within the public sector.
Acknowledgement
All of the contributors, stake holders, Ministers of Health and the MTT need to be acknowledged, thanked and congratulated for the hard work and effort they put in when developing and producing this strategic document.
References
1. National Department of Health. 2030 human resources for health strategy: Investing in the health workforce for universal health coverage. Pretoria: Government printers. 2020. [ Links ]
2. World Health Organization. Available online: https://www.who.int/oral_health/action/services/en/. Accessed May 2021. [ Links ]
3. Health professions council of south africa. Available online: Http://www.Hpcsa.co.za/publications/statistics. Accessed on december 2020. [ Links ]
4. South African Dental Technicians Council (SADTC). https://sadtc.org.Za/. Accessed December 2020. [ Links ]
5. Health Professions Council of South Africa (HPCSA). http://www.Hpcsa.Co.Za/. Accessed December 2020. [ Links ]
6. Johnson LF, May MT, Dorrington RE, Cornell M, Boulle A, Egger M, et al. Estimating the impact of antiretroviral treatment on adult mortality trends in south africa: A mathematical modelling study. PLoS medicine. 2017; 14(12): e1002468. [ Links ]
7. Bhayat A, Chikte U. Human resources for oral health care in south africa: A 2018 update. International journal of environmental research and public health. 2019; 16(10): 1668. [ Links ]
8. StatsSA. General household survey 2018. Statssa: Pretoria. 2019. [ Links ]
9. Govender V, Chersich MF, Harris B, Alaba O, Ataguba JE, Nxumalo N, et al. Moving towards universal coverage in South Africa? Lessons from a voluntary government insurance scheme. Global health action. 2013; 6(1): 19253. [ Links ]
10. Daviaud E, Subedar H. Staffing norms for primary health care in the context of phc re-engineering. Cape Town: Medical Research Council. 2012. [ Links ]
11. Rispel L, Moorman J, Chersich M, Goudge J, Nxumalo N, Ndou T. Revitalising primary health care in south africa: Review of primary health care package, norms and standards. Johannesburg: Centre for Health Policy, School of Public Health, University of the Witwatersrand. 2010. [ Links ]
12. Bhayat A, Madiba TK, Nkambule NR. A three-year audit of dental services at primary health care facilities in gauteng, south africa: 2017 to 2019. Journal of International Society of Preventive & Community Dentistry. 2020; 10(4): 452. [ Links ]
13. van Rensburg HC. South africa's protracted struggle for equal distribution and equitable access-still not there. Human resources for health. 2014; 12(1): 26. [ Links ]
14. Singh PK. Job satisfaction among dental therapists in south africa. Journal of Public Health Dentistry. 2014; 74(1): 28-33. [ Links ]
15. Bhayat A, Yengopal V, Rudolph MJ, Govender U. Attitudes of south african dental therapy students toward compulsory community service. Journal of dental education. 2008; 72(10): 1135-41. [ Links ]
 Correspondence:
Ahmed Bhayat
Department of Community Dentistry, University of Pretoria
Pretoria, South Africa.
Email: ahmed.bhayat@up.ac.za
Author contributions:
1 . Ahmed Bhayat: Principle author - 40%
2 . Ntombizodwa R Nkambule: Second author - 30%
3 . Thomas K Madiba: Third author - 30%

