


Servicios Personalizados
Articulo
 Inglés (pdf)
 Articulo en XML
 Referencias del artículo
Indicadores

Links relacionados
-
 Citado por Google
 -
 Similares en Google
Compartir

 Permalink
South African Dental Journal
versión On-line ISSN 0375-1562
versión impresa ISSN 0011-8516
S. Afr. dent. j. vol.75 no.7 Johannesburg ago. 2020
http://dx.doi.org/10.17159/2519-0105/2020/v75no7a4
RESEARCH
The 'Digital Access Divide' at a South African Dental School- A cross-sectional study - Part 1
TC PostmaI; LM SykesII; A UysIII; P BrandtIV; E CraffordV
IMChD, DHSM, PhD, Head Clinical Unit, Department of Dental Management Sciences, University of Pretoria, Pretoria, South Africa
IIBSc, BDS, MDent, IRENSA, Dip Forensic Path, Dip ESMEA, Head of Department of Prosthodontics, University of Pretoria, Pretoria, South Africa. ORCID Number: 0000-0002-2002-6238
IIIB.Sc., BChD. Dip.Odont. (Materials), Dip. Odont. (Endo), M.Sc. (Odont.), PhD, Department of Oral Pathology and Oral Biology, Faculty of Health Sciences, University of Pretoria, Gauteng, South Africa
IVBChD (Stell), MSc (Odont), Adv Dip Aesthet Med (FPD), Department of Restorative Dentistry, University of Pretoria, Pretoria, South Africa
VBChD, BChD Hons, Oral Medicine, MChD OMP, Senior Specialist Department of Oral Medicine and Periodontics, University of Pretoria, Pretoria, South Africa
ABSTRACT
This study sought to investigate the digital divide, from an access perspective, of dental students at the University of Pretoria. Second to final year students (n= 218 (87.2% response rate) completed a custom-designed survey at the end of 2017.
The investigation enquired about the digital devices and infra-structure they owned and used for study purposes. They were also asked to reveal the networks and resources they used to access online platforms and to comment on any other related access issues such as the quality of the Internet, speed and reliability, as well as cost and personal implications related to usage.
A clear divide could be detected for a minority of students (±1/7). Individually targeted interventions will be required to ensure an equitable and fair online learning experience.
INTRODUCTION
Government influence on Universities has led to the massification of higher education around the world,1 with a coinciding drive towards online teaching and learning.2
This move has also been associated with beliefs that the mere exposure to technology is not enough and that deeper know-how of information technology-use is required to adequately equip graduates for the labour market in future.3
Access to information through digital technology, unfortunately remains a key challenge for many disadvan-taged students in higher education in South Africa, with many relying on university loaned devices4 and these days, zero-rated data (subsidised data).
Exposure to unreliable information and inadequate Internet speed are further factors that may result in negative digital learning experiences.5 Obviously socio-econom-ically disadvantaged individuals will have less access to necessary resources to succeed, which unfortunately may have a distinct impact on graduate unemployment rates.6 This is particularly true in South Africa, where there is indeed a noticeable digital divide driven by social dynamics and inequality.7
This situation has been exacerbated by the sudden outbreak of the COVID-19 pandemic with governments and education institutions rushing into an expedited push towards online teaching and learning.8
Dental Schools are being faced by this same conundrum of adopting online teaching and learning strategies, which have until now not been often employed, due to the predominant clinical nature of the programme. The question, however is whether all students have equal access to online resources in order to ensure equitable teaching and learning?
Hence, the objectives of this study were to determine the information technology resources students possessed and used for learning purposes as well as their access and experiences with the quality of access to the Internet.
It also sought to investigate cost implications and perceived impact this had on disadvantaged students.
MATERIALS AND METHOD
Study design and sample
This cross-sectional investigation took the form of descriptive research, based on a custom-designed survey, which was given to all dental students from the second to the fifth year of study. It was conducted at the School of Dentistry, University of Pretoria late in 2017. All registered students (the estimated number of ±60 students per year = sample size of 240 responses) were requested to participate in the survey and assured that all questionnaires would remain anonymous and all comments be kept strictly confidential.
Students who were concerned that they may be dis-advantaged with their studies due to difficulties accessing the Internet were encouraged to discuss their problems further with their class tutors or the researchers.
* First year students were omitted due to their limited exposure to internet usage at University level.
Questionnaire
Students were asked to indicate their year of study (from year 2 to 5), sex, and where they resided (rented flats, residences, communes, parent's homes or other). They were then questioned on whether they had a computer/ laptop, tablet/I-pad, or a smart phone and whether they possessed their own information technology and Internet hardware facilities, had a data contract and if so, the monthly cost thereof (2017 rates), as well as their general monthly data expenditure.
Usage of the local municipal-provided Tshwane network was probed, and students had to rate the Tshwane as well as the University data networks on a scale of zero ten (0 = very unreliable, 10 = strong reliability).
Those who used the Tshwane network were asked if the felt safe in the spaces where they accessed this network. Students were also asked whether they had access to the Internet for study purposes (specifically) at home, whether the Internet was easily accessible to them and whether they could access the Internet when they needed it the most ("Yes" or "No").
This was followed by a request to elaborate on any of the questions where they had given negative answers through open-ended inquiry. Further questions related to the frequency of use of the University computer facilities (daily, weekly, monthly, semesterly or never), as well as to indicate if they had to wait for a turn to use these facilities at the University and their residences.
This was followed by a question that sought to determine if the Internet speed, that they had access to, was acceptable to ensure efficient use, and to elaborate more if they indicated "No".
Students were asked about their studying preferences and whether they learnt directly from the computer/ laptop, tablet/I-pad or smart-phone or if they printed downloaded materials for study purposes, and the cost thereof.
They were also probed as to whether they felt disad-vantaged, compared to their classmates, due to lack of Internet access, or due to a lack of computers, tablets/ I-pads and smartphones. In addition, they were asked to report if they have confided to lecturers about these issues and whether they had been helped by the lectures.
The questionnaire also contained questions about technology usage and perceived competencies in this regard. These questions were beyond the scope of the current report and will be reported on in a follow up paper.
The data was manually captured in Microsoft Excel and checked for accuracy by the second researcher. This was followed by a descriptive account, using frequency distributions of the responses. Relevant quotations were extracted, based on observed patterns, identified by the primary and second researcher.
RESULTS
A total of218 dental students responded to the questionnaire, which constitutes a total response rate of 87.2%. It should be noted that not all student answered all the questions, hence the reported percentages below will not be a reflection of the 218 (total) responses, but rather of those who responded to each question.
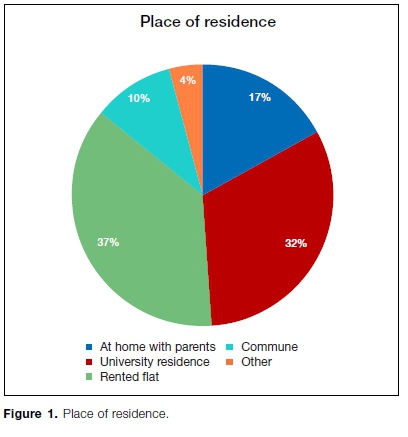
Of the total respondents, 60 (27.6%), 54 (24.9%), 52 (24.0%) and 51(23.5%) werein the second to the fifth year respectively, with 73.6% being female. Respondents resided in rented flats (36.9%), University residences (32.2%), parents' homes (16.6%), communes (10.1%), and "other" housing options (4.1%) ( Figure 1).
Only seven students (3.2%) reported that they did not have a personal computer/laptop, while 85 (39%) did not possess a tablet/I-pad. Six (2.8%) students indicated not owning a smartphone.
Furthermore, 156 (71.6%) reported to have access to their own IT and Internet facilities of which the mean cost was R434 per month (p/m) (Standard deviation (SD): R269 p/m; Standard Error (SE) R27p/m; 95% Confidence Interval (CI): R379-488 p/m (n = 97)).
A total of 134 (61.5%) had a data contract with a mean cost of R362 p/m (SD: R237 p/m; SE R23 p/m; 95% CI: R317-406 p/m (n=110)), while spending on data constituted R397 p/m (SD: R300 p/m; SE R25 p/m; 95% CI: R347-447 p/m (n=140)). Atleast 35 respondents (16.1%) made use of Tshwane free Wi-Fi, of which 16 stated that they did not feel safe in the spaces where this Wi-Fi was available. Using a scale of zero to ten, Tshwane Wi-Fi users rated the mean reliability of this network to be 5.45 (SD: 2.61; SE 0.48; 95% CI: 4.47-6.43 (n=30)). Comparatively, the University network was rated as 7.02 (SD: 1.69; SE 0.12; 95% CI: 6.79-7.25).
At least, 28 (12.9%) respondents reported to use University computers on a weekly basis or less, while 97 (44.6%) only use it only occasionally in a year. Of these 72 (33%) reported that they had to wait for a turn to use the computer facilities on campus while 24 (11%) had to wait their turn at residences or at home.
Sixty (27.5%) students did not have access to the Internet, specifically for study purposes, at their flats or private homes, while 27 (12.4%) indicated that they did not have easy access to the Internet at all.
A total of 25 (11.5%) respondents indicated a lack of access to the Internet when needed most. Some related qualitative comments included:
• "I do not have internet connection where I am residing, I don't have Wi-Fi or data either".
• "Where I stay there is no Wi-Fi and I have to choose between food and necessary data with my pocket money".
• "Data is expensive. Thus, not easy to top up all the time - have to come to campus to download work"
• "No Wi-Fi at private flat. If I need to use the internet, I must visit the internet café"
• "It's expensive and the network in my area is POOR (non-existent)".
Moreover, 44 (20.2%) respondents reported that the Internet resources they had access to had inefficient speed. Some of these were qualitatively specified as privately owned resources as well as University facilities on campus and at residences. Emerging quotes is this regard include:
• "Speed of internet has stopped me from watching educational videos due to waiting for it to load"
• "Is a bit slow sometimes = difficult to download notes"
• "Downloading documents such as PowerPoint presentations can take longer thus more use of data"
• "It is slow or offline sometimes"
• "Sometimes very slow. Disconnect suddenly, especially during tests"
Respectively, 162 (75.7%), 101 (46.3%), and 82 (37.6%) respondents indicated to be studying material directly from their computer, tablet/I-pad or smart phone while 128 (58.7%) downloaded and printed material for study purposes.
The average cost of the printing was reported to beR177 p/m (SD: R251 p/m; SE R29 p/m; 95% CI: R120- 234 p/m (n=77)).
A total of 32 students (14.7%) felt disadvantaged compared to their classmates due to lack of Internet access while 25 (11.5%) felt disadvantaged due to a lack of computers, tablets/I-pads or smartphones.
Only 14 of them had confided to lecturers about their problems of not having easy access to the Internet or computers, but none of them had been helped in this regard.
DISCUSSION
This study aimed to determine the information technology resources dental students possessed for study purposes, and to gauge their experiences with access and quality of online learning, including cost-implications and personal implications.
The results showed that a very high percentage of dental students owned mobile digital devices (96.8% owned a computer/laptop and 97.2% owned a smartphone). These high numbers are consistent with trends reported in the literature that suggest that more and more students from lower socio-economic groups own digital devices in countries such as South Africa.3
Unfortunately, the mere possession of a devise does not guarantee access or quality access to the digital world,7 which was evident in some of the results and comments. Obviously, students with devises had unlimited access on-campus to the relatively reliable University of Pretoria Wi-Fi network (Rated 7.02/10.00).
The big divide, however, became evident off campus where it was observed that 156 students could afford their own Internet infrastructure at home, at a fair cost, while 35 students often had to rely on the municipally provided Tshwane Wi-Fi network. Not only was the latter network rated less reliable (rated 5.45/10.00) compared to the university network, but nearly half of those who had to use the Tshwane network felt unsafe in the spaces where they could access the network.
Of these, 28 (12.9%) respondents used library computer on a daily/weekly basis. Thirty three percent of those who made used of the library computers had to wait their turn compared to only 11% at home. This is particularly relevant in the heavily loaded Dentistry programme that allows for little free time for research and self-study and clearly favours those with personal facilities at home.
Perhaps two of the most revealing results were that sixty students (27.5%) did not have access to the Internet, specifically for study purposes, at their flats or private homes and that 25 respondents (11.5%) indicated a lack of access to the Internet when they needed it the most.
Some indicated that they often did not have data and if they had to choose between data and food the choice was obvious. They then downloaded material when on campus or at Internet café's which has obvious dis advantages. Others have data but have a poor or no network where they reside, and complained that it often took too long to download.
The high monthly cost of data (R397 p/m based on 2017 data fees) reported in this study can fortunately now be negated because students are now being helped by being provided with zero-rated data for study purposes through the University's education management system hosted on Blackboard LearnTM. It should be borne in mind that these costs are subsidised by the University and may indirectly impact on students at a later stage through fee increases.
Another revealing result was that one in Ave students had issues with the quality of the signal or bandwidth both on and off campus resulting in situations where they could not properly access tests, videos and documents in reasonable time, and sometimes not at all.
Based on the results above it, is not surprising that a total of 32 (14.7%) students felt disadvantaged compared to their classmates due to lack of Internet access and 25 (11.5%) felt disadvantaged due to a lack of computers, tablets/I-pads or smartphones. It also appears that up until now, confiding in lecturers has not helped them solve the problem.
Limitations
The cross-sectional data is reflective of the period in which the survey was carried out. It is, however, unlikely that teaching and learning methods and information technology use changed much until the start of the COVID-19 lockdown in March 2020.
A bigger divide may however be detected if this study is repeated in the COVID-era. Students were sent home during lockdown with many students relying on favourable infrastructure in residences and on university campuses.
The fact that only 87.2% of students responded may have skewed the results slightly but we feel confident that it is a representative sample. The students of the University of Pretoria may also be more affluent compared to other student populations which may explain the relatively small number (±1/7) with access issues.
CONCLUSION
The results of this study revealed that not all students had equal access to the Internet and online learning opportunities. Many struggled to use it at times or in venues that suit their living conditions and intensive curriculum programs. In addition, a number of students were further disadvantaged due to the high costs of data although this has now partially been addressed with the zero-rating of data on the University education management system.
Management and lecturers need to be aware of this to ensure that no students are disadvantaged in comparison to their peers, nor erroneously labelled "disinterested" or "lethargic". Now more than ever they need to work together, to seek individual targeted solutions, and to implement the necessary changes if they wish to be truly committed to the well-being and education of their students.
References
1. Mok KH. Massification of higher education, graduate employment and social mobility in the Greater China region. British Journal of Sociology and Education. 2015; 37(1), 51-71. [ Links ]
2. Devlin M, McKay J. Teaching inclusively online in a massi-fied university system. Widening Participation and Lifelong Learning. 2018 Jan 31; 20(1):146-66. [ Links ]
3. Ng'ambi D, Brown C, Bozalek V, Gachago D, Wood D. Technology enhanced teaching and learning in South African higher education - A rearview of a 20 year journey. British Journal of Educational Technology. 2016 Sep; 47(5): 843-58. [ Links ]
4. Nyahodza L, Higgs R. Towards bridging the digital divide in post-apartheid South Africa: a case of a historically disad-vantaged university in Cape Town. South African Journal of Libraries and Information Science. 2017 Jan 1; 83(1): 39-48. [ Links ]
5. Porter WW, Graham CR, Bodily RG, Sandberg DS. A qualitative analysis of institutional drivers and barriers to blended learning adoption in higher education. The internet and Higher education. 2016 Jan 1; 28: 17-27. [ Links ]
6. Baldry K. Graduate unemployment in South Africa: Social inequality reproduced. Journal of Education and work. 2016 Oct 2; 29(7): 788-812. [ Links ]
7. Bornman E. Information society and digital divide in South Africa: results of longitudinal surveys. Information, Communication & Society. 2016 Feb 1; 19(2): 264-78. [ Links ]
8. Wajdi MB, Kuswandi I, Al Faruq U, Zulhijra Z, Khairudin K, Khoiriyah K. Education Policy Overcome Coronavirus, A Study of Indonesians. EDUTEC: Journal of Education And Technology. 2020 Mar 30; 3(2): 96-106. [ Links ]
 Correspondence:
Leanne M Sykes
Head of Department of Prosthodontics
University of Pretoria, Pretoria, South Africa
Email: leanne.sykes@up.ac.za
Author contributions:
1 . Thomas C Postma: First author - 40%
2 . Leanne M Sykes: Second author - 30%
3 . André Uys: Third author - 10%
4 . Paul Brandt: Fourth author - 10%
5 . Elmine Crafford: Fifth author - 10%

