


Serviços Personalizados
Artigo
 Inglês (pdf)
 Artigo em XML
 Referências do artigo
Indicadores

Links relacionados
-
 Citado por Google
 -
 Similares em Google
Compartilhar

 Permalink
South African Dental Journal
versão On-line ISSN 0375-1562
versão impressa ISSN 0011-8516
S. Afr. dent. j. vol.73 no.6 Johannesburg Jul. 2018
http://dx.doi.org/10.17159/2519-0105/2018/v73no6a4
RESEARCH
Dental Therapy Student cohorts: Trends in enrolment and progress at a South African University
M.M. MasetlaI; S.R. MthethwaII
IBDT, MPH. Dental Therapist/ Lecturer. Department of Community Dentistry, Sefako Makgatho Health Sciences University
IIBDS, MPH, PhD. Senior Stomatologist/Lecturer. Department of Oral Pathology & Oral Biology, Sefako Makgatho Health Sciences University
SUMMARY
INTRODUCTION: The urgent need to train a great many dental therapists to alleviate the shortage of oral health personnel has long been recognised.
AIMS AND OBJECTIVES: To describe trends in enrolments, examination pass rates and graduations of cohorts of dental therapy students at Sefako Makgatho Health Science University during the decade 2004 to 2014. The number of students who completed their degree and graduated within the regulation time was also determined.
DESIGN: A cross-sectional descriptive study.
METHODS: Academic records of cohorts of dental therapy students for the period 2004 to 2014 were reviewed. Data related to demographic characteristics, numbers enrolled, numbers who dropped out, and numbers who graduated were acquired and then captured in Microsoft Excel software.
RESULTS: The median number of enrolled students in all years was 36. The maximum number of first year enrolment was 21. More female students than male students enrolled and graduated. The aggregate examination pass rate was in the low 80s. The number of graduates was less than a third of the number enrolled. Less than half of all students who had registered initially successfully completed the course in the regulation time.
CONCLUSIONS: Both student enrolment and graduations are on an upward trajectory.
INTRODUCTION AND BACKGROUND
The Saskatchewan Dental Therapists Association defines dental therapists as primary oral health care professionals who are trained to perform basic clinical dental treatment and preventive services within a variety of practice
settings.1 In South Africa, dental therapists were initially trained to undertake their scope of practice under the supervision of a qualified dentist in public dental service as a part of the multi-disciplinary healthcare team.2 Dental therapists have been allowed to practice independently since October 1992.3 They focus on the holistic care of patients, which ranges from prevention of oral disease and promotion of oral health to the alleviation of oral abnormalities, pain and disease. They also function in the fields of preventive, promotive and rehabilitative health, on primary, secondary and tertiary levels.4
The structural ills of the Health System which necessitated the founding of the dental therapy profession in South Africa have not yet been adequately corrected. The problems include, among other factors, a shortage and an inequitable distribution of oral health personnel,5-8 a lack of dental services at primary health care level,9 high attendance rates where services are available and accessible,10,11 and the limited range of services offered.12 Dental caries is a common childhood disease in the country despite the fact that National Oral Health surveys indicate a positive trend of decreasing severity.13-15 The latest survey found that more than 80% of dental caries in children was untreated.15 New oral health priorities, which include conditions such as periodontal disease, oral manifestations of HIV/AIDS, dental trauma, oral cancer and craniofacial anomalies, are now under consideration, adding to the burden.16,17
The urgent need to train a great many dental therapists to alleviate the shortage of oral health personnel has long been recognised.18 The human resource plan of the National Department of Health envisaged an increased annual output of 600 dental therapists from a baseline of 25.19 Traditionally, four methods of calculating health personnel requirements have been applied: healthcare demands, health-needs approach, personnel to population ratios, and service targets.20.21 Oral health personnel, including dental assistants, oral hygienists, dental therapists, and dentists, have been estimated to constitute 0.2 per 1000 population.22 A meagre dental therapist to population ratio of 0.13 per 10,000 has been calculated.23 At the time of the study, seven hundred and eight dental therapists were registered with the Health Professions Council of South Africa.24 Dental therapy training is currently offered at the Dental Schools of the Universities of KwaZulu-Natal and Sefako Makgatho
Health Sciences University. A survey of the application, enrolment and graduation records of the University of KwaZulu-Natal for the period 2001 to 2010 was recently performed. That study found a linear increase in enrolment from 60 to 81 and an upward shift of around a mean of 16 graduates per year.25
Training of dental therapists is also offered at Sefako Makgatho Health Science University and in view of the motivation to enhance the numbers of dental therapists in the country, a study of the contribution of that programme is warranted.
OBJECTIVES OF THE STUDY
-
To describe the demographic characteristics and trends in enrolments and graduations of dental therapy student cohorts of Sefako Makgatho Health Sciences University for the period 2004 to 2014.
-
To describe trends in the examination pass rates for the first, second and third years of study.
-
To determine the median number of students who completed their degrees and graduated within the regulation time.
MATERIALS AND METHODS
Study design
This was a cross-sectional descriptive study in which existing academic records were reviewed.
Target population
The study population consisted of the academic records of cohorts of dental therapy students who were enrolled at Sefako Makgatho Health Sciences University during the period 2004 to 2014.
Study sample
Every available record was studied, yielding a total of 423 files.
MEASUREMENTS
Academic records
Data related to the demographic characteristics of the students, the numbers enrolled, numbers who dropped out, and the numbers who graduated were acquired and then captured in Microsoft Excel software.
Definition of variables and terms
Age and gender refer to student age and sex as recorded in the academic records.
Population group breakdown of students into African, Indian, Coloured and White was applied according to the Population Registration Act of 1950.26
Regulation time is the period of time normally expected for completion of the degree (three years).
Throughput, quite simply, is how many students who started studying completed the course of study. This may also be measured by the number of students who do not "drop out".27
Ethical considerations
Ethical approval for the study was granted by the Ethics Committee of the Sefako Makgatho Health Sciences University (SMREC/D/1820/2017). Permission to conduct the study was granted by the Chief Executive Officer (CEO) of the Medunsa Oral Health Centre.
STATISTICAL ANALYSIS/HYPOTHESIS TESTING
Collected data were subjected to univariate and bivariate analysis in Statistical Analysis Software (SAS) software. Frequencies, medians and proportions were calculated. Chi-squared tests were performed to test the statistical significance of the differences in proportions.
Chi-squared tests for trends were performed to investigate trends in enrolments and examination pass rates.
The chosen significance level of the tests was a p-value less than 0.05.
RESULTS
Academic records of dental therapy student cohorts for the period 2004 to 2014 were analysed.

Demographic characteristics
The overall median number of enrolees in the first, second, and third years of study between the years 2004 and 2012 was 36 with an interquartile range of 32 to 39. Enrolments have been on an upward trajectory since 2012 when significant growth (28%) was experienced. The overwhelming majority (93.9%) of students were African. White, Coloured, and Indian students together comprised only 6.1% of the enrolees.

The median number of first year enrolees during the decade between 2004 and 2014 was 14 with an interquartile range of 10 to 20. A statistically significant (p< 0.05) sharp increase in enrolment was experienced in 2008. A steady increase in enrolment was recorded between the years 2010 and 2012. More female students than male students were enrolled. There was strong evidence of a trend of increased proportion of female student enrolment in the population (p< 0.05).
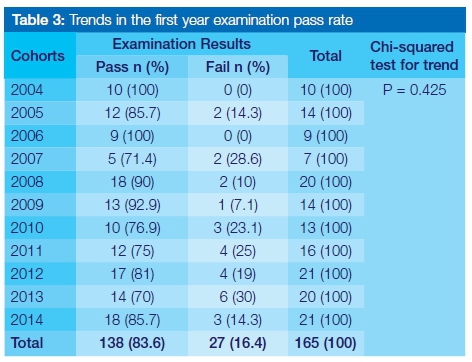
The mean pass rate during the decade between 2004 and 2014 was 83.6% (SD 10.6). There was insufficient evidence to reject the null hypothesis of no trend in the proportion of students who passed the examination in the population (p> 0.05).

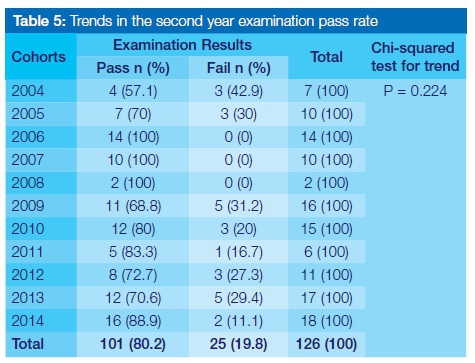
The median number of second year enrolees during the decade between 2004 and 2014 was 11 with an interquartile range of 7 to 16. A statistically significant (p< 0.05) sharp decrease in overall enrolment was experienced in 2008. Female students constituted 55.6% of the cohort. There was insufficient evidence to reject the null hypothesis of no trend in the proportion of female student enrolment in the population (p> 0.05).
The mean pass rate during the decade between 2004 and 2014 was 80.2% (SD 14.7). There was insufficient evidence to reject the null hypothesis of no trend in the proportion of students who passed the examination in the population (p> 0.05).
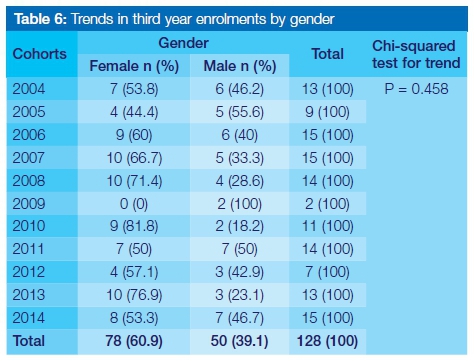
The median number of third year enrolees during the decade between 2004 and 2014 was 13 with an interquartile range of 9 to 15. A statistically significant (p< 0.05) sharp decrease in overall enrolment was experienced in 2008. Female students constituted 60.9% of the cohort. There was insufficient evidence to reject the null hypothesis of no trend in the proportion of female student enrolment in the population (p> 0.05).

The mean pass rate at the third year of study during the decade between 2004 and 2014 was 91.4% (SD 9.3). There was insufficient evidence to reject the null hypothesis of no trend in the proportion of students who passed the examination in the population (p> 0.05).

The median number of graduates per year was 11 with an interquartile range of 7 to 14. A statistically significant (p< 0.05) steep decline in overall graduations was experienced during the years 2005, 2009 and 2012 respectively. During the decade between 2004 and 2014, with the exception of 2005 and 2009, more females than males earned dental therapy degrees. There was insufficient evidence to reject the null hypothesis of no trend in the proportion of female student graduations in the populations (p> 0.05).

The median percentage of students who started the course, completed the degree and graduated within the regulation time during the decade between 2004 and 2014 was 45 with an interquartile range of 37 to 58.5. Nineteen percent (24/124) of students who started the course dropped out. A little less than a third (39/124) of the students took longer to qualify.
DISCUSSION
Trends in enrolments, examination pass rates and successful graduations of cohorts of dental therapy students at Sefako Makgatho Health Science University during the period 2004 to 2014 were examined.
Demographic characteristics
The current study observed a progressive rise in the proportion of female student enrolment during the decade between 2004 and 2014 (51.5 % in the first year, 55.6% in the second year, and 60.9% in the third year of study respectively). This study produced results which corroborate the findings of a great deal of work in the field of oral health research.28-30 The 60:40 female: male ratio in the third year of study is consistent with that reported by Singh and Combrink (2011).25 A possible explanation for the change in gender distribution might be that more male than female students either repeat or drop out of the course.
The demographics show that the overwhelming majority (94%) of the enrolees were African and that White, Coloured, and Indian students together comprised only 6% of the cohorts. The present findings seem to be consistent with those reported by Singh and Combrink (2011) which found that White and Coloured students are under-represented among dental therapy student registrations.25 A possible explanation for this might be A possible explanation for this might be that the results reflect the historical circumstances under which the dental therapy profession was introduced in South Africa.31,32 The low number of White, Coloured, and Indian students is an important issue for future research.
Enrolments
Relevant findings were that during the decade between 2004 and 2014 an average of 36 students (first, second and third year) were enrolled and that the maximum number of first year enrolment was 21. These results differ from those of Singh and Combrink (2011) who reported a substantially higher overall (81) as well as first year (30) enrolment at the Dental School, University of KwaZulu-Natal.25 In contrast to the declining number of applications for enrolment received at Sefako Makgatho Health Science University, the University of KwaZulu-Natal experienced an exponential increase during the period under review.25 However, the low combined overall enrolment at both dental schools implies that the proposal of the National Department of Health that the annual output of dental therapists be increased to 600 will remain a pipedream, unless factors that limit or restrict enrolment are addressed. These include, but are not limited to, the availability of preclinical and clinical training facilities and human resources.
An important finding was that enrolments went up 28% in the year 2013. This result, however welcome, is not very encouraging for the reason that in contrast to the increased first year enrolment experienced at the University of KwaZulu-Natal,25 this growth at Sefako Makgatho is attributable to an increase in enrolments at the second and third years of the course.
Examination pass rate
The results of this investigation show that the examination pass rate was intermediate in the first year, low in the second year and high in the third year of study. These results have not previously been described. It may be that the low examination pass rate in the second year of study is due to the fact that some of the students who transfer to dental therapy from other programs are underprepared.
Graduations
The study found that on average 12 students graduated each year during the decade between 2004 and 2014. This number of graduates is low compared with that (16) produced at the University of KwaZulu-Natal. However, the ratio of overall enrolment to the number of graduates at Sefako Makgatho Health Sciences University (1:3) compares favourably with that at the University of KwaZulu-Natal (1:5).25
The data showed that more female than male students earned dental therapy degrees at SMU. The findings of the current study are consistent with those of Singh and Combrink (2011) who found that 60.5% of graduates at the University of KwaZulu-Natal were female.25
Throughput
The current study found that less than half (45%) of all students who started the course during the decade between 2004 and 2014 finished it in the regulation time. This rather disappointing result has not previously been described. It is difficult to explain this result, but it may be largely related to the low second year examination pass rate and the 19% course dropout rate.
Limitations of the study
Data on the ages of the students were not available.
CONCLUSIONS
Both student enrolment and graduations are on an upward trajectory.
References
1. Saskatchewan Dental Therapists Association - http://www.sdta.ca/whatdt.html [Accessed 01 November 2017] [ Links ]
2. Taljaard L. T. Dental Education in relation to the needs of South African community. International Dental Journal 1985; 27:1-7 [ Links ]
3. Health Professions Council of South Africa. Regulations Defining the Scope of the Profession of Dental Therapy, 1993; No R1741. Available from: www.hpcsa.co.za. [ Links ]
4. Health Professions Council of South Africa - http://www.hpcsa.co.za/PB Dental Therapy [Accessed 01 November 2017] [ Links ]
5. Van Wyk PJ, Van Wyk C. Caries status and treatment needs in South Africa: report of the 1999-2002 National Children's Oral Health Survey. South African Dental Journal 2004; 59:238-42. [ Links ]
6. Department of Health. South African National Oral Health Strategy. Oral Health Directorate, Pretoria, 2005. Retrieved from http://www.doh.gov.za/docs/index.html/ [ Links ]
7. Department of Health. A National Human Resources for Health Planning Framework, Pretoria, 2006; 59. Retrieved from http://www.doh.gov.za/docs/index.html/ [ Links ]
8. Lalloo RA. National Human Resources Plan for Oral Health: is it feasible? South African Dental Journal 2007; 62:360-4. [ Links ]
9. Visser R, Bhana R, Monticelli F. National Health-care Facilities Baseline Audit, National Summary Report September 2012 Revised February 2013, Health Systems Trust. Available: www.doh.gov.za/docs/reports/2013/Healthcare.pdf [Accessed 25 September 2013]. [ Links ]
10. Bhayat A, Cleaton-Jones P. Dental clinic attendance in Soweto, South Africa, before and after the introduction of free primary dental health services. Community Dental Oral Epidemiology 2003; 31(2): 105-10. [ Links ]
11. Harkinson BN, Cleaton-Jones PE. Analysis of attendance rates at Soweto dental clinics 1995-2002. South African Dental Journal 2004; 59(4): 147-9. [ Links ]
12. Lesolang RR, Motloba DP, Lalloo R. Reasons for tooth extraction at the Winterveldt clinic: 1998-2002. South African Dental Journal 2009; 64:214-8. [ Links ]
13. Department of Health. National Oral Health Survey: South Africa 1988/89. Pretoria: Government Printer; 1994. [ Links ]
14. Department of Health. Report: National Children's Oral Health Survey. South Africa; 2003: 1-18. [ Links ]
15. van Wyk PJ, van Wyk C. Oral health in South Africa. International Dental Journal 2004 ;54(6 Suppl 1):373-7. [ Links ]
16. Petersen PE. Priorities for research for oral health in the 21st Century - the approach of the WHO Global Oral Health Programme. Community Dental Health 2005; 22:71-4. [ Links ]
17. Department of Health. South African Oral Health Strategy. Retrieved from www.health.gov.za/.../strategic.../130-sd2005?...south-african-national-oral-health-stra. [Accessed 01/11/2017] [ Links ]
18. Rossouw L. Dentists, The Oral Health Team, Their Numbers, Distribution and Income Profiles in South Africa: 1995-2010 AD. Final Memorandum for the Dental Association of South Africa Health Services Committee. 1996. [ Links ]
19. Department of Health. HRH Strategy for the Health Sector: 2012/13 - 2016/17 Retrieved from http://www.hst.org.za/publications/NonHST%20Publications/hrh_strategy-2.pdf [Accessed 23/11/2017]. [ Links ]
20. Hall T, Mejia A. Health manpower planning: principles, methods, issues. 1978, Geneva: World Health Organization. [ Links ]
21. Green A. An Introduction to Health Planning in Developing Countries: Oxford University Press, 1992. [ Links ]
22. World Health Organization. Dentistry personnel density (per 1000 population) Retrieved from http://data.un.org/Data.aspx?q=dentistry&d=WHO&f=MEASURE_CODE%3AHRH_28 [Accessed 23/11/2017]. [ Links ]
23. Department of Health. A National Human Resources for Health Planning Framework, Pretoria, 2006; 59. Retrieved from http://www.doh.gov.za/docs/index.html/ [ Links ]
24. HPCSA. Statistics. Retrieved from www.hpcsa.co.za/Publications/Statistics [Accessed 23/11/2017]. [ Links ]
25. Singh PK, Combrink M. Profile of the dental therapy graduate at the University of KwaZulu-Natal. South African Dental Journal 2011; 66(10): 468,470-4. [ Links ]
26. Union of South Africa (1950). Population Registration Act, No. 30 of 1950, in SA Government Gazette. [ Links ]
27. van Broekhuizen H. In: FACTSHEET: How many South African students graduate? December 2016. Available https://africacheck.org/factsheets/factsheet-many-south-african-students-graduate/ [Accessed 01 November 2017]. [ Links ]
28. Nash DA, Friedman JW, Kardos TB, Kardos RL, Schwarz E, Satur J, et al. Dental therapists: a global perspective. International Dental Journal 2008; 58: 61-70. [ Links ]
29. Murray JJ. Better opportunities for women dentists: a review of the contribution of women dentists to the workforce. British Dental Journal 2002; 192:191-6. [ Links ]
30. Sinkford JC, Valachovic RW, Harrison S. Advancement of women in Dental Education. Journal of Dental Education 2003; 67:79-83. [ Links ]
31. Prinsloo PM. The losses/wastage/attrition of dental therapists in South Africa. Oral Hygiene Association of South Africa 1994; 6: 4-7. [ Links ]
32. Prinsloo PM. The Dental Therapy Profession in South Africa: a survey and evaluation 1967 - 1992. Journal of the Dental Association of South Africa 1993; 48: 617-22. [ Links ]
 Correspondence:
Dr sibusiso rockfort Mthethwa:
Medunsa Campus, PO Box D24
Sefako Makgatho Health Sciences University, 0204.
Tel: 012 521 5888.
Fax: 012 512 4274.
E-mail: rocky.mthethwa@smu.ac.za

