


Servicios Personalizados
Articulo
 Inglés (pdf)
 Articulo en XML
 Referencias del artículo
Indicadores

Links relacionados
-
 Citado por Google
 -
 Similares en Google
Compartir

 Permalink
South African Dental Journal
versión On-line ISSN 0375-1562
versión impresa ISSN 0011-8516
S. Afr. dent. j. vol.73 no.4 Johannesburg may. 2018
RESEARCH
Screening of digital panoramic radiographs for changes in bone mineral density with advancing patient age
Kumar MI; Holmes HII; Stephen LXGIII
IBDS, MSc. Division of Oral Medicine and Periodontics, Faculty of Dentistry, University of the Western Cape
IIBChD, MSc, MChD. Division of Oral Medicine and Periodontics, Faculty of Dentistry, University of the Western Cape
IIIBChD, PhD. Head of Diagnostics Cluster, Faculty of Dentistry, University of the Western Cape
ABSTRACT
INTRODUCTION: Osteoporosis afflicts millions of people world wide. Chronic and complex, of multifactorial aetiology and insidious progress, creating huge medical and economic burdens it may lead to innumerable sequelae. Increased life expectancies complicate the demographics.
AIMS AND OBJECTIVES: To assess the efficacy of digital panoramic radiographs as a triage screening tool for osteoporotic changes, using the Image J software.
DESIGN AND METHODS: Evaluation of 150 digital panoramic radiographs of female patients referred for routine radiological imaging and stratified into three groups by age (A: 20-40 years, B: 41-60 years, and C: >61 years respectively). The panoramic mandibular index (PMI), mandibular cortical width (MCW) and pixel intensity (PI), were recorded for each image using the Image J software (1.48v) and assessed for correlation with increasing age and between the indices.
RESULTS: Statistically significant associations were found between the indices and with patients' age. Abnormal (divergent) readings increased with advancing age.
CONCLUSIONS: Routine digital panoramic radiographs can provide useful preliminary information with respect to the risk of a female developing osteoporosis. There is potential for triage screening and subsequent referral, at no additional costs. The patient's age is an important risk indicator for osteoporosis.
Keywords: Digital Panoramic radiographs, triage screening, osteoporosis, bone mineral density, radiographic indices.
INTRODUCTION AND LITERATURE REVIEW
Osteoporosis is defined as Ά medical condition in which the bones become brittle and fragile from loss of tissue, typically as a result of hormonal changes, or deficiency of calcium or vitamin D'. It has also been operationally defined by the WHO on the basis of bone mineral density (BMD) assessment.
Increased skeletal porosity has been associated with more than 8.9 million fractures annually worldwide.1 These are mostly low-level and non-traumatic varieties and commonly involve the hip, vertebrae and the forearm bones.2,3 The fracture risk in women shows an exponential rise following the onset of menopause, whereas the prevalence in men has been observed to increase at a more advanced age group (generally >7th decade of life).4
Several pitfalls have been identified in the diagnostic accuracy of osteoporosis. Presently the most widely accepted diagnostic criterion is a T-score value of 2.5 standard deviations (SD's) or more below the average BMD value for a healthy, young female between the age of 25-45 years. A T-score value between -2.5 and -1.0 SD Is designated as osteopenia.5 Several diagnostic tools have been developed based on the above criteria such as the single-energy photon absorptiometry (SPA), dual-energy photon absorptiometry (DPA), dual energy X-ray absorptiometry (DXA), radiographic absorptiometry (RA) and quantitative computed tomography (QCT). The DXA scan is the gold standard and is the most widely utilized diagnostic tool. It offers high precision,6 a lower radiation exposure, determination time and cost as compared with a conventional CT scan and MRI (UNESCAR 2000).7 However, DXA scanning incurs high capital costs, is non-portable and currently has limited availability at primary health care centres around the world.
The search for an effective, low-cost, easily available triage screening tool has led researchers to consider the potential of dental radiographs for assessing changes in bone density. The association between osteoporosis and dental bone loss was first proposed in 1960 by Groen et al.8 and corroborated by various studies showing BMD values in the mandible to be comparable with calculations from the lumbar spine, femoral neck and the forearm.9-11 In addition, the mandible presents several measurable structures on dental radiographs that could demonstrate reproducible BMD values.12 These include thinning of the lower cortical mandibular border, decrease in density and loss of connectivity of the mandibular cancellous bone component with advancing age.13 Panoramic imaging is preferred as it offers several advantages. These include a view of both dental arches and lower facial skeleton in a single image, low radiation exposure, patient comfort and accessibility. Furthermore, it is routinely employed in the initial assessment of all dental patients.
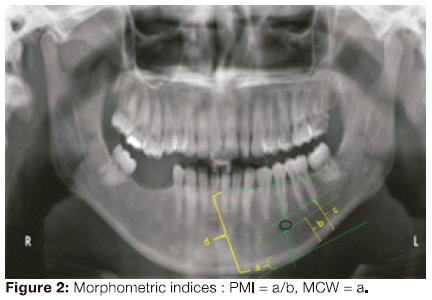
Radiographic indices for triage screening: Both the trabecular and the cortical component of the jaw bones are affected in generalised osteoporosis. Several studies since 1994 have been able to demonstrate a significant correlation between BMD and the mandibular cortical width (thickness and Integrity).12,14,15 Various radiographic indices have been developed to quantitatively calculate this bone loss, in a reproducible and objective manner. These have been broadly classified into: Morphometric (linear measurements made on a Panoramic radiograph) and Densitometrie (measurement of optical density followed by comparison with a standard). This formed the basis for our selection of two morphometric indices namely, MCW/MI (mandibular cortical width, also known as the mental index) and the PMI (ratio of MCW and the linear distance between the mental foramen and the lower mandibular cortical border) for this study.
The advent of digital radiography, with superior post-processing tools, has helped in further revolutionizing the ongoing search for a sensitive screening tool for quantitative and qualitative assessment of bone density and architecture. Indices such as Pixel Intensity and Fractal analysis are being investigated for early detection of such changes.
In the present study, the efficacy of digital panoramic radiographs In detecting changes in bone mineral density was evaluated by recording and comparing three radiographic bone density indices. These included: (a) Two morphometric/ linear measurements - PMI (panoramic mandibular index) and MCW (mandibular cortical width) and (b) Digital radiographic index for measuring densitometric changes in bone that is PI (pixel intensity).
PMI16 refers to the ratio between the lower mandibular cortical width in the mental area and the linear distance between the lower mandibular margin and the mental foramen's upper or lower margin. A value of < 0.30 was regarded as an osteoporotic related diagnosis.9,17 Separate studies by Taguchi et al.18 in 2006 and Devlin and Horner12 in 2002 have found MCW (the lower mandibular cortical width) measurements of <3mm to be consistent with osteopenia. PI gives a measure of the radiographic density [the blackness or whiteness of a region on the radiograph on a grey scale from zero (totally black) to the highest value (totally white)]. Pixels refer to the array of small square or rectangular areas making up a digital image and having an assigned numeric value that contributes to the pixel intensity of that image. The grey scale depends on the number of binary digits or bits - the smallest unit of data on a computer. A 12-bit monitor gives a grey scale range of 212, that is, 0 to 4096. It has been recognised as a simple and useful method to detect BMD alterations.19
DESIGN AND METHODS
A cross-sectional, analytical, record based study was conducted. Evaluation of 150 panoramic radiographic images taken between 2010-2012 were accessed on the databases of the UWC Centre's digital panoramic unit- the KODAK 8000 Digital Panoramic System with a 12-bit charged couple device (CCD) optical fibre sensor and a dental imaging software 6.12.15.0.
The present study comprised female patients stratified by age: groups A (20-40 years), Β (41-60 years), and C (>61 years) respectively. These age groups were selected based on the fact that peak bone mass is attained by early adulthood20 and that the age-related bone loss in an individual begins around the third decade of life.21 A total of fifty patients were evaluated within each of the three groups selected through a simple random sampling technique. Patients with any cystic or neoplastic (radiopaque/ radiolucent) lesions in the regions of interest, metabolic bone conditions or those on long term medication such as corticosteroids, diuretics or exogenous hormones, and images with unclear delineation of the upper and lower cortical margins of the mental foramen on both the right and left sides were excluded from this study. Other exclusion criteria also included female patients below 20 years of age. To ensure standardization, only radiographs using the exposure parameters of 70-75KVp voltage, 12mA current and an exposure time of 13.9 seconds were included in the study. All the images were viewed on the computer screen attached to the unit in a room with subdued lighting. Further analysis of each of the 12-bit gray-scale image (Pixel intensity and morphometric) was done using the Java based Image-J software (1.48v). The PI of each image was recorded from two regions of interest (ROI), chosen to avoid any superimposed anatomic structures or regions of alveolar bone affected by periodontal conditions (fig.1, 2). ROI-1 represented a 0.5x0.5cm2area mesial to the gonial angle and ROI-2 represented a 0.5x0.5cm2 area in the mandibular canine-premolar area mesial to the mental foramen. A mean from the two readings was calculated. The magnification factor (1.2x) of the panoramic image was taken into consideration during all the above calculations.

RESULTS
280 images were screened, but 130 were excluded due to mandibular pathology, cone cuts, ghost figures or unclear foramen margins.
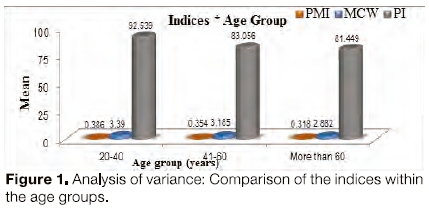
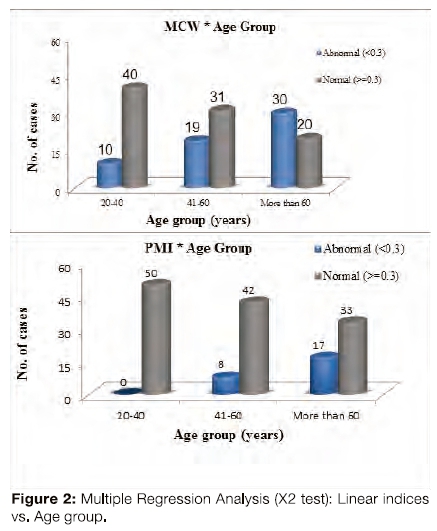
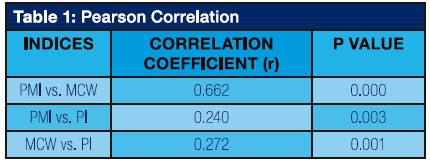
Of the sample 150 films, 25 showed abnormal PMI readings and 59 showed abnormal MCW readings. Comparison of the means of these indices within the age-groups was done using ANOVA (Figure 1). The mean PI as well as the two morphometric indices (PMI, MCW) showed a statistically significant difference in their means between the three age groups. PI values declined with increasing age (p= 0.000). The χ2 test was used to show association between age group and the bone density (Figure 2). Abnormal PMI values were directly proportional to advancing patient age and were statistically significant (p< 0.001). These values were 0%, 16%, 34% for groups A, B, and C respectively. MCW readings also showed a significant correlation with age (p<0.001) and the number of abnormal readings increased from group A to C (Group A -20%, B- 38%, C- 60%). Pearson correlation calculation between the individual indices was observed to be statistically significant between PI and both the linear indices PMI (p= 0.003, r= 0.240) and MCW (p= 0.000, r= 0.662) table 1).
Discussion
Several studies have established a statistically significant relationship between the morphometric indices (PMI, MCW) and BMD and the authors have recommended their usage as a screening tool.12,22 The investigators of this study found a mean PMI value of 0.35. These findings are similar to other studies thai reported normal PMI values to range between 0.31-0.38.10,16,23 Drowzdzowska et al.11 in 2002 stated that the presence of marked differences in PMI values from the mean in a given population group may be used as an indicator of changes in bone density.
The mean Mandibular Cortical Width (MCW) value obtained in this study was 3.15mm with a statistically significant difference in the values observed between the three age-groups. Devlin and Horner12 (2002) chose a cut-off value of 3mm in their study, while Klemetti et al.24 in 1997 suggested 4mm as the average threshold value, values below which should prompt referral for a DXA evaluation.
Pixel Intensity analysis is an easily calculable and objective index. It is sensitive enough to pick up subtle changes in the trabecular bone. It is, however, a technique-sensitive index affected by changes in the voltage and current settings of the radiographic units as well as the software used for post-processing analysis. In recent years much research has been done to develop computer-assisted diagnostic techniques (CAD systems). This is to increase the diagnostic accuracy, reduce the inter-observer subjectivity and human error25 and save the time consumed in manual calibration of linear measurements from dental radiographs. This prompted the use of the Java-based Image-J software (1.48v) onto which each of the digital panoramic radiographs was uploaded for automated measurement of the linear indices (PMI, MCW) following the identification of the important landmarks (mental foramen, inner and outer margins of the mandibular cortex). It also provided a sensitive tool for pixel intensity calculation from the two regions of interest (ROI's). A positive correlation between Pixel Intensity and the morphometric indices PMI (p= 0.003, r= 0.240) and MCW (p= 0.001, r= 0.270) as well as between the two linear indices (p= 0.000, r= 0.662) was evident. There was also a strong association between Pixel Intensity (PI) and the patient's age. These two associations support the conclusion that Pixel Intensity has potential use as a screening tool for the identification of patients with undetected bone density alterations and must be investigated in a prospective study cohort to validate its value in detecting osteoporosis.
This study confirms that age is an important risk factor for bone density alterations. The number of abnormal readings in each of the indices was observed to rise exponentially with increasing age. This finding supports the work of other researchers15,23 and as such has also been used in various clinical decision rules (CDR's) such as OSIRIS (The Osteoporosis Index of Risk), ABONE (age, body size, no estrogen) and others. The overall fracture risk has been seen to rise with advancing age;26,27 Wactawski Wende28 in 1996 also observed changes in the mandibular alveolar crest height and an increased rate of tooth loss with osteoporosis but found no difference in the level of clinical attachment in their study sample and believed age of the patient as an important determinant.
Conclusions and recommendations
Within the limits of this study, assessment of routinely done digital Panoramic radiographs can provide useful information with respect to bone density alterations and thereby a patient's risk for developing osteoporosis. It may help facilitate early detection of a mostly asymptomatic condition before an actual fragility fracture occurs as well as in early intervention which will be beneficial for the patient.
It is recommended that further research be initiated into the Pixel Intensity analysis. The presence of various superimposed/ ghost images (airway shadow, soft palate, tonsils, hyoid bone etc) on the Panoramic radiograph make absolute standardization of PI difficult. Muscular attachments and variability in the amount of loading in different areas of the mandible also affects the mineral content of the area and hence in the selection of ROI's for the study. Von Wovern29 in 1982, Von Wovern and Stoltze30 in 1979 and Tosoni et al.31 in 2006 each found the mandibular inferior cortical bone in the canine-premolar region to be the ideal site for radiographically detecting osteopenic and osteoporotic bone changes. It has also been observed that broadly the usefulness of PI as a screening tool has been studied by comparison to the change in values obtained with other quantitative variables or DXA scan results and no actual normal range of values has been established. Similar inferences have been drawn by other authors. Chan32 in 2003 pointed out this important fact, further stating that obtaining a strong correlation (r) value between two quantitative variables does not automatically imply good agreement. He also found a considerable overlap amongst the different variables used. Hence, this study suggests that these patients, especially those in group Β and C, with low PMI (<0.3), MCW (<3mm) and PI, have an increased likelihood of having osteoporosis and be referred for a DXA scan.
Age is a useful clinical risk parameter for osteoporosis and as such was found to be an important determinant for PI as well as the linear measures PMI and MCW. Formatting of a clinical protocol is recommended whereby patients above 40 years of age, especially women, are routinely screened for osteoporosis thereby lessening the burden this condition places on the world community. General dentists and periodontists can also easily incorporate this into their clinical practices and be on the alert whenever older female patients with existing periodontitis present. Another added advantage is that dentists can gauge the prognosis/ risk of future periodontal breakdown and tooth loss in these patients.33
ACRONYMS
ABONE: age, body size no estrogen BMD : bone mineral density
CAD systems : computer-assisted diagnostic techniques
CDR's : clinical decision rules
DRA: dual-energy photon absorptiometry
DXA : dual energy X-ray absorptiometry
MCW: mandibular cortical width
MCW/MI: mandibular cortical width, also known as the mental index
OSIRIS : The Osteoporosis Index of Risk PI: pixel intensity
PMI: panoramic mandibular index the ratio of MCW and the linear distance between the mental foramen and the lower mandibular cortical border
OCT : quantitative computed tomography
RA: radiographic absorptiometry
ROI: regions of interest
SPA: single-energy photon absorptiometry
References
1. WHO, 2004. WHO Scientific Group on the Assessment of Osteoporosis at Primary Health Care Level. Geneva: WHO Press. [ Links ]
2. Kanis JA. Osteoporosis and osteopenia. Journal of Bone and Mineral Research, 1990; 5: 209-11. [ Links ]
3. Melton LJ, III. Adverse outcomes of osteoporotic fractures in the general population. Journal of Bone and Mineral Research, 2003;18(6): 1139-41. [ Links ]
4. Cummings SR, Melton LJ, III. Epidemiology and outcomes of osteoporotic fractures. The Lancet 2002;359:1761-67. [ Links ]
5. WHO, 1998. Guidelines for Preclinical Evaluation and Clinical Trials in Osteoporosis. Geneva: WHO Press. [ Links ]
6. Classey JL, Kanaley JA, Widerman L, et al. Validity of methods of body composition assessment in young and older men and women. J Appl Physiol. 1999;86:1728-38. [ Links ]
7. Lukaski HC. Soft tissue composition and bone mineral status: evaluation by dual-energy X-ray absorptiometry. J Nut. 1993;123: 43843. [ Links ]
8. Groen JJ, Duyvensz F, Halsted JA.. Diffuse alveolar atrophy of the jaw (non-inflammatory form of paradental disease) and pre-senile osteoporosis. Gerontol Clin, 1960;2: 68-86. [ Links ]
9. Klemetti E, Vainio P, Lassila A, Alhana E.. Cortical bone mineral density in the mandible and osteoporosis status in post-menopausal women. Scand J Dent Res. 1993;101: 219-23. [ Links ]
10. Horner K, Devlin H. The relationships between two indices of mandibular bone quality and bone mineral density measured by dual energy X-ray absorptiometry. Dentomaxillofac Radiol. 1998;27: 17-21. [ Links ]
11. Drozdzowska B, Pluskiewicz W, Tarnawska B. Panoramic based mandibular indices in relation to mandibular bone mineral density and skeletal status assessed by dual energy X-ray absorptiometry and quantitative ultrasound. Dentomaxillofac Radiol. 2002;31:361-7. [ Links ]
12. Devlin H, Horner K. Mandibular radiomorphometric indices in the diagnosis of reduced skeletal bone mineral density. Osteoporos Int' 2002;13:373-. [ Links ]
13. Devlin H. Identification of the risk for osteoporosis in dental patients. Dent Clin Ν Am. 2012;56: 847-61. [ Links ]
14. Klemetti E, Kolmakov S, Kroger H. Pantomography in assessment of the osteoporosis risk group. Scand J Dent Res. 1994;102: 68-72. [ Links ]
15. Yasar F, Akgünlü F. The differences in panoramic mandibular indices and fractal dimension between patients with and without spinal osteoporosis. Dentomaxillofac Radiol. 2006; 35:1-9. [ Links ]
16. Benson BW, Prihoda TJ, Glass BJ. Variations in adult cortical bone mass as measured by a panoramic mandibular index. Oral Surg Oral Med Oral Pathol. 1991;71: 349-56. [ Links ]
17. Ledgerton D, Horner K, Devlin H, Worthington H.. Panoramic mandibular index as a radiomorphometric tool: An assessment of precision. Dentomaxillofac Radiol. 1997;26(2): 95-100. [ Links ]
18. Taguchi A, Tsuda M, Ohtsuka M, et al. Use of dental panoramic radiographs in identifying younger postmenopausal women with osteoporosis. Osteoporos Int. 2006;17: 387-94. [ Links ]
19. Law AN, Bollen AN, Chen S-K. Detecting osteoporosis using dental radiographs: A comparison of four methods. The Journal of the American Dental Association 1996;127: 1734-42. [ Links ]
20. Ralston SH. Genetics of osteoporosis. Proc Nutr Soc 2007;6(2): 15865. [ Links ]
21. Rosenberg AE. Skeletal system and soft tissue tumours. In: F. J. Schoen, ed. Robbins Pathologic Basis of Disease. Philadelphia, Pennsylvania: W.B. Saunders, 1994;1213-72. [ Links ]
22. Duncea I, Pop A, Georgescu CE. The relationship between osteoporosis and the panoramic mandibular index. International Journal of the Bioflux Society 2013; 5(1). [ Links ]
23. Ledgerton D, Horner K, Devlin H, Worthington H. Radiomorphometric Indices of the mandible in a British female population. Dentomaxillofac Radiol. 1999;28:173-81. [ Links ]
24. Klemetti E, Kolmakov S. Morphology of the mandibular cortex on panoramic radiographs as an indicator of bone quality. Dentomaxillofac Radiol.1997;6: 22-5. [ Links ]
25. Devlin H, Horner K. Diagnosis of osteoporosis in oral health care. J Oral Rehab.2008;35:152-7. [ Links ]
26. Ensrud KE. Epidemiology of fracture risk with advancing age. J Gerontol A Biol Sei Med Sei. 2013;68(10): 1236-42. [ Links ]
27. Seeley DG, Browner WS, Nevitt MC, Genant HK, Scott JC, Cummings SR. Which fractures are associated with low appendicular bone mass In elderly women? The Study of Osteoporotic Fractures Research Group. Ann Int Med. 1991;115:837-42. [ Links ]
28. Wactawski-Wende J, Grossl SG, Trevisan M, Genco RJ, Tezal M, Dunford RG, et al. The role of osteopenia In oral bone loss and periodontal diseases. J Periodontol.1996;67:1076-84. [ Links ]
29. Von Wowern N.. Microradiographic and hlstomorphometric indices of mandibles for diagnosis of osteopenia. Scand J Dent Res.1982;90: 47-63. [ Links ]
30. Von Wowern N, Staitz, K. Age differences in cortical width of mandibles determined by histoquantitatlon. Scand J Dent Res.1979;87: 225-33. [ Links ]
31. Tosoni GM, Lurie AG, Cowan AE, Burleson JA. Pixel intensity and fractal analyses: detecting osteoporosis in perimenopausal and postmenopausal women by using digital panoramic images. Oral Surgery Oral Medicine Oral Pathology Oral Radiology and Endodontology 2006;102: 235-41. [ Links ]
32. Chan YH. Biostatistics 104: Correlation analysis. Singapore Med J. 2003;44:614-9. [ Links ]
33. Tözüm TF, Taguchi A. Role of dental panoramic radiographs in assessment of future dental conditions in patients with osteoporosis and periodontitis. NYSDJ, 2004;70(1): 32-5. [ Links ]
 Correspondence
Meeru Kumar
BDS, MSc. Division of Oral Medicine and Periodontics
Faculty of Dentistry, University of the Western Cape
Address: 845, Lagrange street, Unit 1
West Ftoxbury, Massachusetts, USA. 02132
Contact: +16179595156
kmrmeeru@gmail.com

