


Services on Demand
Article
 English (pdf)
 Article in xml format
 Article references
Indicators

Related links
-
 Cited by Google
 -
 Similars in Google
Share

 Permalink
South African Dental Journal
On-line version ISSN 0375-1562
Print version ISSN 0011-8516
S. Afr. dent. j. vol.73 n.1 Johannesburg Feb. 2018
RESEARCH
Comparison of two methods of predicting mesiodistal widths of permanent canines and premolars in a sample of black South Africans
MPS SethusaI; S BrijlallII; DP MotlobaIII
IB Diag Rad, BDS, PDD (Orthodontics), M Dent (Orthodontics), PG Dip (Health Education). Head Department of Orthodontics, School of Oral Health Sciences. Sefako Makgatho Health Sciences University
IIBDS, PDD (Implantology). Dentist Western Cape Department of Health
IIIBDS, MPH (Epid), MDent (Comm.Dent). Head Department of Community Dentistry, School of Oral Health Sciences, Sefako Makgatho Health Sciences University
ABSTRACT
INTRODUCTION: Accurate tooth size prediction of permanent successor teeth is important for treatment planning during the mixed dentition stage
OBJECTIVES: To compare and determine the accuracy of two methods used to predict mesiodistal widths of permanent canines, first and second premolars in a sample of Black South Africans
METHODS: Measurements of teeth were performed on study models of a sample of 100 children (50 males and 50 females) aged between 17 and 21 years. Digital calipers, accurate to 0.05mm. were used. Estimations of the widths of the permanent canines, first and second premolars (C+P1+P2) were performed for mandibular and maxillary arches using the Schirmer and Wiltshire and the Modified Tanaka-Johnston prediction methods. The estimated (C+P1+P2) values were then compared with measurements of the actual teeth on the study models
RESULTS: Males presented significantly larger mesiodistal tooth dimensions than females. The Modified Tanaka-Johnston equation is accurate for females but overestimates actual tooth measurements for males. The Schirmer and Wiltshire method is accurate for male maxillary and female mandibular tooth sizes but overestimates male mandibular and underestimate female maxillary tooth sizes
CONCLUSION: Both methods have deficiencies; however the Modified Tanaka-Johnston equation proved preferable because it overestimates rather than underestimates actual tooth sizes
Keywords: prediction; mesiodistal widths; Moyers method; Tanaka and Johnston equation
INTRODUCTION
Tooth size prediction and space analysis are an essential part of orthodontic treatment planning in the transitional dentition stage when it is critical to establish whether or not the available arch space is sufficient to accommodate all the permanent teeth. During the transitional dentition stage the permanent canine, first and second premolars are usually not clinically visible and accessible for measurement of their actual mesiodistal widths.1-3 It is hence necessary to estimate the mesiodistal dimensions of these teeth to enable treatment planning. The accuracy of prediction methods is critical in orthodontic management, since inaccurate estimation could compromise any treatment and potentially result in failed intervention or extended treatment time.4,5
LITERATURE REVIEW
Most orthodontists use the Moyer's4,6,7 and the Tanaka and Johnston8,9 methods to estimate the widths of the canines, the first and second premolars. The Moyer's prediction table method was the first used to predict widths of permanent teeth, hence its popularity and status as reference point. This method was derived from North American Caucasian subjects, which makes it most applicable and reliable in similar populations.10 The Moyers tables present two major shortcomings; first, this method has limited applicability among different ethnic groups. A recent meta-analysis found that the Moyer's method cannot be "universally applied without question", hence the need to develop population specific prediction tables which may counteract the overestimation errors possible when using Moyer's tables.6,10 Secondly, the prediction tables are considered cumbersome and not easy to use, when compared with regression equations. Tanaka and Johnston developed a regression equation based on a sample of 506 Caucasian children.6 In predicting the dimensions of permanent (C+P1+P2) the equation requires that half the sum of the widths of the mandibular incisors is added to 11.0 for maxillary teeth and 10.5 for mandibular teeth. However, and in a manner similar to its predecessors, this prediction method is not applicable across all races and ethnic groups, especially non-Caucasian samples.6,8,11
Two studies undertaken among black South Africans showed that the Moyers and the Tanaka and Johnston methods were inadequate in their prediction and needed modifications.12,13 It was further found that these methods underestimated tooth dimensions in South African populations, and failed to account for gender differences. In addressing these problems, Khan, Seed-at and Hlongwa12 applied the Tanaka and Johnston approach to develop a regression model more applicable to black South Africans. Their new equation for males calculated the maxillary (C+P1+P2) per quadrant as = 8.31 mm + 0.62x and the mandibular (C+P1+P2) per quadrant as = 7.15 mm + 0.67x, where x is the sum of the widths of the mandibular incisors.
The Moyers tables and the Tanaka and Johnston equations have indeed undergone modification and adaptions worldwide to conform to the norms of local population groups. Specific models are available for Chinese,8 Jordanians,14 Italians,15 Africans,11,16 Thai,17 Malay18 and other groups. In South Africa, modifications to these methods were tested among black Africans by Schirmer and Wiltshire13, and by Khan et al.12, under different settings and time. In the South African context, the methods used for blacks to replace Moyers tables and Tanaka and Johnston equations are Schirmer and Wiltshire and Modified Tanaka-Johnston by Khan et al., respectively.13,12
The aim of this study was to apply the Schirmer and Wiltshire (SaW) and Modified Tanaka and Johnston (MTJ) methods to a sample drawn from the black South African group to determine which method yielded the more accurate prediction of mesiodistal widths of canine, and premolars.
METHODS
Study design
Cross-sectional survey of pre-treatment orthodontic study casts (maxillary and mandibular arches).
Study Setting
The research was undertaken in the Department of Orthodontics at the Sefako Makgatho Health Sciences University, Medunsa Oral Health Centre. Data used in this study was based on the archived study casts of patients attending the clinic.
Study Population
Orthodontic study casts of black South African patients were sourced from the Department of Orthodontics at the Sefako Makgatho Health Sciences University, Medunsa Oral Health Centre. A sample estimation of 100 was derived, using EpiTM 7 at 95% confidence level and 5% confidence limits with the expected frequency of 8%, from a total number of 813 black patients between the ages of 17- 21who consulted during the year 2011. The sample comprised equal groups of the models of 50 males and of 50 females, all having Class 1 molar relationships with all permanent teeth present up to the first permanent molar in all quadrants.
The inclusion criteria required that all permanent teeth were fully erupted and relatively well aligned, and the study models were of good quality with no fractures, voids, or abnormalities. Excluded from the sample were models of patients who were of a different race group, whose ages were outside the limits or had severe malocclusions such as deep bites, excessive crowding, hypoplastic teeth, multiple spacing and diastemas, occlusal wear, missing permanent teeth, retained deciduous teeth or evident tooth size discrepancies
Determination of mesiodistal measurements (widths)
All measurements were carried out by the principal researcher, using an electronic digital Vernier caliper (Sylvac, Fowler). The caliper was calibrated in 0.5 millimetres and values recorded to two decimal places. A random sample (10%) of orthodontic casts were selected and re-measured by the principal researcher and by a second researcher to determine reliability of data.
Mesiodistal widths were measured and recorded for the four man-dibular permanent incisors, maxillary and mandibular permanent canines and premolars.
Data analysis
Data were entered into a computer and analysed using SAS for Windows version 9.2. An independent sample Student t-test was used to assess the differences in total widths (C+P1+P2) between the actual and predicted values. These tests were stratified by gender. Pearson correlations values were calculated to measure the strength of association.
Ethical Clearance
Permission to undertake this research was granted by the Medunsa Research and Ethics Committee, (Project: MREC/D/47/2011).
RESULTS
The sample size of 100 was considered adequate based on the Central Limit theorem,19 similar studies12,13,20,21 and objectives of the study.
(i) Reliability test
The blinded repeated measurements of 10 casts revealed almost perfect correlation, and validation of the reproduc-ibility of measurements. The intra-rater and inter-rater coefficients were extremely high, indicative of excellent correlation (r>0.90) in both cases.
(ii) Statistical tests of means
Descriptive analysis of the mesiodistal widths (C+P1+P2) in both arches indicate a significant gender difference in this parameter. Males presented with significantly larger teeth than females in both the maxilla and the mandible (P values, 0.00017 and 0.0002) respectively. (Table 1).
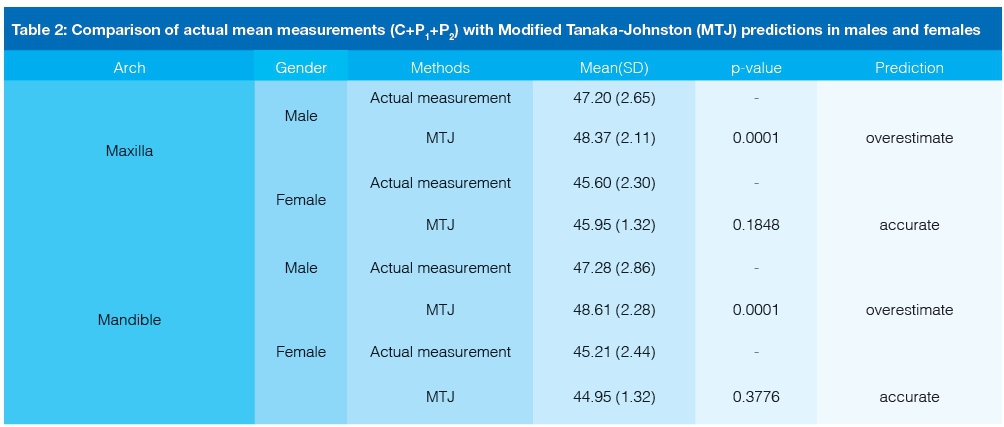
The paired t-test in males revealed significant differences between predicted (MTJ) and the actual mesiodistal measurements, at P<0.000 for both the maxillary and mandibular arches. In both instances the MTJ method overestimated the mesiodistal widths of the permanent teeth. (Table 2) Analysis of the female data yielded insignificant differences in both arches, P=0.1848 and 0.3776 respectively for maxilla and mandible. (Table 2). These findings can be interpreted to mean that the Modified Tanaka-Johnston method fails to predict with precision the actual dimensions of permanent (C+P1+P2) in males. In females however, this prediction method was shown to be comparatively accurate.
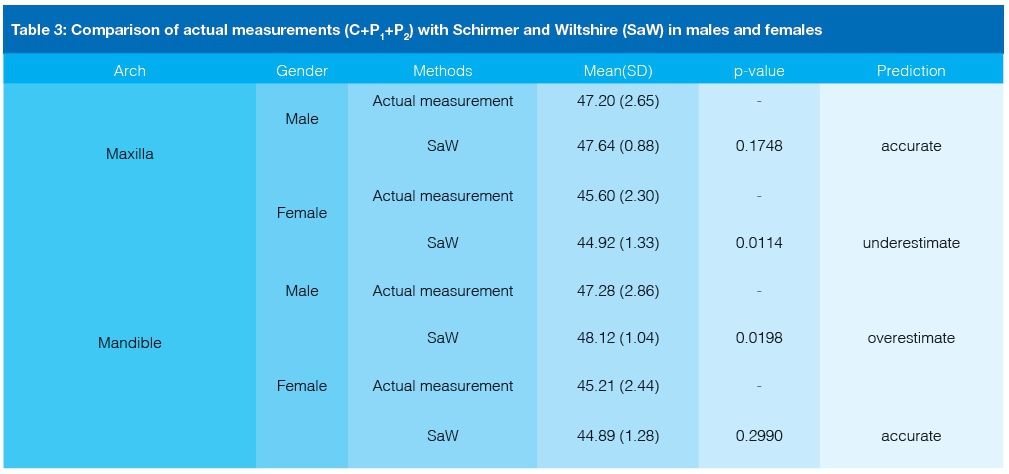
Comparison of the mesiodistal widths of teeth between the SaW predicted data and the actual values show mixed results for gender and arch. In the maxillary arch, there is a significant difference between the measured and predicted mesiodistal dimensions of permanent teeth of females (P=0.0114); for males the p-value of 0.1748 is indicative of a lack of statistical significance. Mandibular arch discrepancies are however significant for males (p=0.0198), and for females, although at a lower level (p=0.2990). (Table 3).
DISCUSSION
That there are racial and ethnic differences in tooth dimensions is well established in the literature, with blacks having larger teeth than most other population groups.14,18,20 A comparison of the mesiodistal widths of teeth in the study sample with those of other groups12,13,20 (previously derived from Tanaka and Johnson equations) was undertaken. The findings indicate that the study population presented with larger teeth for both genders and in all groups.
Significant sexual dimorphism is apparent in this study; males present with larger mesiodistal dental measurements than females (Table 1). The findings in this study are similar to several comparable studies11,14,20, hence the recommendation that it would be prudent to develop gender specific equations and tables for prediction.
When assessed statistically, the MTJ equation overestimated the mesiodistal widths of mandibular and maxillary teeth in males, but was precise in females (Table 2). These findings indicate that this method can be applied with greater confidence in predicting the dimensions of unerupted teeth for females than in males in similar groupings. A plethora of studies indicate that the Tanaka and Johnston equation overestimates tooth dimensions, and as a consequence better equations were developed to cater for specific racial groups and genders.11,16,17,21 Expressing a lonely contrary opinion, one study on Jordanian children observed that the Tanaka and Johnston equation underestimated tooth measurements.14
The SaW method in our study statistically underestimated the widths of maxillary teeth in females, which is contrary to the findings by Burhan et al.22 Data from similar odontometric studies7,16,23 concur with our findings that SaW tables, an adaptation of the Moyers method, overestimate the actual mesiodistal dimensions of male permanent teeth in the mandible. Evidence of no difference in the prediction/actual size comparison was reported by Buwembo.6,11
Both methods demonstrated accurate prediction of actual tooth sizes, some of the time. The MTJ equation overestimated the dimensions in 50% of the cases, and the Saw method, in 25% of the cases. In determining which method is the more accurate and applicable, clinical significance should be considered. Underestimation of tooth size results in inadequate space, an inability to accommodate permanent teeth, and thus poor orthodontic outcomes (occlusion and aesthetics); overestimation may result in unnecessary extractions. In clinical practice, underestimation of tooth sizes will have a comparatively poorer prognosis than overestimation. Generally, a difference of more than 2mm is clinically significant and can impact on the prognosis in orthodontic treatment.24
It would seem, given the findings and clinical consideration, that the MTJ is better than the SaW method for the black patients in this South African sample.
LIMITATIONS
The study did not include a size disparity evaluation, such as the Bolton's analysis. It may then have been possible that some teeth with unusual sizes could have been included in the sample, despite the preliminary evaluation of the study models.
Studies with larger sample size will have sufficient power to develop accurate and applicable prediction equations and tables. Regular updates of prediction tools should use present day data, in order to avoid underestimation due to secular trends.
CONCLUSION
The Modified Tanaka and Johnston equation has proven to be more accurate than the Schirmer and Wiltshire method in the prediction of the mesio-distal dimensions of the permanent pre-molars and canines in a sample of black South Africans. We recommend new equations and tables of data be developed based on adequately powered studies with representative sampling.
Acronyms
MTJ : Modified Tanaka and Johnston
SaW : Schirmer and Wiltshire
References
1. Round BJ. Space analysis in the mixed dentition. Georgetown Dent J. 1971;37(2):15-25. [ Links ]
2. Round BJ. Space analysis in the mixed dentition. Dent Stud. 1973;51(6):56-7. [ Links ]
3. White GE. Arch space analysis for the mixed dentition. J Pedod. 1978;3(1):56-66. [ Links ]
4. Durgekar SG, Naik V. Evaluation of Moyers mixed dentition analysis in school children. Indian Journal of Dental Research. 2009;20(1):26-30. [ Links ]
5. Smith RJ. Development of occlusion and malocclusion. Pediatr Clin North Am. 1982;29(3):475-501. [ Links ]
6. Buwembo W, Luboga S. Moyer's method of mixed dentition analysis: a meta-analysis. African Health Sciences. 2004;4(1):63-6. [ Links ]
7. Philip NI, Prabhakar M, Arora D, Chopra S. Applicability of the Moyers mixed dentition probability tables and new prediction aids for a contemporary population in India. American Journal of Orthodontics and Dentofacial Orthopedics. 2010;138(3):339-45. [ Links ]
8. Ling JYK, Wong RWK. Tanaka-Johnston mixed dentition analysis for Southern Chinese in Hong Kong. The Angle Orthodontist. 2006;76(4):632-6. [ Links ]
9. Tanaka M, Johnston L. The prediction of the size of unerupted canines and premolars in a contemporary orthodontic population. J Am Dent Assoc. 1974;88:798 - 801. [ Links ]
10. Profitt W, Fields H, Sarver D. Contemporary Orthodontics. St Louis: Mosby; 2007. [ Links ]
11. Buwembo W, Kutesa A, Muwazi L, Rwenyonyi CM. Prediction of width of un-erupted incisors, canines and premolars in a Ugandan population: a cross sectional study. BMC Oral Health. 2012;12:23. [ Links ]
12. Khan MI, Seedat AK, Hlongwa P. Tooth width predictions in a sample of black South Africans. SADJ. 2007;62(6):246-9. [ Links ]
13. Schirmer UR, Wiltshire WA. Orthodontic probability tables for black patients of African descent: mixed dentition analysis. American Journal of Orthodontics and Dentofacial Orthopedics. 1997;112(5):545-51. [ Links ]
14. Abu Alhaija E, Qudeimat M. Mixed dentition space analysis in a Jordanian population: comparison of two methods. International Journal of Paediatric Dentistry. 2006;16(2):104-10. [ Links ]
15. Alessandri Bonetti G, Verganti S, Zanarini M, Bonetti S, Gatto MR. Mixed dentition space analysis for a northern Italian population: new regression equations for unerupted teeth. Prog Orthod. 2011;12(2):94-9. [ Links ]
16. Diagne F, Diop-Ba K, Ngom PI, Mbow K. mixed dentition analysis in a Senegalese population: elaboration of prediction tables. American Journal of Orthodontics and Dentofacial Orthopedics. 2003;124(2):178-83. [ Links ]
17. Jaroontham J, Godfrey K. Mixed dentition space analysis in a Thai population. EuropeanJournal of Orthodontics. 2000;22(2):127-34. [ Links ]
18. Mahmoud BK, Abu Asab SH, Taib H. Accuracy of four tooth size prediction methods on Malay population. ISRN Dent. 2012;2012:523703. [ Links ]
19. Davidson J. The Central Limit Theorem, Stochastic Limit Theory Oxford: Oxford Scholarship Online Monographs; 1994. [ Links ]
20. Ramesh N, Reddy MS, Palukunnu B, Shetty B, Puthalath U. Mixed dentition space analysis in Kodava population: a comparison of two methods. J Clin Diagn Res. 2014;8(9):ZC01-06. [ Links ]
21. Yuen KK, Tang EL, So LL. mixed dentition analysis for Hong Kong Chinese. Angle Orthod. 1998;68(1):21-8. [ Links ]
22. Burhan A, Nawaya F. Prediction of unerupted canines and premolars in a Syrian sample. Progress in Orthodontics. 2014;15(1):4-12. [ Links ]
23. Van der Merwe S, Rossouw P, van WykKotze T, Trutero H. An adaptation of the Moyers mixed dentition space analysis for Western Cape Caucasian population. J Dent South Afr. 1991;46:475 - 9. [ Links ]
24. Sherpa J, Sah G, Rong Z, Wu L. The applicability of the Tanaka-John-ston and Moyers mixed dentition analyses in Northeast Han Chinese. Journal of Orthodontics. 2015;0:1-8. [ Links ]
 Correspondence:
Dr MPS. Sethusa
Sefako Makgatho Health Sciences University
Pretoria, South Africa, P.O. Box 16, Medunsa, 0204
Tel: +27 12 5214853; Fax no: +27 12 5214422 Cell: 082 774 9939
Email: peter.sethusa@smu.ac.za

