


Services on Demand
Article
 English (pdf)
 Article in xml format
 Article references
Indicators

Related links
-
 Cited by Google
 -
 Similars in Google
Share

 Permalink
South African Dental Journal
On-line version ISSN 0375-1562
Print version ISSN 0011-8516
S. Afr. dent. j. vol.72 n.5 Johannesburg Jun. 2017
http://dx.doi.org/10.17159/2519-0105/2017/v72no5a9
CLINICAL WINDOWS
What's new for the clinician? Summaries of and excerpts from recently published papers
Jeff Yengopal
BChD, MChD (Community Dentistry) Stellenbosch. Department of Community Dentistry, School of Oral Health Sciences, University of the Witwatersrand. E-mail: Veerasamy.Yengopal@wits.ac.za
1. Light-curing units used in Dentistry: factors associated with heat development-potential risk for patients
Compiled and edited by V Yengopal
Mouhat M, Mercer J, Stangvaltaite L, Ortengren U. Clinical Oral Investigations 2017; 21: 1687- 96
Light curing is a critical step in the restorative process when using light-activated resin-based composites, but it is frequently not given the attention it deserves1. Often, imprecise terms such as high-power, high-intensity or high-irradiance are used to describe a curing light. The term radiant exitance (expressed in units of mW/cm2) is the correct term to describe the output from a curing light and is the power emitted by the light source divided by the area of the light tip that emits light. Another important piece of information is the emission spectrum in nanometers of the emitted light. The irradiance (also expressed in units of mW/cm2) is the radiant power incident on a surface and describes what the resin receives. The radiant exposure is the radiant energy applied to a given surface area over time (irradiance × time = energy/area = J/cm2).1 Unlike lasers, different dental LED LCUs (Light emitting diode [LED] light curing units [LCUs])vary greatly in the extent to which they are collimated or can maintain irradiance with distance and irradiance figures described by manufacturers are often inaccurate because they are almost universally established at zero source distance1 which is not clinically relevant. Irradiance is greatly affected by the tip diameter and light dispersion with distance from the light tip. Irradiance may also vary greatly across different regions of the light guide exit window.1 The power output (in watts) from the unit is a more useful measure of how powerful the LCU is because a high irradiance can still be achieved simply by using a small tip. Dentists should recognise that the manufacturer-stated LCU irradiance value is rarely achieved when the LCU is positioned at a clinically relevant distance of 4 mm or more away from the resin. Thus, the material minimum energy requirement of the resin is often not achieved when LCU manufacturer directions for use are followed.1
Photopolymerization dominates using blue light of a wavelength between 380 and 500 nm and with an irradiance of >450 mW/cm2. During the last 10 years, LCUs employing LED technology have largely taken over from the older quartz-tungsten-halogen (QTH) devices.2 LED is considered as "cold light" created by recombination of electrons using crystals (e.g., GaN) releasing photons (i.e., light) when subjected to energy (i.e., voltage).2 The advantage of LED is a spectrum closer to the point for photoexcitation of the most widely used photoinitiators in dental resin-based composites (RBCs). In addition, use of energy is more efficient (i.e., more light and less heat).2
In recent years, light-curing units employing LED-LCU with higher energy output than previous generations of LCU have emerged on the market. The reason for this development trend is claimed to be shorter curing times and increased polymerization.2 With higher output, there is a risk of increased temperature even with LED technology and concerns have been raised about increasing risk for pulp and tissue damage in patients.2 Complaints from patients in connection with light-curing procedures have been reported, including experience of "burning" sensations in teeth and in oral tissue.2
Different brands of LED-LCU with the same expected output do not always produce the same amount of heat, and this may be due to differences between the light in spectral distribution,2 the type of LED-LCU tip used and its diameter, and/or the use of a fan in the LED-LCU. In addition to the heat produced by the LED-LCU, the polymerization of the composite (i.e., exothermic reaction) has been discussed as causes for tissue damage (i.e., pulp damage).2 The light source is still, however, considered to be the main risk2 even though the composite and the remaining dental hard tissue may give some protection.2
Mouhat and colleagues (2017)2 reported on a study that sought to develop a reliable bench model for investigating how heat development in the pulp chamber and coronal surface of natural teeth with and without cusps and subjected to irradiance using three different LED-LCUs is associated with (i) irradiance, (ii) time, (iii) distance, and (iv) radiant exposure (product of irradiance and time which represent the total light energy delivered to the resin based composite).
MATERIALS AND METHODS
Two different brands of LED-LCUs were tested, Bluephase style® and Bluephase G2®. One LED-LCU Bluephase G2® was tested in two modes (high mode and low mode). Two LED-LCU Bluephase style® were tested, one battery powered and one mains powered.
Bluephase style® (n = 10) and Bluephase G2® (n = 10) (IvoClar/Vivadent) were tested for irradiance using a calibrated laboratory-grade spectrometer. The objective was to evaluate eventual differences in irradiance among the curing unit within the same brand. The LED-LCU were battery powered, the batteries being fully charged on all test occasions. The working capacity of the LED-LCU lithium-polymer battery for the two brands of LED-LCU is ≈60 min. Bluephase G2® was tested in high mode. One Bluephase style® was also tested when connected to main electricity. Caution was taken in the precise placement of the TIP on the sensor of the measurement equipment. To achieve this, an adjustable precision gantry with a 0.1-mm scale was used/ (#55025, Edmunds Optics, Barrington, NJ). For evaluation of differences among units in the same brand, five measurements for each unit at 0-mm distance were conducted at irradiation times of 10, 20, and 30s, respectively. The variation in irradiance was small for nine out of 10 units in the same brand. One of these nine units for each brand was randomly selected for the temperature profile experiments.
For the temperature profile experiments, caries-free human third molars were used. The teeth were extracted for surgical reasons, not more than six months previously. They had been stored in 0.5% chloramine-T solution in a refrigerator (4 ± 1°C) prior to use. In one tooth (T1), a class I cavity was prepared with a cylindrical diamond (Ø=1.2mm) bur through the enamel and into the dentin. The apex of the root was cut and the channel prepared up to the pulp chamber with K-files 35 and 70. The tip of a thin (0.2mm) type T (copper constantan) thermocouple was inserted into the pulp chamber via the prepared channel, and its position was controlled with radiography. The remaining pulpal wall had a thickness of 1.3 ± 0.2mm as assessed from the radiograph. In order to avoid an air space surrounding the tip of thermocouple inside the pulp chamber, the prepared channel was filled with glycerol prior to insertion of the thermocouple. The excess glycerol (spillage) during insertion was removed. Glass Ionomer (Fuji I®) was used to seal the apex and secure the thermocouple.
A second tooth (T2) was cut in the horizontal plane using a diamond saw, creating a flat dentin surface with a pulpal wall thickness of approximately 0.6 mm. Radiography was also used to control placement of the thermocouple and thickness of the dentin wall as described above.
In an attempt to simulate as closely as possible the thermal conditions within the oral cavity, a special experimental rig was constructed involving the use of a thermostatically controlled circulating water bath maintained at 37 ± 1°C. The individual tooth under investigation was inserted approximately halfway (at the cemento-enamel junction) through an opening in the centre of a 75 × 50 × 1.25mm-thick plastic sheet, in such a way that the root was visible on one side and the crown on the other. The edges of the plastic plate were in turn glued to one side of a 12mm-thick sheet of expanded polystyrene that had a rectangular-shaped opening with slightly smaller dimensions to the plastic plate. The plastic plate was attached to the polystyrene plate with the coronal side of the tooth situated within the open space of the polystyrene plate. This combined unit was then positioned on the water surface inside the thermostatically controlled circulating water bath, such that the root was immersed below the water surface and the coronal part in the air. A second thermocouple was placed in the air space ≈2 mm from the coronal side of the tooth for measuring the air temperature in the immediate vicinity of the tooth.
The surface temperature of the tooth was measured by thermography using a high-precision infrared camera with a close-up lens. For temperature measurements, the two LED-LCUs chosen from the irradiance test were tested at the following combinations of curing time and distance from the tooth surface (10, 20, and 30s and 0, 2, and 4mm, respectively). The curing times chosen are within the range recommended by the manufacturers. The chosen distances of the tip from the tooth were based on those generally used in a clinical setting. For Bluephase G2®, the tests were performed both in low (≈700 mW/cm2) and high modes (≈1400 mW/cm2). Five repeated measurements for each distance/time combination were performed. All temperature data were continuously recorded before, during, and after a simulated curing cycle. Between each measurement, a recovery time was allowed to make sure that the temperatures had returned to its baseline value (pre-irradiation value).
RESULTS
The mean values of irradiance of ten Bluephase style® LED-LCU and mean value of ten Bluephase G2® LED-LCU were statistically significantly different. There was also a significant difference in irradiance with time within the ten Bluephase style® units
The mean (SD) for the irradiance of the two different light-curing units tested, Bluephase style® battery (n = 10) and Bluephase G2® high mode (n = 10), at three different curing times are shown in the table below:
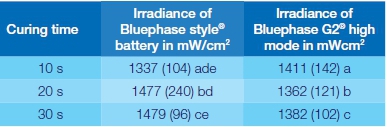
The letters a-c indicate significant differences (p < 0.05) between Bluephase G2® and Bluephase style® at the different times tested respectively. The letters d-e indicate significant differences (p < 0.05) in irradiance at different times for Bluephase style®. Wavelength for the two light-curing units was 385-515 nm.
The irradiance was higher than claimed from the manufacturer for the majority of the units tested. For Bluephase style®, the claimed maximum irradiance was 1100 ± 10 % mW/cm2 and for Bluephase G2® 1200 ± 10% mW/cm2.
The temperature distribution on the surface of the tooth 1 (T1) was non-uniform compared with T2. The increase in pulp chamber temperature was less for T1 compared with T2. The maximal surface temperature was 58.1 ± 0.9 °C (for T2 at 2mm distance, 30s curing time), and the maximal pulp chamber temperature was 43.1 ± 0.9°C (for T2 at 0mm, 30s curing time).
For both T1 and T2, radiant exposure was shown by multiple regression analyses to be the most important factor for heat development. For T1, 69% of the variation of the surface temperature and 75% of the pulp chamber temperature were explained by radiant exposure. For T2, the outcomes were 47% (surface temperature) and 62.5% (pulp temperature), respectively. Since radiant exposure is calculated as a function of watt × time/area, time will still be the most important factor on the temperature variation.
When the different LED-LCU and curing modes were compared (Bluephase style® electrically powered, Bluephase style® battery, Bluephase G2® high mode, and Bluephase G2® low mode), multiple linear regression analyses similarly showed that time was the most important factor for the temperature variations on T2.
An increase in surface temperature with increasing distance from 0 to 2mm was seen for all LED-LCU units. For the Bluephase G2®, this was also seen when the distance was increased to 4mm, irrespective of the mode used. Even though the irradiance (and radiant exposure accordingly) was lower at 2mm distance for the Bluephase G2® high mode, the surface temperature increased (52.2 ± 0.6°C at 2mm vs. 46.9 ± 1.2°C at 0mm) when irradiated for 30s. For the same unit in low mode and for the Bluephase style® battery tested, the recorded increase in surface temperature followed the increase in irradiance (and radiant exposure accordingly) at different distances.
CONCLUSION
The researchers concluded that increased curing time seemed to be the factor most likely to cause temperature rise. When the tip is close to soft tissue, the risk of damage should seriously be taken into account at irradiances >1200 mW/cm2. There is also a risk of pulp damage when only thin dentin is left at higher irradiances. Decreased curing time may reduce the risk for soft and pulpal tissue damage but this can have a negative effect on the degree of conversion.
IMPLICATIONS FOR PRACTICE
The findings of this study highlight the importance of considering factors that can cause overheating and subsequent damage to viable tissue both within the pulp chamber as well as in tissue surrounding the tooth when using LED-LCUs. Risk of superficial tissue damage at irradiances >1200 mW/cm2 is evident. There is a risk of pulp damage at higher irradiances (>1200 mW/cm2) and Acronymswhen only thin dentin is left. Clinicians should be aware of LED-LCU settings and possible high temperatures generated.
ACRONYMS
LED: Light emitting diode
LCU: Light curing units
CLINICAL WINDOWS
References
1.Shortall AC, Price RB, MacKenzie L, Burke FJT. Guidelines for the selection, use, and maintenance of LED light-curing units - Part 1. BDJ 2016; 22: 453 - 60 [ Links ]
2.Mouhat M, Mercer J, Stangvaltaite L, OrtengrenU. Light-curing units used in dentistry: factors associated with heat development-potential risk for patients. Clinical Oral Investigations 2017; 21: 1687- 96. [ Links ]
2. The accuracy of digital impressions of multiple dental implants.
Vandeweghe S, Vervack V, Dierens M, De Bruyn H. Clin. Oral Impl. Res. 28, 2017, 648-653
The introduction of CAD/CAM has simplified and improved the workflow of fixed prosthetic dentistry. Many modern dental practices have introduced CAD/CAM technology into their rooms and these have been shown in a number of studies to significantly improve the accuracy of prosthetic frameworks compared to conventional cast frameworks.1 In the conventional workflow, half of any misfit is introduced during the impression procedure and production of the stone cast, while the other half occurs while manufacturing the prosthesis.1 Although CAD-CAM improved the accuracy of the latter, the initial step in the workflow, taking an impression and pouring the cast, remained the same.
Making a digital impression by means of an intra-oral scanner may help to overcome these errors. The virtual model used by the CAD software is almost immediately created using the data of the intra-oral scanner. As there is no need for a stone cast or a conventional impression, the dimensional errors that take place during these procedures can be avoided.1 Theoretically, this could improve the accuracy and fit of the final prosthesis. According to many authors, discrepancies up to 150 μm were acceptable.1
For implant-supported reconstructions, the level of fit is even more important compared with teeth-supported prostheses. Dental implants have a reduced mobility which only exists because of the flexibility of the bone.1 The absence of a periodontal ligament prevents the implant from adapting to the ill-fitting framework, and as a consequence, stress will be induced in the implant and framework.1
Making digital impressions of dental implants requires the use of scanbodies, which are easy to capture as most of the object is located supragingivally. Scanning an edentulous jaw may be challenging due to the lack of anatomical landmarks and the fact that all scanbodies are identical. Some researchers experienced several problems when scanning two implants in the edentulous mandible because the intra-oral scanner had difficulties in making a distinction between both implants. As a result, the majority of scans were useless.1 Vandeweghe and colleagues reported on an in vitro investigation that sought to evaluate the accuracy of various intra-oral scanners when used for implant impressions in the edentulous jaw.
MATERIALS AND METHODS
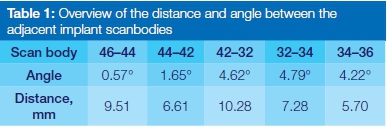
Six regular dental implants with an external hex connection (IBT, Southern Implants®, Irene, South Africa) were placed in an acrylic model of the edentulous mandible at the position of the 1st molar, 1st premolar and lateral incisor. Inter-scan body distance and angulation are depicted in Table 1. Six custom-made intra-oral scanbodies in PEEK (=polyether ether ketone) (Proscan) were connected to the implants and tightened by hand to approximately 10Ncm.
The model was scanned with a highly accurate optical digitizer (104i, Imetric, Courgenay) and a 3D image was created and exported as an open-format STL file.]
The model was scanned in a similar manner 15 times by each intra-oral scanner according to the manufacturer's recommendations. The first five scans were not used for analyses, to avoid inaccuracies caused by a learning curve. The remaining scans were exported to an open file format (STL, Ply). For the Lava COS and 3M TrueDef, these files could be downloaded directly from the cloud, while for the 3Shape Trios and Cerec Omnicam, the data had to be imported into additional software to allow creation of an open STL file.
The Lava™ Chairside Oral Scanner (Lava COS) was launched in 2008 by 3M™ESPE (Seefeld, Germany) and is based on the principle of active wavefront sampling with structured light projection. It allows data capturing in a video sequence and models the data in real time. Light powder dusting of the dental arch is necessary to locate reference points for the scanner.
In 2012, the Lava COS was replaced by the 3M™ True Definition (3M TrueDef) scanner (3M™ESPE), which is an upgraded version of the Lava COS, with updated software and an improved wand with a larger focus depth. It also uses light powder dusting.
The Cerec Omnicam (Sirona, Long Island City, NY, USA) is based on the concept of active triangulation and uses a white light to project a pattern on the object. It captures data continuously in colour, without the need for contrast spraying.
The Trios scanner (3Shape, Copenhagen, Denmark) is based on confocal microscopy and continuously captures 2D images from different positions to create a 3D surface. The recent version captures in colour and does not use contrast spraying.
All scans were imported into metrology software (Geomagic Qualify 12, 3D Systems, Rock Hill, SC, USA) for data analyses. The CAD file of the scan body was aligned to the six scanbodies, using a best-fit algorithm with the tolerance set at 1 μm. Next, the six aligned scanbodies were saved as a new file.
Accuracy consists of two parameters: trueness describes how close a test scan resembles the scan taken by a reference scanner, while precision describes how much the various test scans differ from each other.
For this study, the trueness was evaluated by comparing the various test scans obtained from the intra-oral scanner with the reference scan from the Imetric 104i. Precision was evaluated by comparing the scans from each intra-oral scanner with one another. The primary outcome is thus to evaluate the accuracy, in terms of trueness and precision, at the level of the implant scanbodies.
Test and reference scans were superimposed and aligned, using a best-fit algorithm with the tolerance set at 0.001 μm. Then, a 3D comparison was done, thereby calculating the absolute mean deviation from the mean positive and negative deviation. The trueness was based on 10 comparisons per scanner, while the precision was calculated from 45 comparisons.
Differences in trueness and precision were first evaluated using Friedman's 2-way ANOVA test. Post hoc analyses to identify significant differences in trueness and precision in between the different intra-oral scanners were done using Wilcoxon signed rank test.
RESULTS
Mean values for trueness and precision were based on the analyses of the pooled findings for all six scanbodies. Friedman's test detected significant differences for trueness (P < 0.001) and precision (P < 0.001)
The mean trueness was 0.112mm (SD 0.025, range 0.084-0.174) for Lava COS, 0.035mm (SD 0.012, range 0.023-0.061) for 3M TrueDef, 0.028mm (SD 0.007, range 0.021-0.044) for 3Shape Trios and 0.061mm (SD 0.023, range 0.029-0.099) for Cerec Omnicam. There was no statistically significant difference between 3M TrueDef and 3Shape Trios (P = 0.262). Cerec Omnicam was less accurate than 3M TrueDef (P = 0.013) and 3Shape Trios (P = 0.005) but more accurate compared with Lava COS (P = 0.007). Lava COS was also less accurate compared with 3M TrueDef (P = 0.005) and 3Shape Trios (P = 0.005).
The mean precision was 0.066mm (SD 0.025, range 0.001-0.132) for Lava COS, 0.030mm (SD 0.011, range 0.013-0.054) for 3M TrueDef, 0.033mm (SD 0.012, range 0.005-0.057) for 3Shape Trios and 0.059 mm (SD 0.024, range 0.009-0.115) for Cerec Omnicam. There was no statistical significant difference between 3M TrueDef and 3Shape Trios (P = 0.119). Cerec Omnicam was less accurate compared with 3M TrueDef (P < 0.001) and 3Shape Trios (P < 0.001), but no difference was found with Lava COS (P=0.169). Lava COS was also less accurate compared with the 3M TrueDef (P < 0.001) and 3Shape Trios (P < 0.001)
CONCLUSIONS
According to the literature, discrepancies up to 150 μm will not induce clinical complications. However, some authors put this threshold a lot lower, between 50 and 75 μm - hence, based on these numbers, one can conclude that Lava COS cannot be used to take digital impressions for a large-span implant-supported construction. The other scanners demonstrated a level of accuracy (trueness and precision) which seems clinically acceptable. Consequently, clinicians should be aware that not every intra-oral scanner can be used for every indication.
IMPLICATIONS FOR PRACTICE
Clinicians should be aware of the limitations of the intraoral scanners, especially in terms of the accepted threshold for discrepancies which ranges from 50-150 μm for clinical acceptability.
ACRONYMS
CAD/CAM: Computer- aided Design / Computer- aided Manufacturing
Reference
1.Vandeweghe S, Vervack V, Dierens M, De Bruyn H. Accuracy of digital impressions of multiple dental implants: an in vitro study. Clin. Oral Impl. Res. 28, 2017, 648-53. [ Links ]

