


Serviços Personalizados
Artigo
 Inglês (pdf)
 Artigo em XML
 Referências do artigo
Indicadores

Links relacionados
-
 Citado por Google
 -
 Similares em Google
Compartilhar

 Permalink
South African Dental Journal
versão On-line ISSN 0375-1562
versão impressa ISSN 0011-8516
S. Afr. dent. j. vol.71 no.1 Johannesburg Fev. 2016
RESEARCH
The association between area level socio-economic position and oral health-related quality of life in the South African adult population
IJ Ayo-YusufI; S NaidooII; OA Ayo-YusufIII
IBDS, MSc, PhD. Senior lecturer, Department of Dental Management Sciences, School of Dentistry, Faculty of Health sciences, University of Pretoria, south africa
IIBDS, MDent, PhD. Professor & Deputy dean research, Department of Community oral health, Faculty of dentistry, University of the western Cape, South africa
IIIBDS, MSc, MPH, PhD. Professor & Director School of oral Health Sciences, Sefako Makgatho Health Sciences University, Medunsa, South africa
ABSTRACT
OBJECTIVE: To investigate the association between area-level socio-economic position (SEP) and oral health-related quality of life (OHRQoL
METHODS: Data collected from a nationally representative sample of the South African population >16 years old (n=3,003) included demographics, individual-level SEP measures and self-reported oral health status. OHRQoL was measured using the Oral Health Impact Profile-14 (OHIP-14). The General Household Survey (n=25,653 households) and Quarterly Labour Force Surveys (n~30,000 households/ quarter) were used to determine area-level SEP. Data analysis included a random-effect negative binomial regression model and Blinder-Oaxaca decomposition analysis
RESULTS: Area-level deprivation was associated with more negative oral impacts, independent of an individual's SEP. Other significant predictors of oral impacts included having experienced oral pain (β=1.15) and reporting previous dental visits (β=0.69). Area differences in dental attendance contributed the most (37.5%) to the observed gap in OHRQoL, explained by differences in area-level SEP, whereas individual-level SEP contributed the least (18.8%). In the more affluent areas, satisfaction with life in general and individuals' SEP were significantly positively associated with OHRQoL
CONCLUSION: To reduce inequalities in OHRQoL, proportionate development of socio-economic conditions should be prioritised, particularly there appears to be a need for greater access to oral health services by disadvantaged people in affluent areas
Keywords: social gradient, oral health-related quality of life, socio-economic position; South Africa
Introduction
Oral health has been shown to follow a socio-economic gradient.1-5 Hence, it has been suggested that reporting averages on the general population conceals inequalities in health between sub-populations.6 It has been argued that variations in health between different subpopulation groups is a combination of both the socio-economic position (SEP) of individuals and the area-level or socio-environmental factors to which those individuals are exposed.7-9 These variables may operate independently or in a complementary manner.10,11
Some suggest that area-based indicators are better predictors of oral health status than are measures of individual socio-economic status, and that area-based indicators add explanatory power when one is examining oral health inequalities.1 Others have also maintained that area-level SEP may influence oral health11 and general health,10,12 independent of individual-level SEP. By contrast, it has been argued that after controlling for individual-level SEP, the association between area-level SEP and individual general health13 or oral health14 is no longer statistically significant, implying that the area effect is fully explained by individual SEP.
Some inconsistencies in the findings of studies on the role of area-level SEP in health outcomes may be partly related to differences in study design. In particular, some studies investigating the role of individual- and area-level SEP on health did not use a multi-level statistical modelling approach that allows influences to be partitioned,15-16 and/or did not explore the potential effects of the interaction between area-level and individual-level SEP.17 Furthermore, differences in the nature of the SEP measure used, for example, using single-variable factors instead of a combination of variables in the form of an index, may also partly explain differences in findings - studies using only a single variable measure for individual-level SEP may leave an unmeasured dimension of individual-level SEP to be captured as part of area-level SEP.18
The limited number of studies using a multilevel modelling approach to delineate the role of individual SEP's in oral health have been conducted mainly in developed countries, and/or focused only on specific population groups.14,19 There is limited empirical evidence regarding the influence of social context on an index measure of oral health-related quality of life (OHRQoL) in a general adult population. Yet, it is conceivable that the social context is an important determinant of this measure of psychological wellbeing related to oral health of an individual. Very few studies on the influence of social context on OHRQoL have been conducted in sub-Saharan Africa, and especially in South Africa, where absolute deprivation commonly coexists with affluent conditions.20 This gap may present an opportunity to increase our understanding of the effects of the social context of people on OHRQoL. One recent study in South Africa focused on self-reported oral health, but did not use index measures of individual-level and area-level SEP.21 Hence, the current study used a composite measure of SEP to attempt to answer two key research questions: Does area-level SEP influence OHRQoL? To what extent does individual-level SEP account for the relationship between area-level SEP and OHRQoL, if at all?
METHODS
Study design and sample population
This cross-sectional study used a representative sample of South African adults aged 16 years and older who participated in the Human Sciences Research Council's (HSRC) annual South African Social Attitude Survey (SASAS) for 2011 (n=3,003; 85% response rate). The detailed sampling procedure for the SASAS, which was a household survey, has been published previously.21 Briefly, the SASAS used a multi-stage cluster sampling method to obtain a representative sample of adult South Africans, based on census enumeration areas. The survey procedure was approved by the HSRC's Research Ethics Committee.
Measures and definitions
Demographic information such as participants' age, sex, private health insurance enrolment (Medical aid), and race was obtained from the SASAS, which is based on questions adapted from the published literature and has been used previously in the South African population. Multiple measures were gathered of individual-level SEP, self-rated oral health,22 experience of oral pain in the past six months, past dental attendance pattern, self-reported number of teeth present in the mouth6 and OHRQoL using the Oral Health Impact Profile-short version (OHIP-14)23 (Cronbach alpha =0.94). The prevalence of oral health impacts measured using the OHIP-14 was calculated as the proportion of subjects who responded to experiencing one or more oral impacts "fairly often" or "very often".24 Self-reported level of satisfaction with life in general was also measured using the question: "How satisfied are you with life as a whole these days?" Scores ranged from 1 ("very dissatisfied") to 5 ("very satisfied"). Information on oral health-related risk behaviours was also elicited. Current smokers were those who indicated they smoke "daily" or "some days". Binge-drinking was defined as indicating having four or more alcoholic drinks in a row at least once in a month. Those who indicated having fruit and vegetables "daily" or "several times a week" were considered daily/ weekly consumers of fruit and vegetables.
Individual-level socio-economic position
The individual-level SEP (Cronbach alpha = 0.75) used in this study was an index of different variables that captures different aspects of the multi-dimensional nature of SEP.7,25 The set of individual-level SEP measures obtained from the primary survey included: years of formal education, current employment status, subjective socio-economic position on a scale of 1 to 10,26 state of repair of the home and an asset index. These different variables were used to capture the different aspects of the multi-dimensional theoretical construct of SEP (such as education, which may reflect knowledge level; current employment, state of repair of the home and an asset index to reflect material living conditions; and the subjective SEP to reflect psy-chosocial aspects such as a sense of relative deprivation). The asset index (Cronbach alpha = 0.91) is a summed score of best fitting items obtained following a principal component analysis of household assets owned by participants. These household items included, among others, an electric stove, TV set, radio, DVD player, vacuum cleaner, fridge, hot running water, computer and car. Given the differences in scoring of the different components measuring individual-level SEP, the values derived from each measure were standardized using z-scores prior to the principal component analysis and reliability test of the composite index/scale.
Area-level socio-economic position
Area-level SEP measures were obtained from two large nationally representative household surveys. These secondary datasets included the 2010 General Household Survey (GHS) (n=25,653 households) and four rounds of Quarterly Labour Force Surveys (About 30,000 households/quarter). Subsequently, each individual in the primary survey dataset was matched with the corresponding area-level SEP measures, using the unique municipal-level geographic codes available in all the datasets (n=179 municipal areas matched). On average, twenty respondents from the primary survey were matched to each area.
In a manner similar to the determination of individual-level SEP, a composite area-level SEP measure (Cronbach alpha = 0.88) was calculated on the basis of a theory that area-level SEP is a multi-dimensional construct. This concept was explored using a principal component analysis of a set of variables obtained from the above two main datasets. For the area-level SEP, the value obtained from each variable was also weighted using the z- score to give equal weights before conducting a principal component analysis. The best fitting variables that were obtained from the principal component analysis included the proportions of people with >12 years of formal education ("high school"/matriculation) in an area, those who were eligible for employment and were employed, those who were employed in the formal sector (measure of area-level economic development), households in an area with flushing toilets, households with piped water and those who reported using private health facilities when ill. The data from these variables were summed to indicate the measure of area-level SEP. In the final analysis, those ranked in the lowest third area-level SEP were compared with those in the upper two-third area-level SEP.
Data analysis
All data analyses were conducted in STATA version 10.0 (STATA Corp., College Station, TX, USA) statistical package. Analyses used STATA's "survey design" features to account for the cluster-sampling design. Data analysis included chi-square statistics and the t-test for independent samples. All statistical analyses were two-tailed. The threshold for statistical significance was set at p<0.05. However, all variables significantly associated with OHR-QoL at the 20% significance level in the bivariate analysis were entered into a multi-variable adjusted regression model to assess their independent association with OHR-QoL (measured using the OHIP-14).
Several respondents scored a zero on the OHIP-14 scale and that the data were therefore highly skewed. Therefore, a random-effects negative binomial regression model was used to assess the role of area-level SEP on OHIP-14. The final model included an interaction term "Individual*Area SEP" to explore the potential modifying effect of area-level SEP on individual-level SEP. This analysis was followed by a Blinder-Oaxaca decomposition analysis27 to explore the proportion of the effects of area-level SEP on OHRQoL, explained to a significant level by the factors which were also independently associated with OHRQoL in the regression model. Decomposition analysis is a method of decomposing inequality in health (OHIP) into the contributing factors. This gives the extent to which different factors contribute to the observed effect of the differences in area-level SEP on OHRQoL.
RESULTS
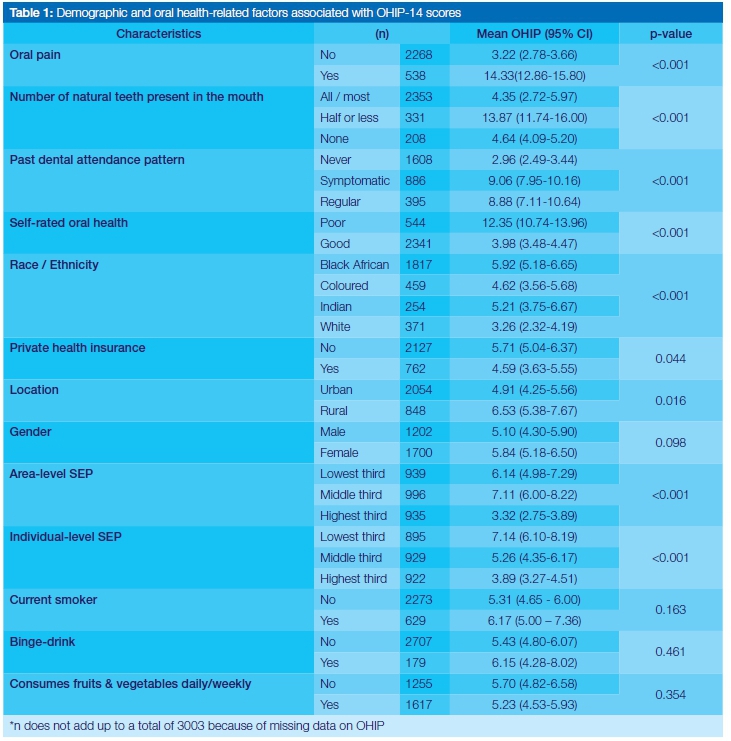
The mean (±SD) age of respondents was 40.6 (± 16.3) years. The prevalence of oral impacts measured using OHIP-14 was 17.2% (95% CI = 14.9 - 19.6). Those who reported having experienced oral pain in the six months prior to the survey date had significantly higher OHIP scores, implying poorer OHRQoL than among those who did not experience such pain (Table 1). There was a significant negative association between the OHIP-14 scores and both individual- and area-level SEP's. Other factors associated with the OHIP-14 scores are shown in Table 1.
Even after controlling for potential confounders, the independent association between area-level SEP scores and OHRQoL remained significant (Table 2; Model A). Furthermore, there was a statistically significant interaction between individual-level SEP and area-level SEP (Table 2; Model A).
Subsequently, the study population was stratified into two groups, namely those living in areas ranked in the lowest third SEP and those living in areas with a higher SEP. Figure 1 demonstrates that, unlike in the most deprived areas, a very steep socio-economic gradient in OHRQoL was observed in more affluent areas.

Although those with a higher SEP and those living in more affluent areas were more likely to rate satisfaction with life in general higher than those with a lower SEP and living in more deprived areas (p<0.01), the ratings of satisfaction with life were significantly associated with OHRQoL only in the more affluent areas (Table 2; Model B). Similarly, fewer people in the most deprived areas had ever visited a dental clinic compared with those in the more affluent areas (31.9% vs. 48.4%; p<0.001). The observed negative association between reporting past dental attendance and OHRQoL was significantly greater among those living in the most deprived areas (Table 2; Model C).
Decomposition analysis showed that area differences in dental attendance contributed the most (37.5%) to the gap in OHRQoL explained by area-level SEP, whereas individual-level SEP contributed the least (18.8%). Area differences in racial composition accounted for 23.4% of the area differences in OHRQoL, and the proportion that self-rated their oral health as good accounted for 20.3% of these differences (Table 3).

DISCUSSION
This study showed that the 17.2% prevalence of oral impacts in the South African adult population is comparable to the 16.5% prevalence obtained in a national population survey of Australians using the OHIP-14,24 and is similar to the 15.3% prevalence reported in a US population survey using the NHANES-OHIP.24 All these studies had samples with a mean population age of between 41 years and 44 years. Consistent with findings from a similar Australian study,19 the current investigation found that area-level deprivation is associated with reporting more oral impacts, independent of an individual's SEP. However, in contrast to findings from another Australian study,17 wealthier adults living in more deprived areas were not much better than their poorer counterparts compared with the difference observed in affluent areas.
Individuals with the lowest SEP in the more affluent areas tended to report worse OHRQoL than would be expected from those with the lowest SEP living in the most deprived areas. This perhaps unexpected observation may be related in part to differences in the oral disease burden and/ or frame of reference underpinning self-ratings.28 This finding also supports previous suggestions that individuals with the lowest SEP in more affluent areas are more likely to experience "relative deprivation", which has also been associated with worse general health than that seen among those experiencing the "absolute deprivation" characteristic of people with a low SEP in highly deprived areas.29 This view is further supported by our finding that satisfaction with life in general was only associated with OHRQoL in more affluent areas. Conceivably, in the presence of absolute deprivation and competing social needs, oral impacts may be regarded as less important and are thus less likely to be associated with life satisfaction (or a lack thereof) in more deprived areas than in more affluent areas.
Areas of low SEP conceivably have poorer infrastructure, which may result in limited choices for all individuals to maintain and improve their oral health, irrespective of their individual-level SEP. It was therefore not surprising that area differences amongst those who reported having sought dental care (a possible proxy output measure of the availability of infrastructure for dental services) contributed most to explaining area differences in OHRQoL.
The cross-sectional study design used in the current study limits possible inferences on causality. The use of the OHIP-14 and most of the variables in this study were based on self-reporting - the accuracy of such results depends on the extent to which respondents can recall events accurately and report them honestly. This study did not include any clinical examination of the individual respondents.
OHRQoL may well have influenced the rating of life satisfaction rather than the reverse, as reported here. Nevertheless, it has been acknowledged that people's psychosocial state (as reflected by their rating of satisfaction with life in general) may influence ratings of oral health impact.22 Furthermore, we did not ask for the reason for the dental visits or how far back participants initiated regular dental visits. The "Regular" dental attendees who rated oral impacts as high as the symptomatic dental attendees did, but lower than those who "never" visited the dental clinic, may have been people prompted to make regular dental visits based only on the oral impacts they experienced during the 12-month frame of reference in this study. However, regular dental attendance may not be associated with reporting fewer oral problems, as previously noted.30 Consistent with the findings of Crocombe et al.30the apparent negative impact of dental attendance and having lost all/most natural teeth was stronger in the most deprived areas, which may reflect poorer infrastructure (and thus the quality of dental services available, such that the services are mainly extraction-driven31) in the more deprived areas than in more affluent areas.
Despite these limitations, this study, which used a large sample and a rigorous statistical approach, has demonstrated that area-level SEP was independently associated with OHRQoL and moderated the influence of individual-level SEP on OHRQoL. Taken together, these findings highlight the need for interventions to improve the living conditions of underprivileged South Africans, including developing both health- and non-health-related physical infrastructure, and promoting a culture of preventive self-care practices. The finding of a steeper socio-economic gradient in OHRQoL in more affluent areas and the loss of the oral health advantage of more affluent individuals in the most deprived areas supports the call for development programmes to embrace what has been referred to as "proportionate universalism", a strategy proposed to ensure that development programmes are implemented on a scale and with an intensity proportionate to the level of disadvantage.32 The use of general universalism such as the National Health Insurance combined with specific universalism where additional oral health services can be provided for the more disadvantaged groups of people, would help to reduce the inequity.33
Acknowledgements: The study was supported by a South African National Research Foundation grant to SN and OAA. No conflict of interest is declared.
ACRONYMS
GHS: General Household Survey
HSRC: Human Sciences Research Council
OHIP-14: Oral Health Impact Profile-14
OHRQoL: Oral Health-Related Quality of Life
SASAS: South African Social Attitude Survey
SEP: Socio-economic Position
References
1. Watt R, Sheiham A. Inequalities in oral health: a review of the evidence and recommendations for action. Br Dent J 1999; 187: 6-12. [ Links ]
2. Chavers LS, Gilbert GH, Shelton BJ. Racial and socioeconomic disparity in oral disadvantage, a measure of oral health-related quality of life: 24-months incidence. J Public Health Dent 2002; 62: 140-7. [ Links ]
3. Sabbah W, Tsakos G, Chandola T, Sheiham A, Watt RG. Social gradient in oral and general health. J Dent Res 2007; 86: 992-6. [ Links ]
4. Sanders AE, Slade GD, Turrell G, Spencer AJ, Marcenes W. The shape of the socioeconomic-oral health gradient: implications for theoretical explanations. Community Dent Oral Epidemiol 2006; 34: 310-9. [ Links ]
5. Jung S-H, Watt RG, Sheiham A, Tsakos G. Exploring pathways for socioeconomic inequalities in self-reported oral symptoms among Korean adolescents. Community Dent Oral Epidemiol 2011; 39: 221-9. [ Links ]
6. Sanders AE, Spencer AJ. Why do poor adults rate their oral health poorly? Australian Dental Journal 2005; 50: 161-7. [ Links ]
7. Macintyre S, Ellaway A, Cummins S. Place effects on health: how can we conceptualise, operationalise and measure them? Soc Sci Med 2002; 55: 125-39. [ Links ]
8. Diez-Roux AV. Neighborhoods and health: where are we and where do we go from here? Rev. Epidemiol Sante Publique 2007; 55: 13-21. [ Links ]
9. Ahern J, Galea S, Hubbard A, Karpati A. Population vulnerabilities and capacities related to health: a test of a model. Soc Sci Med 2008; 66: 691-703. [ Links ]
10. Krieger N, Williams DR, Moss NE. Measuring social class in US public health research: concepts, methodologies, and guidelines. Ann Rev Public Health 1997; 18: 341-78. [ Links ]
11. Locker D (2000). Deprivation and oral health: a review. Community Dent Oral Epidemiol 28: 161-9. [ Links ]
12. Robert SA. Socioeconomic position and health: the independent contribution of community socioeconomic context. Annual Review Sociology 1999; 25: 489-516. [ Links ]
13. Reijneveld SA. The impact of individual and area characteristics on urban socioeconomic differences in health and smoking. Int J Epidemiol 1998; 27: 33-40. [ Links ]
14. Bower, E., Gulliford, M., Steele, J. and Newton, T. Area deprivation and oral health in Scottish adults: A multilevel study. Community Dent Oral Epidemiol, 2007; 35: 118-29. [ Links ]
15. Merlo J, Chaix B, Yang M, Lynch J, Râstam L. A brief conceptual tutorial of multilevel analysis in social epidemiology: linking the statistical concept of clustering to the idea of contextual phenomenon. J Epidemiol Community Health 2005; 59: 443-9. [ Links ]
16. Newton JT, Bower EJ. The social determinants of oral health: new approaches to conceptualizing and researching complex causal networks. Community Dent Oral Epidemiol 2005; 33: 25-34. [ Links ]
17. Sanders AE, Turrell G, Slade GD. Affluent neighbourhoods reduce excess risk of tooth loss among the poor. J Dent Res 2008; 87: 969-73. [ Links ]
18. Pickett KE, Pearl M. Multilevel analyses of neighborhood socioeconomic context and health outcomes: a critical review. J Epidemiol Community Health 2001; 55: 111-22. [ Links ]
19. Turrell G, Sanders AE, Slade GD, Spencer AJ, Marcenes W. The independent contribution of neighbourhood disadvantage and individual-level socioeconomic position to self-reported oral health: a multilevel analysis. Community Dent Oral Epidemiol 2007; 35: 195-206. [ Links ]
20. Coovadia H, Jewkes R, Barron P, Sanders D, McIntyre D. The health and health system of South Africa: historical roots of current public health challenges. The Lancet 2009; 374: 817 - 34. [ Links ]
21. Olutola BG, Ayo-Yusuf OA. Socio-environmental factors associated with self-rated oral health in South Africa: a multilevel effects model. Int J Environ Res Public Health 2012; 9: m3465-83. [ Links ]
22. Locker D, Clarke M, Payne B. Self-perceived oral health status, psychological well-being, and life satisfaction in an older adult population. J Dent Res 2000; 79: 970-5. [ Links ]
23. Slade GD. Derivation and validation of a short-form oral health impact profile. Community Dent Oral Epidemiol 1997; 25: 284-90. [ Links ]
24. Sanders AE, Slade GD, Lim S, Resine ST. Impact of oral diseases on quality of life in the US and Australian populations. Community Dent Oral Epidemiol 2009; 37: 171-81. [ Links ]
25. Galobardes B, Shaw M, Lawlor DA, Lynch J, Smith GD Indicators of socioeconomic position (Part 1). J Epidemiol Community Health 2006; 60: 7-12. [ Links ]
26. Singh-Manoux A, Marmont M, Adler NE. Does subjective social status predict health and change in health status better than objective status? Psychosomatic Medicine 2005; 67: 855-61. [ Links ]
27. Jann B, Zurich ETH. The Blinder-Oaxaca decomposition for linear regression models. Stata J 2008; 8: 453-79. [ Links ]
28. Locker D, Maggirias J, Wexler E. What frames of reference underlie self-ratings of oral health? J Public Health Dent 2009; 69: 78-89. [ Links ]
29. Yen IH, Kaplan GA. Neighborhood social environment and risk of death: multilevel evidence from the Alameda country study. Am J Epidemiol 1999; 149: 898-907. [ Links ]
30. Crocombe LA, Brennan DS, Slade GD. The influence of dental attendance on change in oral health-related quality of life. Community Dent Oral Epidemiol 2012; 40: 53-61. [ Links ]
31. Lesolang RR, Motloba DP, Lallo R. Patterns and reasons for tooth extraction at the Winterveldt clinic: 1998 - 2002. SADJ 2009; 64: 214-218 [ Links ]
32. Marmot M, Allen J, Goldblatt P, Boyce T, McNeish D, Grady M, Geddes I. Fair society, healthy lives: a strategic review of health inequalities in England post-2010. London: University College London. 2010. [ Links ]
33. Carey G, Crammond B, Leeuw E. Towards health equity: a framework for the application of proportionate universalism. International Journal for Equity in Health. (2015) 14:81 DOI 10.1186/s12939-015-0207-6 [ Links ]
 Correspondence:
Imade Ayo-Yusuf
Department of dental management sciences, School of dentistry, Faculty of health sciences, University of Pretoria
P.O. Box 1266, Pretoria 0001 South Africa
Tel: +27 12 319 2526
E-mail: imade.ayoyusuf@up.ac.za
