


Services on Demand
Article
 English (pdf)
 Article in xml format
 Article references
Indicators

Related links
-
 Cited by Google
 -
 Similars in Google
Share

 Permalink
Bothalia - African Biodiversity & Conservation
On-line version ISSN 2311-9284
Print version ISSN 0006-8241
Bothalia (Online) vol.53 n.1 Pretoria 2023
http://dx.doi.org/10.38201/btha.abc.v53.i1.9
ORIGINAL RESEARCH
Urban intensity and flower community structure drive monkey beetle assemblage in Cape Town
Peta D. BromI; Jonathan F. ColvilleII; Leslie G. UnderhillI; Kevin WinterIII
IDepartment of Biological Sciences, University of Cape Town, Cape Town, Western Cape, South Africa
IICentre for Statistics in Ecology, the Environment and Conservation, University of Cape Town, Cape Town, Western Cape, South Africa
IIIDepartment of Environmental and Geographical Sciences, University of Cape Town, Cape Town, Western Cape, South Africa
ABSTRACT
BACKGROUND: Urban landscapes present an important opportunity for pollinator conservation, but little is known about the status and distribution of pollinator populations in urban habitats in Africa. This represents a major gap in the development of a global understanding of urban pollinators - particularly from the rapidly urbanising context. This study uses a speciose clade of flower-visiting beetles (Coleoptera: Scarabaeidae: Hopliini) to explore patterns of pollinator distribution in a major metropolitan area in South Africa
OBJECTIVES: We investigated community composition across gradients of urban intensity (defined according to the percentage of soil-sealing within 1 km2 of each sampling location) and socio-economic status to determine pollinator responses to these urban landscape effects
METHODS: A selection of 142 sites were surveyed twice in the austral spring seasons of 2018 and 2019. Data were collected on habitat structure, flower diversity, and pollinator diversity
RESULTS: The study found that different feeding guilds of monkey beetles favoured different levels of urban intensity and that beetle richness significantly correlated with flower richness. It did not, however, correlate with diversity indicating that abundance is less impacted than the number of species present. Monkey beetles with moderate sensitivity to urban intensity benefitted from the presence of preferred species of flowers
CONCLUSION: Overall, the findings demonstrate the importance of plant community assemblage in supporting urban monkey beetles. We recommend landscaping with preferred flower species in urban parks to support urban pollinators
Keywords: Hopliini; Coleoptera; community assemblage; pollinators; urban ecology; South Africa.
Introduction
Urban environments are important for the conservation and stewardship of healthy pollinator populations (Hall et al. 2017). Globally, studies that investigated the response of pollinators to urban gradients found that certain guilds and taxa can take advantage of the resources and habitat conditions available in cities (Glaum et al. 2017; Theodorou 2020a; Wenzel et al. 2020). Others can do well when particular conditions are met, such as the provision of small scale floral patches or the introduction of preferred plants (Leveau 2013; Si-mao et al. 2018). Another group is negatively impacted by urban intensity (soil-sealing) and is intolerant of urban environments (Theodorou 2020b; Wenzel et al. 2020). A recent global systematic review found a taxonomic and geographic bias. Most studies conducted on urban pollinators reported findings for Hymenoptera, temperate regions, and the global north (n = 99, 117 and 120 studies, respectively). A smaller number reported findings from tropical regions and the global south (n = 24 and 21, respectively) (Wenzel et al. 2020). There is still much to be learned about the responses of other pollinating taxa; cities in the global south; and in under-studied climatic regions, such as tropical, arid and Mediterranean ecosystems (Wenzel et al. 2020). Africa is the most poorly represented continent and offers an opportunity to add to the body of knowledge from a rapidly urbanising perspective (United Nations, Department of Economic and Social Affairs 2018).
Monkey beetles (Scarabaeidae: Hopliini) are diverse in southern Africa and therefore provide adequate richness to observe patterns of change in community compositions. South Africa is a centre of diversity for monkey beetles, where 65% of the world's species and 40% of the genera are concentrated (Colville et al. 2018). The greatest density of monkey beetle species is found in the winter-rainfall region of Namaqualand and the Cape Floristic Region (CFR), where they are important pollinators of several plant families (Bernhardt 2000; Goldblatt & Manning 2011; Mayer et al. 2006). This includes many of the popular flowers that attract local and international tourists during the austral spring season (Kruger et al. 2015). Monkey beetles are especially suitable for study in urban environments because there is existing evidence, which shows that they respond with shifts in feeding guild structure and host plant use in response to human-driven disturbance (Colville et al. 2002, 2018). Additionally, they are easy to collect due to their use of flowers as breeding platforms (Bernhardt 2000; Dafni et al. 1990).
Existing studies have established that biodiversity in urban landscapes is driven by urbanisation (measured by percentage of soil sealing in the surrounding landscape, where soil sealing is the amount of soil under buildings, roads and paving) (McDonnell & Hahs 2008), local habitat characteristics such as dominant land-use or local habitat structure (Theodorou et al. 2017; Theodorou et al. 2020b); and social factors such as socio-economic status and societal norms (Aronson et al. 2016; Lepczyk et al. 2017).
Cape Town is a rapidly urbanising city with a long history of spatially planned social segregation, and land dispossession (Cilliers & Siebert 2012; Lubbe et al. 2010; Rebelo et al. 2011). Until recently, tracts of land remained as natural islands due to their use as buffers between racially divided historical neighbourhoods under Apartheid urban planning (although many of these patches now face encroachment from both planned and unplanned urban expansion), in which neighbourhoods were spatially divided according to race and economic standing (Turok 2011). This legacy remains spatially entrenched.
Economic equality is typically measured by the Gini-coefficient. The closer it is to 1, the more unequal the society, the closer it is to 0, the smaller the difference between the individuals with the highest income and the lowest income. In 2016, Cape Town's Gini-coefficient was estimated at 0.62 (Western Cape Government 2020), slightly more equal than the national value of 0.63, which ranked the country as the most unequal society in the world (World Bank 2014). As such, Cape Town presents steep socio-economic gradients across the city. Cape Town is an important city in which to consider the social and spatial drivers of urban biodiversity because of the mega-diversity of the Cape Floristic Region (CFR) (Rebelo et al. 2011), rapid urbanisation (United Nations, Department of Economic and Social Affairs 2018), and socio-economic inequality.
This study investigates the community composition and distribution of monkey beetles across several environmental gradients in Cape Town, namely: income, urban intensity, and historical soil and vegetation. It compares these data with monkey beetle assemblage response to local habitat and flower community structure. It tests three hypotheses: 1. Monkey beetle feeding guilds will change along environmental gradients (urbanagricultural, urban-natural, and socio-economic gradients); 2. They will associate with specific flower communities (preferred flowers); 3. Beetle and flower diversity are linked.
Study area
Cape Town is the largest city in the Western Cape, South Africa, and has a population of ± 4.5 million citizens (Statistics South Africa 2011). It falls within the CFR, a global biodiversity hotspot with two centres of endemicity (Mittermeier et al. 1999; Rebelo et al. 2011). Within the city metropole, there are 19 vegetation ecosystems (Rebelo et al. 2011). Neighbourhood dwelling density varies from 1 dwelling unit per hectare (du/ha), to 160 du/ha in informal settlements (Mittermeier et al. 1999; Rebelo et al. 2011).
Methods
An environmental gradient is a change in environmental condition across space. Examples of commonly studied gradients include moisture and altitude. Studying environmental gradients help us to understand habitat requirements and species and community responses to changes in abiotic conditions. Urban intensity gradients have been used extensively to monitor the impacts and drivers of biodiversity in cities (Blair 1996; Dubois & Cheptou 2017; Hirzel & Le Lay 2008; Jongman et al. 2006; Lizée et al. 2011).
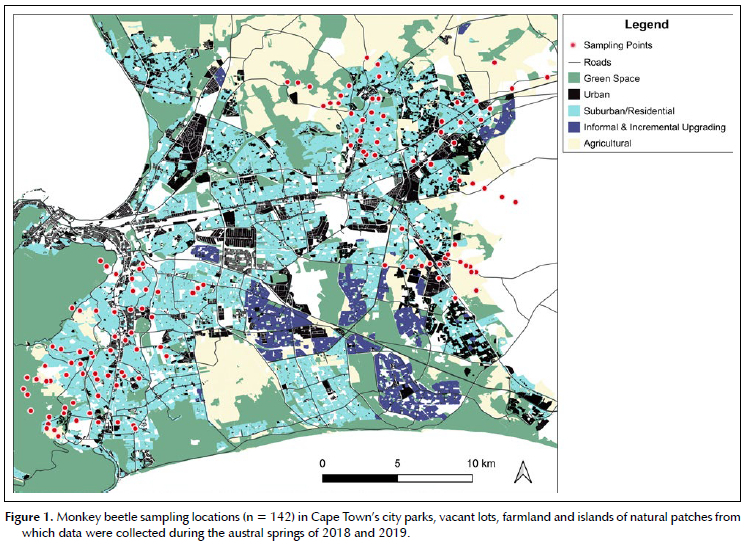
Sampling locations were thus selected across a range of conditions along an urban intensity gradient at ± 1 km intervals. The largest proportion of sites were community or district recreational parks, followed by vacant lots and road verges (Figure 1). Protected areas and cultivated farmland were included to represent unurbanised landscapes. To mitigate the effects of potentially conflicting environmental gradients and underlying heterogeneity, the sampling locations were stratified by historical vegetation type, income, and urban intensity in the second year of sampling. In 2018, 72 sites were visited. In 2019, the location of observation sites was adjusted to reduce the impact of variations in underlying vegetation and soil types across the city (a contextual adjustment that was required due to the underlying heterogeneity), resulting in 70 sites in 2019. The sites in the second year remained in similar locations to the first year. The second year's sampling had greater representative evenness across the urban intensity and economic gradients and corrected oversampling that had occurred in the suburban part of the gradients. In 2018, there were eight urbanisation gradients (five short gradients on the west of the city, two in the north and one to the east); in 2019, there were five gradients (two longer, rationalised gradients to the west, one in the east, one in northeast, one in the north of the city). Each blocked part of the gradient (urban, rural, natural, peri-urban, suburban) had at least six sampling locations within the corresponding block. Each block was sampled at least four times across the duration of the two years. Even though there were minor adjustments to the locations, there were very similar conditions between the years and sites included in each blocked category. Counted without any statistical blocking, the total number of sites was 142. Each of these was independently visited at least twice during 2018-2019 (August-December).
Five sets of blue, yellow and white fluorescent-painted pan traps of 75 mm diameter x 40 mm depth were laid out at 1.5-3.0 m distance from each other in a linear or zig-zag pattern depending on the layout of the site. Pan trap colours were selected for Coleoptera in accordance with the findings of Shrestha et al. (2019) and Vrdoljak and Samways (2012). Each trap received ± 75 ml of 2:1 dilute propylene glycol. Because of permit conditions, traps placed at sites in the South African National Parks (SANParks) properties contained only soapy water. The traps were left in place for 48 hours, allowing at least one clear, warm, sunny day. On collection, the contents of like-coloured pan traps were pooled rendering one sample per trap colour (three samples) per sampling event at each site. Each pooled sample was labelled with the collection date, the location code and the pan trap colour.
Local habitat data were sampled in ten quadrats of 1 m2 in a transect across each site at 2 m intervals (or in a randomised grid if the area of the site was too narrow for a linear transect). Counts of open flowers were recorded within each quadrat. Capitulate flowers were counted as one to the first joint with the main stem. Notes were made of species that were uncommon but present outside of the sampled quadrats on the site. Flowers in the surrounding 30 m radius of the traps were searched for monkey beetles for 15 minutes. As far as possible, three pairs of each species in copula were collected to provide a reference for the identification of sexual dimorphism. The flowers from which the monkey beetles were collected were identified to genus or species level, to provide evidence of the preferences of monkey beetles for colours and for flower species.
Laboratory and desk-top processing
Monkey beetles were separated from the by-catch and were identified to morphospecies level. Representatives of each morphospecies at each site were pinned and an overall representative sample was pinned for cross-checking identification. Where possible, individuals were identified to species level and cross-checked using reference samples in the Iziko Museum of Natural History, Cape Town.
Soil-sealing is the quantity of ground that is covered with buildings and hard surfaces, thereby preventing infiltration and soil penetration by living organisms. The amount of soil-sealing in the surrounding area was used as a proxy for urban intensity. Landscape level patterns were quantified from aerial photographs. Photographs of 1 km2 were extracted from the Google Earth Engine by loading the GPS co-ordinates of sampling locations into a semi-automated urban intensity scoring tool that runs on machine learning and was developed by Seress et al. (2014). The GPS points entered into the database were centralised to the position where pan traps were placed at each observation site. The semi-automated urban scoring tool requires a minimum of three training points per image (captured by the researchers). It quantifies the area under building, vegetation and roads; it next conducts Principal Components Analysis (PCA) to generate an urban index score. The output file contains data on vegetative cover, buildings, roads and a total PCA urbanisation score (Seress et al. 2014).
Historical vegetation information was extracted by importing the national vegetation map (Mucina & Rutherford 2006) into QGIS (version 3.6.1) and using the point-picker tool to select the data that correspond with the GPS co-ordinates at each sampling location. The shapefile used for this was the South African Vegmap (Mucina & Rutherford 2006) downloaded from the South African National Biodiversity Institute's (SANBI) biodiversity GIS web portal (www.bgis.sanbi.org). Site size was extracted in QGIS (version 3.6.1) from the Cape Town City Council's 2016 Integrated Zoning Map (City of Cape Town 2017). Sites were post-coded to small (< 0.5 ha), medium (0.5-40 ha) and large ( > 40 ha). Income data was sourced from the 2011 census (Statistics South Africa 2011), which reported mean household income by suburb. Values were post-classified into low = R0-R17 246, medium = R17 246-34 492, and high > R34 492, using the equal interval method.
Two separate data matrices consisting of counts of monkey beetle and flowers at each site were constructed. The matrix for the monkey beetles had 142 rows (sites) and 30 columns (Hopliini morphospecies) and the flowers contained 140 rows (sites) and 81 columns (flower species). Two sites had no flowers in bloom due to recent mowing. The elements of the matrices were square-root transformed and two dissimilarity matrices constructed using the Bray-Curtis index in Primer v 6.1.16 (Bray & Curtis 1957; Clarke & Gorley 2006). The one dissimilarity matrix contained dissimilarities between flower species (81 x 81), and the other one between beetle species (30 x 30). Hierarchical cluster analysis (group averages algorithm) were performed on both dissimilarity matrices (Kruskal 1964). Then non-metric multi-dimensional scaling (NMDS) was performed for both. The cluster analysis was overlain over the two-dimensional configuration generated by the NMDS (Everitt et al. 2011). Monkey beetle and flower species that were seen to be outliers in the NMDS and cluster analysis were mostly species which were seldom recorded (< 5 locations) and these rare species were removed from the dataset, so the dimensions of the dissimilarity matrices became smaller.
The NMDS and cluster analyses identified communities of co-occurring monkey beetles in the one matrix, and communities of co-occurring flowers in the other matrix. The groups generated by the hierarchical cluster analysis were added to the NMDS configuration as sets and subsets. Species-sets were grouped into a data vector (i.e., abundance was summed into one column) for each set and subset. Thus analysis was performed on groups of co-occurring monkey beetles and co-occurring flowers. Tests were run to determine what caused the beetle communities to cluster at different locations (i.e., was it the presence of specific flower communities or environmental factors?).
For economic and environmental factors, Kruskal-Wallis tests (Kruskal & Wallis 1952) were performed to test the null hypothesis that the species were randomly distributed across the categorical levels. Spearman's rank correlations (Glasser & Winter 1961) were calculated between the ranked sets and aggregated by each of the environmental factors to understand the direction of those relationships for which the null hypothesis could be rejected.
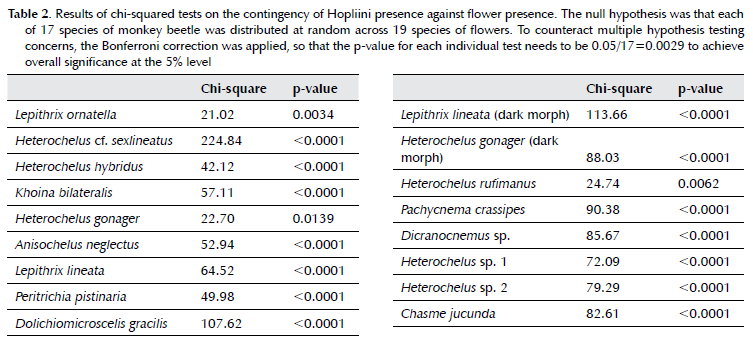
To examine the relationship between flowers and monkey beetles, the null hypothesis that monkey beetle species would be randomly distributed across flower species was tested. A contingency table was generated for each monkey beetle species with cells containing the count of the number of sites at which each monkey beetle species was present or absent for each of the flower species. The chi-squared test of independence was performed on each table (Fisher 1922). If the test for a particular monkey beetle was significant, the frequency of co-occurrence with each flower species was ranked; this provided an indication of which flower species are associated with each monkey beetle. Because the data collection was done at the site level, there is a risk of producing misleading results in the context in which two flower species co-occur, but only one is attractive to monkey beetles. Hence, results were corroborated with field collections of monkey beetles collected off flowers and by examining the clustering of flower communities in the non-metric multi-dimensional scaling plots.
To investigate the relationship between the flower diversity and beetle diversity, two diversity indices (Shannon H-index, Inverse Simpson) (Hill 1973) were calculated at each of the 140 sites for both flowers and beetles, using the 'vegan' package (Oksanen et al. 2020) in R (RStudio version 3.6.0). Additionally, species richness (number of species) was calculated. Spearman's correlation was calculated for each diversity index and for species richness. In all statistical hypothesis testing, Bonferroni corrections were made if appropriate (Bon-ferroni 1936).
Results
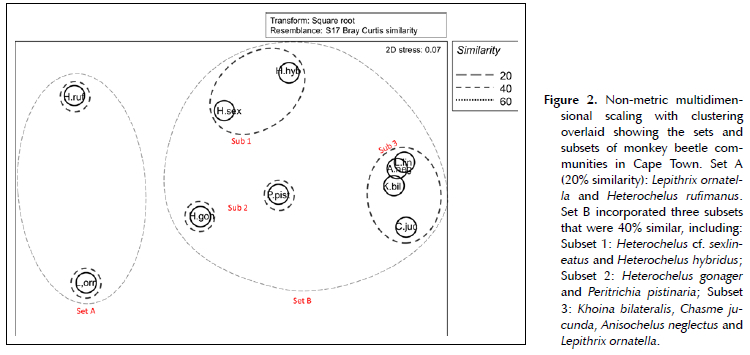
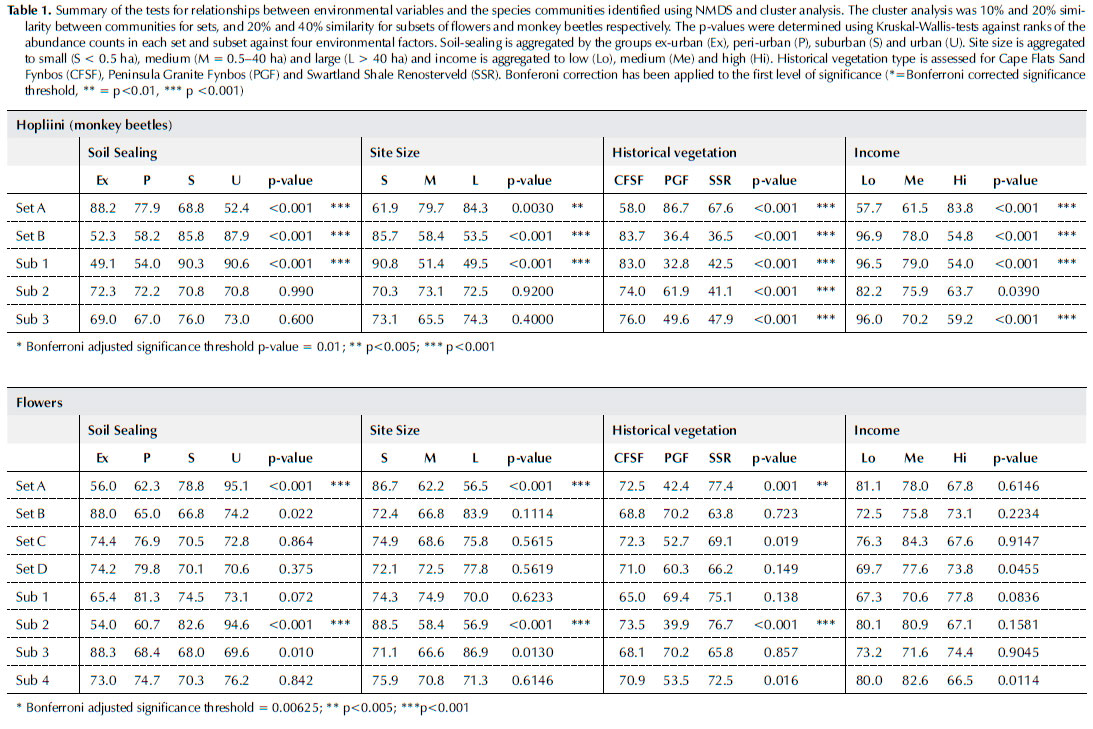
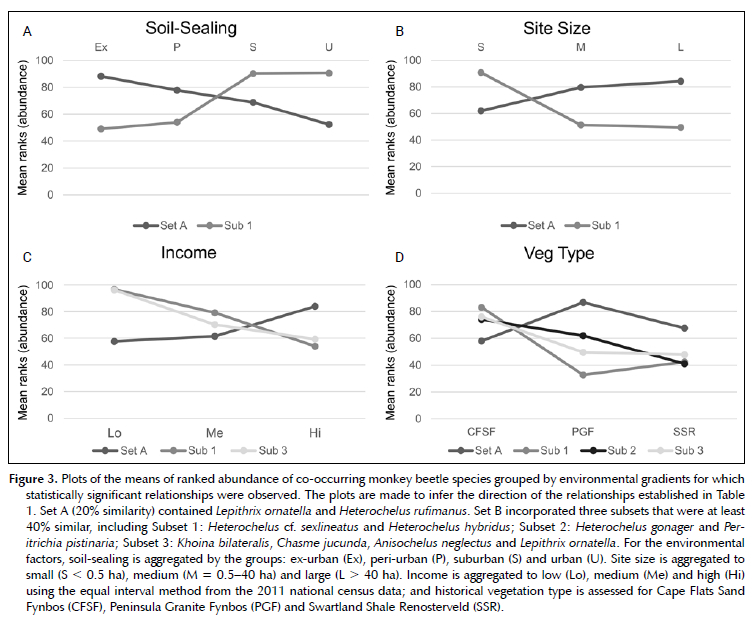
A total of 19 387 individuals of monkey beetles were collected across 30 morpho-species. Non-metric multi-dimensional scaling and clustering produced two sets with 20% similarity (Set A and Set B) of commonly co-occurring monkey beetles (Figure 2). Set A included Lepithrix ornatella and Heterochelus rufimanus. The abundance of the species in Set A decreased with urban intensity and increased with site area. Set B incorporated eight species of monkey beetles. The abundance of individuals of each species in Set B increased with soil-sealing and decreased with site size, however when the subsets of Set B were assessed (40% similarity), only Subset 1 incorporating Heterochelus cf. sexlineatus and Heterochelus hybridus showed any relationship with soil-sealing. The underlying ecosystem, (soil and historical vegetation) was the main driver for the clustering of Subsets 2 and 3 (Table 1; Figure 3).
Flowers and beetles
Monkey beetle species composition was influenced by flower species assemblage at the local habitat scale for most species. The null hypothesis that beetles were randomly distributed across flower communities was rejected for all species except for Lepithrix ornatella, Heterochelus gonager and Heterochelus rufimanus. (Table 2). These species clustered in the NMDS results in Set A and were found in peri-urban areas and larger green areas, and indicate that the monkey beetle species L. ornatella, H. gonager and H. rufimanus have a generalist preference for flowers but require a greater percentage of green cover. For all other species, the flower species assemblage attracted specific monkey beetles to the site.
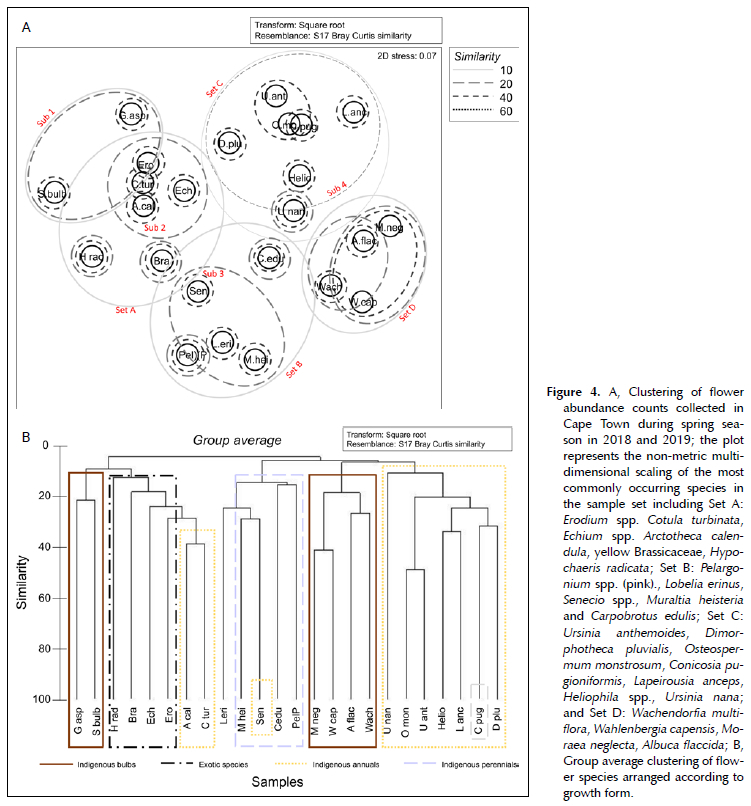
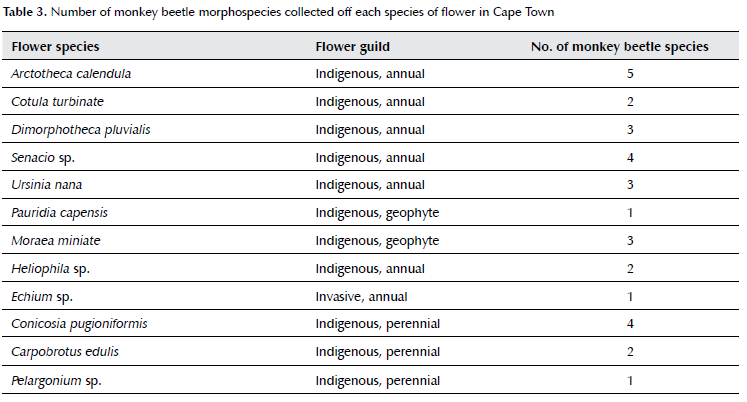
In the cluster analysis, the flower communities formed four co-occurring sets (10% similarity) and a further four subsets (20% similarity). Their clustering is attributable both to growth form and to location (Figure 4). For flowers, Set A consisted of ruderal species including exotic and invasive weeds and the most common indigenous annuals. Set B was a combination of annuals and indigenous perennials. Apart from Conicosia pugioniformis, which is a disturbance tolerant species that resprouts from its taproot, Set C contained indigenous annuals. Set D contained indigenous geophytes. Monkey beetle collections made from flowers provided insights into which of the flower species within subcommunities were most preferred by each of the monkey beetles species (Table 3).
There was no relationship between overall floral diversity and beetle diversity (p>0.05). Monkey beetle and flower species richness (number of species), however, showed a positive correlation (rho=0.31, p<0.001).
Discussion
This study revealed patterns in pollinator assemblage in response to urban landscape environmental gradients. It also identified species of flowers favoured by monkey beetles. Monkey beetle guilds, environmental gradients and flower preference are discussed below.
Divergent responses according to guilds
In response to urban intensity, the findings of this study were consistent with those done in other parts of the world for Hymenoptera. Some species exploit urban conditions, some species avoid them, and others depended on connected flower communities to move through the urban landscape (Wenzel et al. 2020). The divergence in bees is associated with differences in nesting requirements, body size and life histories (e.g., ground-nesting bees decline with an increase in urban intensity, and cavity nesters increase) (Brom et al. 2022; Cane et al. 2006; Merckx et al. 2018; Shwartz et al. 2014).
Not much is known about the life histories of monkey beetles, but some understanding of their behaviour and feeding differences is known (Colville et al. 2018; Karolyi et al. 2016; Mayer et al. 2006; Picker & Midgley 1996). Existing studies have demonstrated a shift in feeding guilds along disturbance gradients towards the embedding guild, which favours ruderal species (Colville et al. 2002). Monkey beetles utilise flowers as a breeding platform during the austral spring floral flush (Goldblatt & Manning 2011). The mechanism for pollination is the presence of hair-like setae on the backs and bodies of the beetles, which collect and deposit pollen loads during their movement across and between flowers (Bernhardt 2000; Mayer et al. 2006; Mayer & Pufal 2007). Three feeding and breeding guilds have been identified according to feeding and behaviour (Colville et al., 2002; Karolyi et al. 2016; Picker & Midgley 1996). Monkey beetle behaviour is classified either as embedding or non-embedding, where females in the embedding guild bury their heads into the centre of the flower while males compete over them to mate. Thus the males are predominantly responsible for the pollination because they fly between flowers looking for females (Bernhardt 2000). Embedding guilds eat pollen and nectar and are attracted to flowers with long-wave colours (red, orange and yellow). The non-embedding guilds are split into two groups, by colour attraction. One non-embedding guild is attracted to short-wave (blue, pink and violet) coloured flowers, and the other is attracted to long-wave colours (Colville et al. 2018; Picker & Midgley 1996). Lepithrix, Anisonyx and Peritrichia are recorded as feeding on pollen and do not embed themselves, whereas species in the genus Heterochelus tend to embed themselves (Picker & Midgley 1996). The non-embedding group are characterised by being hairy and mobile, moving around between flowers more frequently than their embedding counterparts. For this reason, they are considered to be more effective pollinators (Goldblatt & Manning 2011).
Response to urban environmental gradients
Comparisons between natural and agricultural landscapes revealed that monkey beetle species composition changes along gradients of disturbance where a 'shift away from perennial and bulb pollinator guilds towards those favouring weedy annuals' has been observed (Colville et al. 2002). The findings of this study were consistent with those earlier studies in that there was a shift towards species favouring ruderal annuals as soil-sealing (disturbance) increased. Specifically, the embedding Heterochelus cf. sexlineatus and Heterochelus hybridis were associated with ephemeral plants, including ruderal asters and indigenous annuals, and were abundant in urban landscapes in suburbs and close to commercial centres. Chasme jucunda, Khoina bilateralis, Anisochelus neglectus, Lepithrix liniata and Peritrichia pistinaria are species of the 'non-embedding' guild (Picker & Midgley 1996). They are typically sensitive to disturbance, associate with somewhat established floral communities containing perennials and geophytes (Colville et al. 2002), and, in this study, were found in large (> 30 ha), relatively undisturbed islands in the city. These findings are consistent with earlier studies along disturbance gradients in agricultural landscapes (Colville et al. 2002).
The phenomenon of an increase in biodiversity with wealth is known as the 'luxury effect' (Wu et al. 2014) and has been demonstrated across several studies and taxonomic groups (Aronson et al. 2016; Lubbe et al. 2010; Ossola & Hopton 2018; Venter et al. 2020). This can be attributed to the fact that the number and size of community parks decreases as income decreases (Venter et al. 2020), but poverty is also associated with an increase in population density and urban cover, thereby representing a particularly dense form of urbanism (Turok 2011; Wilkinson 2000), particularly in areas of unplanned expansion and informality (Gómez-Baggethun et al. 2013). It is therefore unsurprising that the guilds of monkey beetles that respond negatively to urban densification, also respond negatively to a decrease in income, and vice-versa, and the correlation with income is not necessarily causative, but rather can be seen as a driver of other intervening processes (e.g., loss of green infrastructure). A study conducted on weedy species in okra cultivation in West Africa found, for example, that morphological plant traits were most affected by agricultural practices that were influenced by farmers' socio-economic background and market orientation (i.e., for sale vs for personal consumption), however more critical changes in functional guilds were observed due to a decrease in animal grazing along the rural to urban gradient: weed species reliant on animal dispersal were more present in rural and peri-urban study sites (Stenchly et al. 2017). In this study, parks in poorer communities were either benignly neglected or over-used, while those in wealthier neighbourhoods appeared to have larger, more frequently maintained lawns, unless there was an active strategic spring mowing suspension during the sampling period. Furthermore, the density of poorer neighbourhoods means that there is less available private green infrastructure in the form of gardens. Additional research on the effects of socio-economic status on factors such as actual maintenance frequency, foot traffic volumes and grass length during sampling would likely provide a more detailed and meaningful interpretation of the habitat dynamics driving plant and pollinator assemblages across the socio-economic gradient.
The role of flower preference
Monkey beetles are generalist pollinators and most species will visit at least two species of flowers (Mayer et al. 2006; Steiner 1998). Records of flower visitations by monkey beetles to date have peaked at a maximum of five monkey beetle species per flower species (Mayer et al. 2006). Determining the relative preference and attractiveness of different flowers to monkey beetles was outside of the scope and objectives of this study, however the results of collections from flowers and field observations provide preliminary indications of the ways in which flowers are being used by monkey beetles in urban habitats within Cape Town. Further research investigating visitation rates is needed to confirm and clarify the relative importance of these species, however, when Table 3 and Supplementary Tables 1 and 2 are read together, co-occurrence data and the number of monkey beetle species collected off flower species point to the relative preferences for certain flowers. Of those observed, the most popular species were Heliophila africana and Heliophila coronopifolia, which were preferred by non-embedding monkey beetles who favour shortwave colours (visited by two species); Conicosia pugioniformis was preferred by the non-embedding guilds who favour long-wave colours (visited by four species); Dimorphotheca pluvialis, and Ursinia nana were visited by the embedding guild (three species); and Arctotheca calendula and Senecio sp., which are both mass-flowering spring annuals, and which can cover entire parks, were favoured by the embedding guild (three and four species respectively), but were also visited by the more sensitive non-embedding guild that were limited to peri-urban areas. These rates of 'most popular' are similar to other studies conducted in natural landscape settings (Mayer et al. 2006), indicating the viability of supporting monkey beetles through the introduction (or preservation) of targeted species of preferred flowers.
The occurrence of short-wave, non-embedding guilds was less common and associated with fewer flower species, which were relatively isolated across the city. Sites where floral communities included the most popularly visited species from all guilds, including D. pluvialis, C. pugioniformis and species of Heliophila, supported greater monkey beetle richness as reflected in the correlation between monkey beetle and flower species richness. It is therefore not only floral richness, but the presence of species preferred by the various guilds that drives monkey beetle richness.
Worth noting is that there was a relationship between richness but not abundance (diversity indices include calculations based on abundance), and that beetle species have preferred flowers; they are found where their preferred flowers occur. Some of the natural islands supported groups of flowers that were preferred by different species of beetles, but the abundance counts were hugely variable so we could not reject the null hypothesis that monkey beetle abundance was driven by flower abundance. One explanation could be based on temperatures. Weather in spring time is highly variable. Possibly, abundance was more directly affected by temperature on a given day.
Several studies conducted on urban pollinators have previously discussed the role of supplementary planting in urban landscapes and investigated the relative attractiveness of different species of plants in order to compile lists of recommended 'pollinator friendly' plants, or to assess the availability of foraging resources (Baldock et al. 2015; Garbuzov & Ratnieks 2014, 2015; Lowenstein et al. 2019; Martins et al. 2017; Michotap et al. 2018).
Garbuzov et al. (2017) tested if plants being advertised as 'pollinator friendly' by garden centres were accurately reflecting pollinator preferences and compared relative attractiveness of garden plants to generate a list of preferred species for their city (Garbuzov & Ratnieks 2014, 2015). Pauw and Louw (2012) considered the distribution of nectarivorous birds in Cape Town and suggested that the functional diversity of this bird guild could be restored across the city with strategic garden planting and the introduction of favoured plants. Introducing preferred species at regular intervals throughout the city can aid monkey beetle mobility and provide stepping stones between larger fragments. This could potentially be achieved by strategically identifying suitable pathways and implementing targeted landscaping along those routes (Cranmer et al. 2012; Simao et al. 2018). In addition to benefitting monkey beetles, other pollinators would be able to make use of the flower resources for foraging and as stepping stones (Brom et al. 2022). Collections from Conicosia pugioniformis consistently hosted the greatest number of monkey beetle species at any one site and was often found growing together with Carpobrotus edulis, a popular road verge plant for its hardiness, ease of propagation and brightly coloured flowers. Conicosia pugioniformis can easily be introduced as a co-plant to C. edulis along road verges and city parks. Further research is needed to determine the extent to which the introduction of favoured short-wave plants (e.g., Heliophila spp.), could restore the connectivity of landscapes for the non-embedding guild favouring blue and pink coloured flowers.
Conclusion
In this study, the distribution of monkey beetles was sampled in a metropolitan city in the Cape Floristic Region of southern Africa. It aimed to determine how monkey beetles were responding to urban environmental gradients and local habitat conditions. It found an established community of monkey beetles was responding in different ways to urban gradients. Embedding species were more tolerant of soil-sealing, congregating on ephemeral species of Asteraceae and geophytes. Non-embedding species were associated with preferred flower species and reduced abundance was recorded as soil-sealing increased in the surrounding landscape. Non-embedding species demonstrated a need for a greater percentage of green space in the surrounding landscapes, but this sensitivity can be mitigated with the introduction of preferred species of flowers. Conicosia pugioniformis in particular, hosted the greatest richness of monkey beetles at within-site scale, but the sites containing combinations of Heliophila africana, Dimorphotheca pluvialis, Ursinia nana and Senecio littoreus, together as dominant species, provided the scaffolding for supporting healthy populations of monkey beetles. The findings suggest that widespread introduction of a community of beetle-preferred flowers, including C. pugioniformis as a cornerstone species, to provide stepping-stones through the urban matrix, will aid monkey beetle mobility.
This study found that there is an intact community of monkey beetles in the city, and that there is a reliance on particular plant communities for breeding and foraging. This finding is promising for the conservation of rare bulbs within the urban landscape, which rely on a healthy population of monkey beetles for pollination services (Barraclough & Slotow 2010; Goldblatt et al. 2013; Goldblatt & Manning 2006; Johnson & Steiner 2003; Steiner 1998).
Acknowledgements
Permits were obtained from Cape Nature (permit number: CN44-28-9351), SANParks (permit number: CRC/2019-2020/007-2019/v1), and land-owner permission was sought from the City of Cape Town area managers, superintendents, and the Parks and Recreation Department of Biodiversity Management.
This work was supported by the SASAC/NRF scholarship grant number SASAC 170914262644.
References
Aronson, M.F.J., Nilon, C.H., Lepczyk, C.A., Parker, T.S., Warren, PS., Cilliers, S.S., Goddard, M.A., Hahs, A.K., Herzog, C., Katti, M., La Sorte, F.A., Williams, N.S.G. & Zipperer, W., 2016, 'Hierarchical filters determine community assembly of urban species pools', Ecology 97(11), 29522963, https://doi.org/10.1002/ecy.1535. [ Links ]
Baldock, K.C.R., Goddard, M.A., Hicks, D.M., Kunin, W.E., Mitschunas, N., Osgathorpe, L.M., Potts, S.G., Robertson, K.M., Scott, A.V., Stone, G.N., Vaughan, I.P. & Memmott, J., 2015, 'Where is the UK's pollinator biodiversity? The importance of urban areas for flower-visiting insects', Proceedings of the Royal Society B: Biological Sciences 282(1803), 20142849, https://doi.org/10.1098/rspb.2014.2849. [ Links ]
Barraclough, D. & Slotow, R., 2010, 'The South African keystone pollinator Moegistorhynchus longirostris (Wiedemann, 1819) (Diptera: Nemestrinidae): Notes on biology, biogeography and proboscis length variation', African Invertebrates 51(2), 397-403, https://doi.org/10.5733/afin.051.0208. [ Links ]
Bernhardt, P, 2000, 'Convergent evolution and adaptive radiation of beetle-pollinated angiosperms', Plant Systematics and Evolution 222(1-4), 293-320, https://doi.org/10.1007/BF00984108. [ Links ]
Blair, R.B., 1996, 'Land use and avian species diversity along an urban gradient', Ecological Applications 6(2), 506-519, https://doi.org/10.2307/2269387. [ Links ]
Bonferroni, C.E., 1936, 'Teoria statistica delle classi e calcolo delle probabilitá', Pubblicazioni del R Istituto Superiore di Scienze Economiche e Commerciali di Firenze 8, https://doi.org/10.4135/9781412961288.n455. [ Links ]
Bray, J.R. & Curtis, J.T., 1957, 'An ordination of the upland forest communities of southern Wisconsin', Ecological Monographs 27(4), 325-349, https://doi.org/10.2307/1942268. [ Links ]
Brom, P., Underhill, L.G. & Winter, K., 2022, 'A review of the opportunities to support pollinator populations in South African cities', PeerJ 10, https://doi.org/10.7717/peerj.12788. [ Links ]
Cane, J.H., Minckley, R.L., Kervin, L.J., Roulston, T.H. & Williams, N.M., 2006, 'Complex responses within a desert bee guild (Hymenoptera: Apiformes) to urban habitat fragmentation', Ecological Applications 16(2), 632-644, https://www.jstor.org/stable/40061683. [ Links ]
Cilliers, S.S. & Siebert, S.J., 2012, 'Urban ecology in Cape Town: South African comparisons and reflections', Ecology and Society 17(3), 33, https://doi.org/10.5751/ES-05146-170333. [ Links ]
City of Cape Town, 2017, Municipal Planning By-law. [ Links ]
Clarke, K.R. & Gorley, R.N., 2006, Primer v6: User Manual/ Tutorial, Plymouth Marine Laboratory. [ Links ]
Colville, J.F., Picker, M.D. & Cowling, R.M., 2002, 'Species turnover of monkey beetles (Scarabaeidae: Hopliini) along environmental and disturbance gradients in the Namaqualand region of the succulent Karoo, South Africa', Biodiversity and Conservation 11(2), 243-264, https://doi.org/10.1023/A:1014520226989. [ Links ]
Colville, J.F., Picker, M.D. & Cowling, R.M., 2018, 'Feeding ecology and sexual dimorphism in a speciose flower beetle clade (Hopliini: Scarabaeidae)', PeerJ 6, e4632, https://doi.org/10.7717/peerj.4632. [ Links ]
Cranmer, L., McCollin, D. & Ollerton, J., 2012, 'Landscape structure influences pollinator movements and directly affects plant reproductive success', Oikos 121(4), 562-568, https://doi.org/10.1111/j.1600-0706.2011.19704.x. [ Links ]
Dafni, A., Bernhardt, P, Shmida, A., Ivri, Y., Greenbaum, S., O'Toole, C.H. & Losito, L., 1990, 'Red bowl-shaped flowers: convergence for beetle pollination in the Mediterranean region', Israel Journal of Botany, 39(1-2), 81-92, https://doi.org/https://doi.org/10.1080/0021213X.1990.10677134. [ Links ]
Dubois, J. & Cheptou, PO., 2017, 'Effects of fragmentation on plant adaptation to urban environments', Philosophical Transactions of the Royal Society B: Biological Sciences 372, 20160038, https://doi.org/10.1098/rstb.2016.0038. [ Links ]
Everitt, B.S., Landau, S., Leese, M. & Stahl, D., 2011, Cluster Analysis, 5th Edition, Everitt-Wiley Online Library, http://onlinelibrary.wiley.com/book/10.1002/9780470977811. [ Links ]
Fisher, R.A., 1922, 'On the interpretation of ΧΛ2 from contingency tables, and the calculation of P', Royal Statistical Society 85(1), 87-94, https://www.jstor.org/stable/2340521. [ Links ]
Garbuzov, M., Alton, K. & Ratnieks, F.L.W., 2017, 'Most ornamental plants on sale in garden centres are unattractive to flower-visiting insects', PeerJ 5(3), e3066, https://doi.org/10.7717/peerj.3066. [ Links ]
Garbuzov, M. & Ratnieks, F.L.W., 2014, 'Quantifying variation among garden plants in attractiveness to bees and other flower-visiting insects', Functional Ecology 28(2), 364-374, https://doi.org/10.1111/1365-2435.12178. [ Links ]
Garbuzov, M. & Ratnieks, F.L.W., 2015, 'Using the British national collection of asters to compare the attractiveness of 228 varieties to flower-visiting insects', Environmental Entomology 44(3), 638-646, https://doi.org/10.1093/ee/nvv037. [ Links ]
Glasser, G.J. & Winter, R.F., 1961, 'Critical values of coefficient of rank correlation for testing the hypothesis of independence', Biometrika 48(3), 444-448. [ Links ]
Glaum, P, Simao, M.-C., Vaidya, C., Fitch, G. & lulinao, B., 2017, 'Big city Bombus: using natural history and land-use history to find significant environmental drivers in bumble-bee declines in urban development', Royal Society Open Science 4(5), 170156, https://doi.org/10.1098/rsos.170156. [ Links ]
Goldblatt, P. & Manning, J.C., 2006, 'Radiation of pollination systems in the Iridaceae of sub-Saharan Africa', Annals of Botany 97(3), 317-344, https://doi.org/10.1093/aob/mcj040. [ Links ]
Goldblatt, P. & Manning, J.C., 2011, 'Hopliine beetles (Scarabaeidae: Rutelinae: Hopliini), specialized pollinators of the Southern Africa Flora', Curtis's Botanical Magazine 28(4), 238-259, https://doi.org/10.1111/j.1467-8748.2011.01752.x. [ Links ]
Goldblatt, P., Bernhardt, P. & Manning, J.C., 2013, 'Pollination of petaloid geophytes by monkey beetles (Scarabaeidae: Rutelinae: Hopliini) in Southern Africa', Annals of the Missouri Botanical Garden 85(2), 215-230. [ Links ]
Gómez-Baggethun, E., Gren, Α., Barton, D.N., Langemeyer, J., Mcphearson, T., Farrell, P.O., Andersson, E., Ham-stead, Z. & Kremer, P, 2013, 'Urban Ecosystem Services', in Urbanization, Biodiversity and Ecosystem Services: Challenges and Opportunities (pp. 175-251), https://doi.org/10.1007/978-94-007-7088-1. [ Links ]
Hall, D.M., Camilo, G.R., Tonietto, R.K., Ollerton, J., Ahrné, K., Arduser, M., Ascher, J.S., Baldock, K.C.R., Fowler, R., Frankie, G., Goulson, D., Gunnarsson, B., Hanley, M.E., Jackson, J.I., Langellotto, G., Lowenstein, D., Minor, E.S., Philpott, S.M., Potts, S.G., ... & Threlfall, C.G., 2017, 'The city as a refuge for insect pollinators', Conservation Biology 31(1), 24-29, https://doi.org/10.1111/cobi.12840. [ Links ]
Hill, M.O., 1973, 'Diversity and evenness: a unifying notation and its consequences', Ecology 54(2), 427-432, https://www.jstor.org/stable/1934352. [ Links ]
Hirzel, A.H. & Le Lay, G., 2008, 'Habitat suitability modelling and niche theory', Journal of Applied Ecology 45(5), 1372-1381, https://doi.org/10.1111/j.1365-2664.2008.01524.x. [ Links ]
Johnson, S.D. & Steiner, K.E., 2003, 'Specialized pollination systems in southern Africa', South African Journal of Science 99(August), 345-348. [ Links ]
Jongman, R.H.G., Bunce, R.G.H., Metzger, M.J., Mücher, C.A., Howard, D.C. & Mateus, V. L., 2006, 'Objectives and applications of a statistical environmental stratification of Europe', Landscape Ecology 21(3 SPEC. ISS.), 409-419, https://doi.org/10.1007/s10980-005-6428-0. [ Links ]
Karolyi, F., Hansal, T., Krenn, H.W. & Colville, J.F., 2016, 'Comparative morphology of the mouthparts of the mega-iverse South African monkey beetles (Scarabaeidae: Hopliini): feeding adaptations and guild structure', PeerJ 2016(1), e1597, https://doi.org/10.7717/peerj.1597. [ Links ]
Kruger, M., Viljoen, A. & Saayman, M., 2015, 'Why pay to view wildflowers in South Africa?', Tourism Analysis 20(1), 81-97, https://doi.org/10.3727/108354215X14205687167707. [ Links ]
Kruskal, J.B., 1964, 'Nonmetric multidimensional scaling: a numerical method', Psychometrika 29(2), 115-129, https://doi.org/10.1007/BF02289694. [ Links ]
Kruskal, W.H. & Wallis, W.A., 1952, 'Use of ranks in one-criterion variance analysis', Journal of the American Statistical Association 47(260), 583-621, https://doi.org/10.1080/01621459.1952.10483441. [ Links ]
Lepczyk, C.A., Aronson, M.F.J., Evans, K.L., Goddard, M.A., Lerman, S.B. & MacIvor, J.S., 2017, 'Biodiversity in the city: fundamental questions for understanding the ecology of urban green spaces for biodiversity conservation', BioScience 67(9), 799-807, https://doi.org/10.1093/biosci/bix079. [ Links ]
Leveau, L.M., 2013, 'Bird traits in urban-rural gradients: how many functional groups are there?', Journal of Ornithology 154(3), 655-662, https://doi.org/10.1007/s10336-012-0928-x. [ Links ]
Lizée, M.H., Mauffrey, J.F., Tatoni, T. & Deschamps-Cottin, M., 2011, 'Monitoring urban environments on the basis of biological traits', Ecological Indicators 11(2), 353-361, https://doi.org/10.1016/j.ecolind.2010.06.003. [ Links ]
Lowenstein, D.M., Matteson, K.C. & Minor, E.S., 2019, 'Evaluating the dependence of urban pollinators on ornamental, non-native and "weedy" floral resources', Urban Ecosystems 22(2), 293-302, https://doi.org/10.1007/s11252-018-0817-z. [ Links ]
Lubbe, C.S., Siebert, S.J. & Cilliers, S.S., 2010, 'Political legacy of South Africa affects the plant diversity patterns of urban domestic gardens along a socio-economic gradient', Scientific Research and Essays 5(19), 2900-2910, https://doi.org/https://doi.org/10.5897/SRE.9000741. [ Links ]
Martins, K.T., Gonzalez, A. & Lechowicz, M.J., 2017, 'Patterns of pollinator turnover and increasing diversity associated with urban habitats', Urban Ecosystems 20(6), 1359-1371, https://doi.org/10.1007/s11252-017-0688-8. [ Links ]
Mayer, C. & Pufal, G., 2007, 'Investigation of the breeding systems of four Aizoaceae species in Namaqualand, South Africa', South African Journal of Botany 73(4), 657-660, https://doi.org/10.1016/j.sajb.2007.06.001. [ Links ]
Mayer, C., Soka, G. & Picker, M., 2006, 'The importance of monkey beetle (Scarabaeidae: Hopliini) pollination for Aizoaceae and Asteraceae in grazed and ungrazed areas at Paulshoek, Succulent Karoo, South Africa', Journal of Insect Conservation 10(4), 323-333, https://doi.org/10.1007/s10841-006-9006-0. [ Links ]
McDonnell, M.J. & Hahs, A.K., 2008, 'The use of gradient nalysis studies in advancing our understanding of the ecology of urbanizing landscapes: current status and future directions', Landscape Ecology 23(10), 1143-1155, https://doi.org/10.1007/s10980-008-9253-4. [ Links ]
Merckx, T., Kaiser, A. & Van Dyck, H., 2018, 'Increased body size along urbanization gradients at both community and intraspecific level in macro-moths', Global Change Biology 24(8), 3837-3848, https://doi.org/10.1111/gcb.14151. [ Links ]
Michotap, P, Kelm, M. & Sikora, A., 2018, 'Potential of an algorithm in assessing attractiveness of flowering plants to bumblebees (Hymenoptera: Apidae) and their subsequent protection as pollinators', Journal of Entomological Science 53(2), 251-267, https://doi.org/10.18474/JES17-68.1. [ Links ]
Mittermeier, R., Gil, P.R., Mittermeier, C.G. & Myers, N., 1999, Hotspots: Earth's biologically richest and most endangered terrestrial ecoregions, CEMEX, https://www.cab-direct.org/cabdirect/abstract/19382700446. [ Links ]
Mucina, L. & Rutherford, M. (eds), 2006, 'The vegetation of South Africa, Lesotho and Swaziland', Strelitzia 19, South African National Biodiversity Institute, Pretoria. [ Links ]
Oksanen, A.J., Blanchet, F.G., Friendly, M., Kindt, R., Legendre, P., Mcglinn, D., Minchin, P.R., Hara, R.B.O., Simpson, G.L., Solymos, P, Stevens, M.H.H. & Szoecs, E., 2020, Package 'Vegan' - community ecology package version 2.5-7. [ Links ]
Ossola, A. & Hopton, M.E., 2018, 'Measuring urban tree loss dynamics across residential landscapes', Science of the Total Environment 612, 940-949, https://doi.org/10.1016/j.scitotenv.2017.08.103. [ Links ]
Pauw, A. & Louw, K., 2012, 'Urbanization drives a reduction in functional diversity in a guild of nectar-feeding birds', Ecology and Society 17(2), Art. 27, https://doi.org/10.5751/ES-04758-170227. [ Links ]
Picker, M.D. & Midgley, J., 1996, 'Pollination by monkey beetles (Coleoptera: Scarabaeidae: Hopliini): flower and colour preferences', African Entomology 4(1), 7-14. [ Links ]
Rebelo, A.G., Holmes, PM., Dorse, C. & Wood, J., 2011, 'Impacts of urbanization in a biodiversity hotspot: conservation challenges in metropolitan Cape Town', South African Journal of Botany 77(1), 20-35, https://doi.org/10.1016/j.sajb.2010.04.006. [ Links ]
Seress, G., Lipovits, Á., Bókony, V. & Czúni, L., 2014, 'Quantifying the urban gradient: a practical method for broad measurements', Landscape and Urban Planning 131, 4250, https://doi.org/10.1016/j.landurbplan.2014.07.010. [ Links ]
Shrestha, M., Garcia, J.E., Chua, J.H.J., Howard, S.R., Tscheulin, T., Dorin, A., Nielsen, A. & Dyer, A.G., 2019, 'Fluorescent pan traps affect the capture rate of insect orders in different ways', Insects 10(2), 40, https://doi.org/10.3390/insects10020040. [ Links ]
Shwartz, A., Turbé, A., Simon, L. & Julliard, R., 2014, 'Enhancing urban biodiversity and its influence on city-dwellers: an experiment', Biological Conservation 171, 82-90, https://doi.org/10.1016/j.biocon.2014.01.009. [ Links ]
Simao, M.C.M., Matthijs, J. & Perfecto, I., 2018, 'Experimental small-scale flower patches increase species density but not abundance of small urban bees', Journal of Applied Ecology 55(4), 1759-1768, https://doi.org/10.1111/1365-2664.13085. [ Links ]
Statistics South Africa, 2011, Census 2011 Community Profiles Dataset, Datafirst. [ Links ]
Steiner, K.E., 1998, 'Beetle pollination of peacock moraeas (Iridaceae) in South Africa', Plant Systematics and Evolution 209(1-2), 47-65, https://doi.org/10.1007/BF00991523. [ Links ]
Stenchly, K., Lippmann, S., Waongo, A., Nyarko, G. & Buerk-ert, A., 2017, 'Weed species structural and functional composition of okra fields and field periphery under different management intensities along the rural-urban gradient of two West African cities', Agriculture, Ecosystems & Environment 237, 213-223, https://doi.org/10.1016/j.agee.2016.12.028. [ Links ]
Theodorou, P, Albig, K., RadzeviciOte, R., Settele, J., Schweiger, O., Murray, T.E. & Paxton, R.J., 2017, 'The structure of flower visitor networks in relation to pollination across an agricultural to urban gradient', Functional Ecology 31(4), 838-847, https://doi.org/10.1111/1365-2435.12803. [ Links ]
Theodorou, P, Herbst, S.-C., Kahnt, B., Landaverde-González, P, Baltz, L.M., Osterman, J. & Paxton, R.J., 2020a, 'Urban fragmentation leads to lower floral diversity, with knock-on impacts on bee biodiversity', Scientific Reports 10(1), 21756, https://doi.org/10.1038/s41598-020-78736-x. [ Links ]
Theodorou, P, Radzeviciote, R., Lentendu, G., Kahnt, B., Husemann, M., Bleidorn, C., Settele, J., Schweiger, O., Grosse, I., Wubet, T., Murray, T.E. & Paxton, R.J., 2020b, 'Urban areas as hotspots for bees and pollination but not a panacea for all insects', Nature Communications 11(1), 576, https://doi.org/10.1038/s41467-020-14496-6. [ Links ]
Turok, I., 2011, 'Deconstructing density: strategic dilemmas confronting the post-apartheid city', Cities 28(5), 470477, https://doi.org/10.1016/j.cities.2010.10.003. [ Links ]
United Nations, Department of Economic and Social Affairs, 2018, World Urbanization Prospects: The 2018 Revision, Online Edition, https://esa.un.org/unpd/wup/Publications. [ Links ]
Venter, Z.S., Shackleton, C.M., Van Staden, F., Selomane, O. & Masterson, V.A., 2020, 'Green Apartheid: urban green infrastructure remains unequally distributed across income and race geographies in South Africa', Landscape and Urban Planning 203, 103889, https://doi.org/10.1016/j.landurbplan.2020.103889. [ Links ]
Vrdoljak, S.M. & Samways, M.J., 2012, 'Optimising coloured pan traps to survey flower visiting insects', Journal of Insect Conservation 16(3), 345-354, https://doi.org/10.1007/s10841-011-9420-9. [ Links ]
Wenzel, A., Grass, I., Belavadi, V.V. & Tscharntke, T., 2020, 'How urbanization is driving pollinator diversity and pollination - a systematic review', Biological Conservation 241, 108321, https://doi.org/10.1016/j.biocon.2019.108321. [ Links ]
Western Cape Government, 2020, Socio-economic profile: City of Cape Town Municipality, web-document: https://www.westerncape.gov.za/provincial-treasury/socio-economic-profiles-2020. [ Links ]
Wilkinson, P, 2000, 'City profile: Cape Town', Cities 17(3), 195-205, https://doi.org/10.1016/S0264-2751(99)00059-1. [ Links ]
World Bank, 2014, 'Poverty and inequality platform: Gini index, South Africa, web-database: https://data.worldbank.org/indicator/SI.POV.GINI?locations=ZA. [ Links ]
Wu, J., Xiang, W.-N. & Zhao, J., 2014, 'Urban ecology in China: historical developments and future directions', Landscape and Urban Planning 125, 222-233. [ Links ]
 Correspondence:
Peta Brom
E-mail: brompeta@gmail.com
Submitted: 21 November 2021
Accepted: 4 January 2023
Published: 11 July 2023
Supplementary Data
The supplementary data is available in pdf: [Supplementary data]

