


Services on Demand
Article
 English (pdf)
 Article in xml format
 Article references
Indicators

Related links
-
 Cited by Google
 -
 Similars in Google
Share

 Permalink
Bothalia - African Biodiversity & Conservation
On-line version ISSN 2311-9284
Print version ISSN 0006-8241
Bothalia (Online) vol.51 n.1 Pretoria 2021
http://dx.doi.org/10.38201/btha.abc.v51.i1.6
ORIGINAL RESEARCH
Impact of land-use and flow conditions on the phytoplankton of the Sabie River, South Africa
Sandra Barnard; Theunis L. Morgenthal; Michaela Stolz; Arthurita Venter
Unit for Environmental Sciences and Management, North-West University, Private Bag X6001, Potchefstroom, 2520, North West Province, Republic of South Africa
ABSTRACT
BACKGROUND: The understanding of the impact of land-use on the dynamics of phytoplankton assemblages during varying climate conditions on rivers is limited.
OBJECTIVE: To determine the impact of land-use types and flow on phytoplank-ton assemblages in the Sabie River.
METHODS: The relationships between land-use patterns, water quality and phy-toplankton assemblages were analysed using canonical correspondence analyses (CCA).
RESULTS: Six main land-use types could be distinguished in the eight identified sub-catchments of the river. The CCA results showed that the land-use had a stronger correlation with phytoplankton classes during the higher flow conditions than during low flow conditions. The forestry land-use type had the strongest correlation with nitrate-nitrite concentrations in the Sabie River. Chlorophyll-a concentrations were higher during 2016, and a slightly lower number of genera were observed for the class Chlorophyceae. During 2017 the number of genera of the class Cyanophyceae decreased together with chlorophyll-a and total cell concentrations.
CONCLUSION: Low flow conditions favoured filamentous genera that are common to mesotrophic conditions while higher flow conditions favoured single-celled small genera more common to oligotrophic waters with higher disturbance. This study showed that flow has the potential to enhance the impact of land-use on phytoplankton community dynamics in a river system and thereby may have further impacts on the health and activities of surrounding communities.
Keywords: river, water quality, cyanobacteria, drought, phytoplankton biomass.
Introduction
Climate and land-use are two emerging factors (since 2006) that impact on and threaten freshwater biodiversity and aquatic ecosystem health (Hayes et al. 2015; Abirhire et al. 2016; Xizhi et al. 2017; Reid et al. 2019). Many studies have shown that land-use changes and pressure can significantly affect the water quality of rivers, lakes and reservoirs (Kändler et al. 201 7; Vrebos et al. 2017; Shi et al. 2017). Agriculture and urbanisation can increase the transport of nutrients into water bodies via run-off (Xu & Zhang 2016; Shi et al. 2017), and therefore also influence phytoplankton abundance and composition (Kat-siapi et al. 2012). The effect of climate is more difficult to quantify since precipitation and temperature affect the flow of water, whilst nutrient loading is known to alter phytoplankton assemblage, diversity and biomass (Michalak 2016; Bussi et al. 2016). Poor water quality and higher temperatures are often associated with high cyanobacterial biomass (Abirhire et al. 2016; Bussi et al. 2016), while the Chrysophyceae, Dinophyceae and Bacillariophyceae are often associated with lower nutrient levels (Katsiapi et al. 2012). The biodiversity and biomass of the Chrysophyceae are known to decrease as the Cyanophyceae cell concentrations increase (Katsiapi et al. 2012). Organic enrichment in rivers is known to favour Euglenophyceae (Katsiapi et al. 2012).
Despite the fact that freshwater ecosystems are hotspots for biodiversity endangerment (Reid et al. 2019), there still is a bias towards conserving terrestrial biodiversity (Cantonati et al. 2020). Freshwater biodiversity is particularly vulnerable as it is also a vital resource for humans (Cantonati et al. 2020). The use of freshwater ecosystem services will inevitably have a negative effect on water quality (Cantonati et al. 2020). Any change in the physical condition and nutrient inputs, which affect the dynamics of a phytoplankton community, can have far-reaching effects on the health and activities of those surrounding human communities due to nuisance bloom forming species (Winder & Sommer 2012).
The water quality of the Sabie River is regarded as relatively good when compared to other rivers in the Limpopo Province such as the Olifants and Crocodile rivers (Griffin, Palmer & Sherman 2014; Shikwambana et al. 2021). The water of the Sabie River system is very important to both the society and the regional economy, which relies heavily on agriculture and ecotourism (Tlou 2011; Roux et al. 2017). Commercial forestry plantations, commercial agricultural lands and urbanisation are having an increasing impact on the water demands in the catchment (Roux et al. 2017). This has the potential to negatively impact not only on the aquatic and riparian zones, but also on ecotourism in the conservation land-use areas. According to Roux et al. 2017, as well as field observations made during this study, pollutants enter the Sabie River and its tributaries through stormwater run-off drains and dumping of domestic waste in the rivers and riparian zones. Dysfunctional wastewater treatment works further contribute to a decline in water quality (Barnard et al. 2019). Rural and now peri-urbanising communities in the Bush-buckridge area greatly increased in extent due to rural migration and immigrants from neighbouring countries (Pollard & Walker 2000; Tlou 2011).
The water demands for this area are expected to increase, with a concomitant and magnifying impact on the water quality of the Sabie River's tributaries, such as the Marite, and the Sand, and ultimately impact on the Sabie River. Moreover, this is expected to impact on phytoplankton diversity and biomass. Monitoring the impact of anthropogenic disturbances on freshwater quality is essential to indicate the viability of the water source for the provision of various ecosystem services (Katsiapi et al. 2012). This has particular relevance during changing climatic conditions such as the drought experienced in the Sabie-Sand catchment during 2016 (Smit 2017) and the impacts of immediate postdrought periods of higher precipitation in 2017.
The aim of this study was two-fold, to investigate: (i) the impact of the current land-use (forestry, agriculture/settlements and conservation) on phytoplankton assemblages of the Sabie River during low flow conditions of a drought; and (ii) whether higher flow conditions immediately after the drought altered the impact of land-use and land cover. To meet these aims the first objective was to determine the land-use and land cover of the study area. The second objective was to determine the nutrient levels that support phytoplankton growth, and the third objective was to determine the change in phytoplankton assemblages in the Sabie River during low flow conditions followed by high flow conditions.
Materials and Methods
Study area
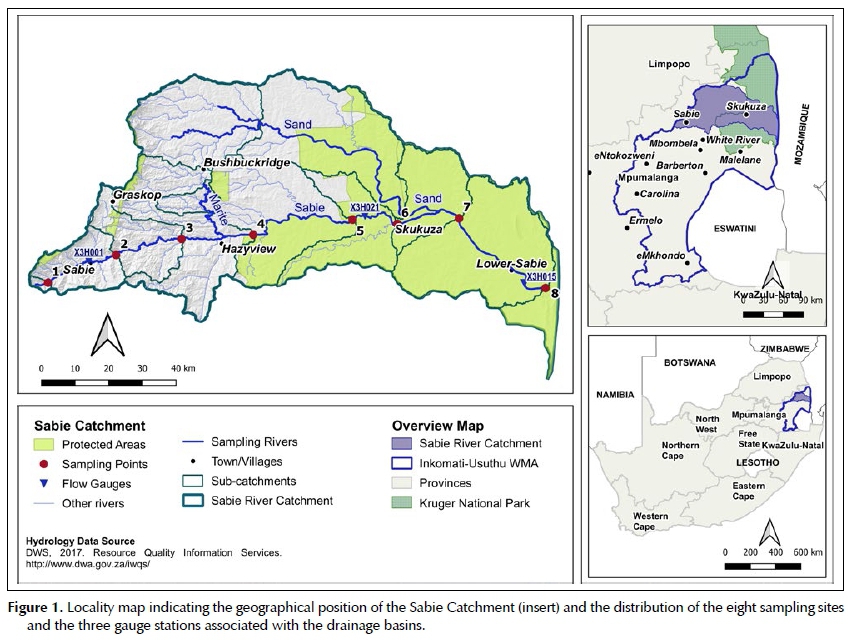
The Sabie-Sand Catchment is one of three sub-catchments that fall under the Inkomati-Usuthu Water Management Area (IUWMA). As seen in Figure 1, the Sa-bie-Sand Catchment lies in the north of the IUWMA, and the Kruger National Park (KNP) is situated to the east where the Sand River joins the Sabie River as one of its main tributaries (Pollard & Du Toit 2011). The Sabie River flows through three distinct land-use zones, namely: (i) a forestry-dominated mountainous area to the west; (ii) a hilly and undulating landscape dominated by dense settlements and smallholder farming; and (iii) a large conservation area including the KNP and the Sabie-Sands Game Reserve in the east. The Sabie River in Mozambique decants into Corumana Dam before finally entering the Incomati River near the town of Moamba in Southern Mozambique (Pollard & Du Toit 2011).
According to the vegetation classification by Mucina and Rutherford (2006), the upper Sabie Catchment is part of the Mesic Highveld Grassland Bioregion and the lower catchment, below Sabie, forms part of the Lowveld Bioregion. Each bioregion constitutes a number of more detailed vegetation types as described by Mucina and Rutherford (2006). Whereas the upper catchment is grassland, the lower catchment is savanna with a prominent woody layer and grass-dominated herbaceous layer. The average annual rainfall decreases along the topographical gradient from the mountainous areas in the west through the foothills and towards the lower, flatter reaches of the Sabie River in the east. Rainfall ranges from 900 to 1 500 mm/a in the west and 348-600 mm/a in the east of the catchment. Eight sampling locations were chosen in collaboration with the Incomati-Usuthu Catchment Management Agency (IUCMA) (Figure 1). These eight sampling sites were at the same localities where IUCMA sample from in order to make data sharing possible.
Sample collection and analyses
Sampling of chemical and physical variables occurred on eight separate occasions, during January, April, July and October of 2016 and 2017. During each sampling occasion, a nine litre grab sample of surface water was taken at each sampling site. The physical-chemical parameters were determined in situ, using a YSI 556 handheld field multi-meter, that included: barometric pressure (mmHg); electrical conductivity (uS/cm); percentage dissolved oxygen (%DO); pH; and water temperature (°C). The multi-meter was calibrated by Rand Water Analytical Services before each sampling trip according to the manufacturer's prescribed protocol.
All chemical, microbiological and hydro-biological analyses were carried out by Rand Water Analytical Services. The standard methods of the American Public Health Association (APHA) (2013) were used, and the laboratory is accredited according to the South African National Accreditation System (SANAS) that is affiliated to the International Laboratory Accreditation Cooperation (ILAC). Due to the method of detection used and the reporting limit set by Rand Water, it was decided to report the concentration of total phosphates. The reporting limit for ammonia at Rand Water is <0.05 mg/l and values reported here for ammonia (NH3) are derived from the measured ammonium (NH4+). Dissolved inorganic nitrogen is calculated as the sum of the concentrations of NH3 + NO3- + NO2-.
Samples for phytoplankton identification and enumeration (250 ml) were preserved on-site with formaldehyde (2%). Planktonic phytoplankton cell identification and enumeration were done at the North-West University using the sedimentation technique according to Swanepoel et al. (2008).
Flow data for the study area were obtained from the IUCMA as a daily average flow rate in cubic metres per second from the following gauge stations with their respective Department of Water and Sanitation codes: Sabie (X3H001), downstream of Site 1, Kruger Gate (X3H021), close to Skukuza town between sites 5 and 6, and Lower Sabie (X3H015), between sites 7 and 8 (Figure 1).
Spatial analysis
Drainage basins were derived for each sampling point based on the 30 m Shuttle Radar Topography Mission (SRTM) digital terrain model (NASA JPL, 2013) as input using the drainage tool as part of ESRI Spatial Analyst extension (ESRI, 2019). Land-use data were derived using the 72 class 2014 Land Cover data (GEOTERRA IMAGE, 2015) in combination with the 2016 protected area data provided by the Department of Environment Affairs (DEA 2016). The 72 class 2014 land cover datasets were reclassified into five broad land cover classes (water, natural vegetation, cultivation, plantations, urban and mines). The natural vegetation class were thereafter split into grazing and conservation land-uses based on the DEA protected area layer. Using an R script, the frequency distribution of land-use classes was estimated for each drainage basin areas using the Raster and SF packages. The percentage distribution of each class was used as input to the Canonical Correspondence Analysis (CCA).
Statistical analysis
The water quality dataset consisted of biological, chemical and physical parameters. Results that were below the reporting limit were assigned a value of half the reporting value in order to be included in the statistical data sets. Missing data were treated as gaps, and 0 was used where the variable was measured as zero. All statistical analyses were carried out using Statistica v13, Dell Inc. (2016). Initially, the Kolmogorov-Smirn-ov and Lilliefors tests for normality were conducted to determine if the data were distributed parametrically. The data did not meet the assumptions of normality in the distribution of all variables and thus non-parametric statistics were applied. Kruskal-Wallis analysis (comparison of multiple groups) was used to compare multiple independent groups, along with Spearman's rank correlation coefficient. Data that were below the limit of detection were substituted with half the value of the detection limit provided that it came to no more than 50% of the data. If 100% of the data were below the detection limit it was specified.
Canonical Correspondence Analysis (CCA) was performed using Canoco v4.5 (Ter Braak & Smilauer 2002). The CCA was used to determine if land-use/cover and water quality had a statistically significant relationship with phytoplankton assemblages of the Sabie River. It was conducted for both 2016 and 2017. Log transformation of the datasets, that is, log(y+1) was applied. A Monte Carlo permutation test (499 permutations) was used to determine the statistical validity of the CCAs.
Results
Hydrological flow conditions
The hydrograph (Figure 2) shows that average daily flows during 2016 were significantly (p <0.05) lower than during 2017, especially at the lower Sabie gauge (close to Site 7). Although high flows were experienced during the rainfall season of both years at the Kruger Gate gauge station, average flows were higher and more consistent at all three gauge stations throughout 2017.
Land-use
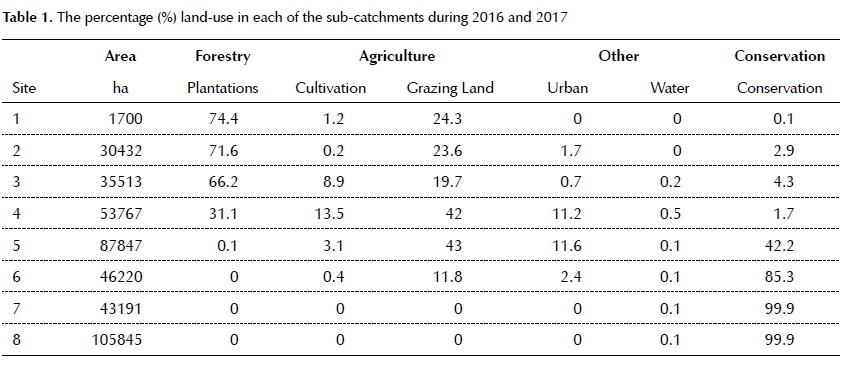
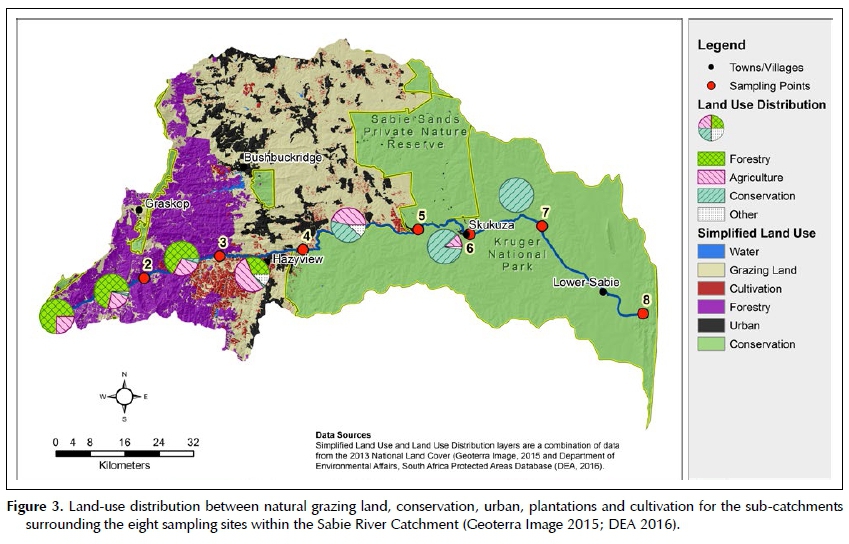
Six main land-use types could be distinguished in the eight identified sub-catchments of the river. The distribution of land-use and land cover can be seen in Table 1 and Figure 3.
Sub-catchments 1 and 3 are dominantly used for plantation forestry. Land-use of sub-catchments 4 and 5 is a combination of grazing land, plantation forestry, cultivation and rural settlements classified as urban. Sub-catchment 6 is predominantly natural vegetation under conservation as well as a small percentage of natural vegetation used as grazing land. The sub-catchments associated with sampling sites 7 and 8 are located within the KNP and therefore a natural landscape.
Plantation forestry is predominantly eucalyptus and pine, whilst intensive, irrigated sub-tropical fruit and nut orchards exist in the western cultivated area. Dryland grain and winter irrigated vegetable production is typical of the eastern region adjacent to the conservation areas. The grazing land is mostly used for subsistence and communal livestock production.
Spatial and temporal changes in nutrient and chlorophyll concentrations
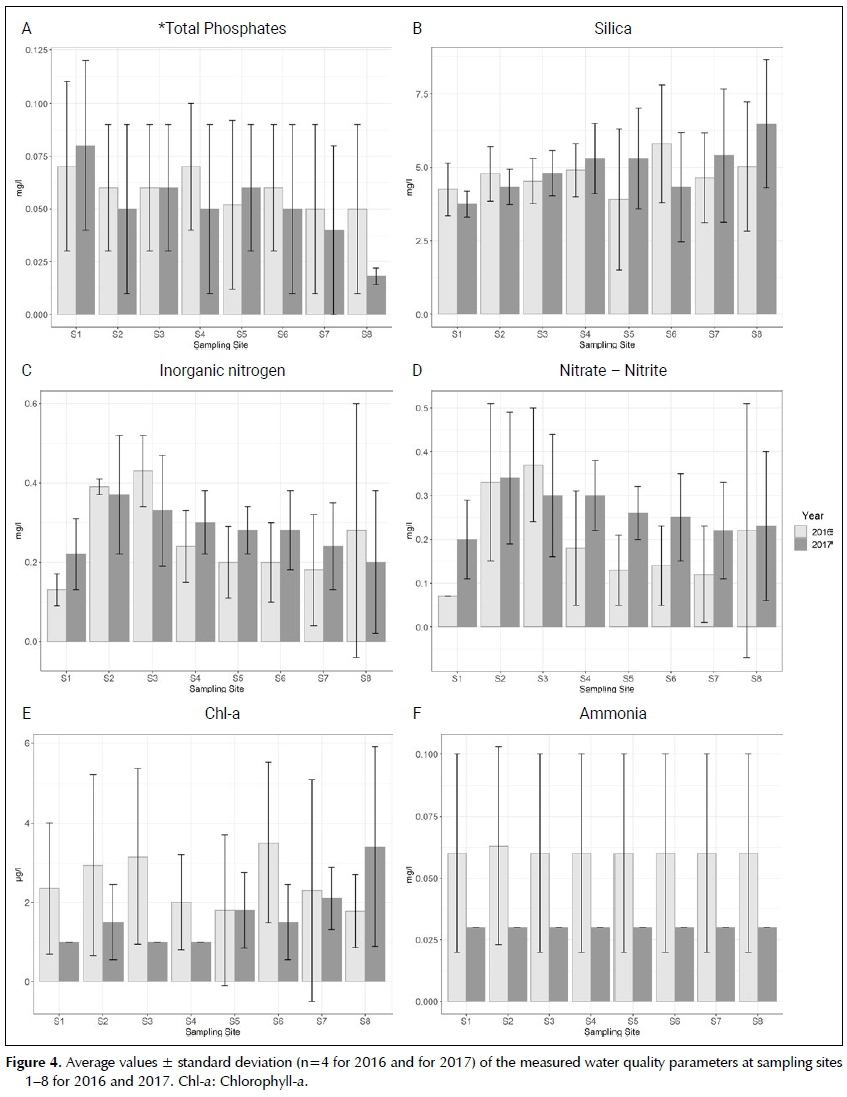
Figure 4 presents the average values ± the standard deviation of chlorophyll-a (chl-a) and that of the main nutrient concentrations that can impact on phytoplank-ton assemblages. The total phosphate concentrations decreased at most of the sites during 2017, except at sites 1, 3 and 5 where it increased. The concentrations of silica increased during 2017, except at sites 1, 2 and 6. Silica concentrations appear to increase downstream as well during 2017 (Figure 4b). All concentrations determined for ammonia, during 2017, were below the reporting limit. The average concentration of dissolved inorganic nitrogen measured at all the sites during 2017 was <0.5 mg/l, which is indicative of oligotrophic conditions (DWAF 1996). This is also supported by the range of chlorophyll-a concentrations determined at all of the sites, which was consistently <10 ug/l. Sites 2 and 3 were the only sampling locations that showed a maximum concentration for inorganic nitrogen of >0.5 mg/l. The average inorganic nitrogen concentrations, however, increased during 2017 at most sites (except sites 2, 3 and 8), and this was mostly due to the increase in nitrite and nitrate during 2017 (Figure 4d), except at Site 3 where it decreased. Chlorophyll-a concentrations decreased at sites 1-4, and sites 6 and 7, while sites 5 and 8 experienced an increase in chl-a concentrations during 2017.
Phytoplankton biodiversity and abundances
Table 2 lists the six phytoplankton classes that were identified during both sampling years. The Bacillario-phyceae were the most diverse group in 2016, with 20 genera followed by the Chlorophyceae with 15 genera. Thirteen Cyanophyceae genera were identified as well as one genus from each of the Euglenophyceae, Dino-phyceae and Chrysophyceae, resulting in a total of 51 genera. During 2017 only the Cyanophyceae showed a decrease in biodiversity. The phytoplankton diversity was similar in 2017 with the identification of 20 genera from the Bacillariophyceae, 19 genera from the
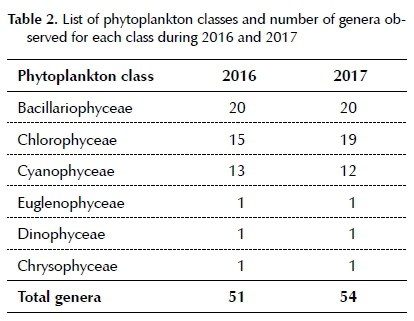
Chlorophyceae, 12 genera from the Cyanophyceae, and one genus each from the Euglenophyceae, Dino-phyceae and Chrysophyceae, resulting in a total of 54 genera. Sites 7 and 8 exhibited the greatest diversity of genera for all the classes.
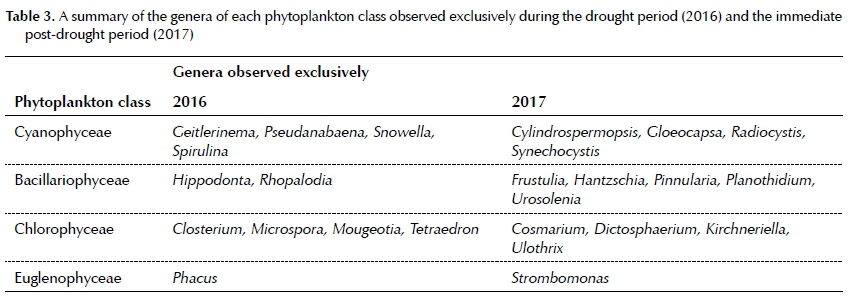
From the headwaters (Site 1) phytoplankton diversity increased downstream in the Sabie River to Site 8 during both the drought period (2016) and the immediate post-drought period (2017), while the total number of genera observed increased during 2017 (Table 2). Several genera were observed exclusively during the drought period, while others were observed only during the immediate post-drought period. These genera are listed in Table 3.
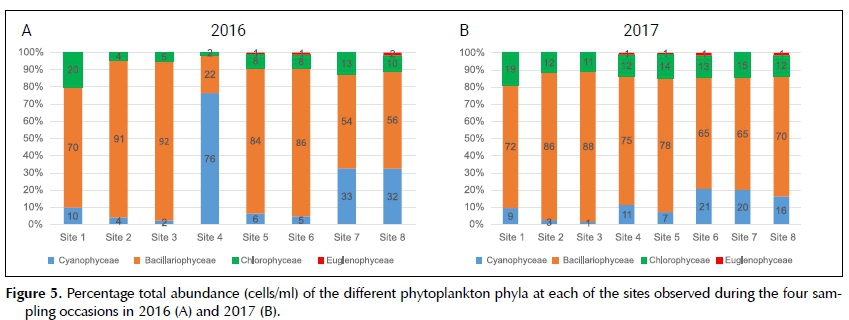
However, the total cell concentration of phytoplankton cells (cells/ml) in the catchment were higher in 2016 (2 090 cells/ml) than in 2017 (1 147 cells/ml). The most abundant class observed in the Sabie River was the Bacillariophyceae, and this was the dominant class in 2016 (Figure 5A) at all the sampling sites except Site 4, where the Cyanophyceae was the most abundant class. The most abundant class during 2017 (Figure 5B) was again the Bacillariophyceae, followed by the Chloro-phyceae except at sites 6, 7 and 8 where the Cyano-phyceae was the second most abundant class.
Impact of land-use on phytoplankton assemblages
The water quality of a water body can potentially be a reflection of the impact of the land-uses within the catchment as it receives precipitation and water flows though the landscape. Each sampling site also has a sub-catchment that can add to the influence of the antecedent water quality from upstream, which will impact phytoplankton biomass and composition.
To determine the impact of land-use on the phytoplankton assemblages of the Sabie River a CCA was conducted for both 2016 and 2017 (Figure 6A,B). This shows sites, which was consistently <10 ug/l. Sites 2 and 3 were the only sampling locations that showed a maximum concentration for inorganic nitrogen of >0.5 mg/l. The average inorganic nitrogen concentrations, however, increased during 2017 at most sites (except sites 2, 3 and 8), and this was mostly due to the increase in nitrite and nitrate during 2017 (Figure 4d), except at Site 3 where it decreased. Chlorophyll-a concentrations decreased at sites 1-4, and sites 6 and 7, while sites 5 and 8 experienced an increase in chl-a concentrations during 2017.
that land-use had a statistically strong relationship with the phytoplankton assemblages in 2017 during immediate post-drought conditions, a year characterised by flash floods and high run-off in the study area (Figure 2). The first axis of the CCA explains 68.6% of the variance in the species-land-use relationship observed in 2016 (p = 0.668) whereas this increased to 94.7% during 2017 (p = 0.144). During 2017 forestry had the greatest influence on the data compared to conservation land-use type during 2016.
During both 2016 and 2017, the conservation and forestry land-use types could explain most of the variance in phytoplankton abundance. During 2016 sites 1-3, located in the forestry and agriculture land-use types, closely associated with higher ammonia, nitrate-nitrite and total phosphate concentrations together with the Bacillariophyceae and Chlorophyceae, and higher chlo-rophyll-a concentrations. Site 4 associated closely with the land-use type agriculture, total phosphates and the class Cyanophyceae, while the class Chrysophyceae associated closely with the land-use type 'other'. The low concentration of Dinophyceae and Euglenophycea, and to a lesser extent the Chlorophyceae cells, associated strongly with the conservation land-use type. During 2017 sites 1-3 were closely associated with higher nutrient concentrations. A strong association between the Chrysophyceae and Site 3 was observed during 2017. Site 4 still associated with the land-use type agriculture and total phosphates, while Site 5 and the land-use type 'other' no longer associated with a particular phyto-plankton class. Sites 7 and 8, in the conservation land-use type, associated closely with the class Cyanophyceae and Euglenophyceae, but no longer the Dinophyceae. The location of the Bacillariophyceae and Chlorophyce-ae so close to the origin of the axes of the ordination may indicate their ubiquitous distribution at all of the sites.
Discussion
The health of human societies and the ecosystems surrounding them is dependent on the quality and availability of freshwater. Unfortunately, human and land-use activities have exploited this resource heavily, and as a result, freshwater ecosystems are under threat (Cabecinha et al. 2016). Besides the impact of anthropogenic stressors, climate change has also been shown to threaten freshwater biodiversity and aquatic ecosystem health (Hayes et al. 2015; Abirhire et al. 2016; Xizhi et al. 2017; Reid et al. 2019). Results presented during this study have shown that both land-use and hydrological flow, can influence nutrient concentrations and abundance and dynamics of phytoplankton assemblages in the Sabie River.
Land-use affects water quality in two ways, one by the input of nutrients into the source water due to various activities and two by changing the land surface and therefore the surface run-off and input of nutrients and other elements such as heavy metals (Hayes et al. 2015; Xizhi et al. 2017). During 2017 river flow was persistently higher than 2016 even during the dry seasons. It has been reported that water quality has a stronger relationship with land-use during high flow than during low flow conditions (Shi et al. 2017), indicating that land-use has a greater influence on water quality during periods of high flow. This was also true during this study as was illustrated by the CCA (Figure 6B). During this study commercial agricultural areas and forestry land-use types could be associated with higher inorganic nitrogen concentrations in the Sabie River both 2016 and 2017 (Figure 6A,B). This was also found in other studies that showed during that high concentrations of nitritenitrate, ammonia and total phosphates in stream water could be linked to the use of fertilisers in agriculture (Shi et al. 2017; Xizhi et al. 2017).
The positive association of urban areas and inorganic nitrogen can be related to urban run-off and wastewa-ter treatment plants (Namugize et al. 2018) such as that situated close to the river at Site 2. The average total phosphate concentration, however, decreased from 2016 to 2017 except at sites 1, 3 and 5, where it increased, probably due to agricultural activities and the use of fertilisers. Increases in both nitrite-nitrate and silica concentrations were observed at most sites during 2017. This can probably be ascribed to nutrients leaching from the soils during higher run-off. The overall decrease in ammonia concentrations observed during 2017 was most probably due to the flushing of effluent sources that caused the level of ammonia to increase during low flow/drier conditions. Chlorophyll-a (bio-mass) also decreased from 2016 to 2017 at most sites. This decrease can be the result of dilution due to higher flow, however other studies have also noted a decrease in biomass after periods of high precipitation (Stockwell et al. 2020). Chlorophyll-a concentration is a very clear indicator of nutrient changes and a responsive indicator of N and P concentrations and ratios (Gökge 2016).
Water quality measurements only provide us with a snapshot of what the water quality is at the time of the measurement. On the other hand, phytoplankton abundance, dominance and community structure can more accurately reflect the water quality and impacts thereupon (Gökge 2016). In the present study the most abundant group of algae in rivers was the Bacillariophyceae (Wher et al. 2015). The genera observed from this group are cosmopolitan and thrive in low flowing, alkaline waters of moderate salinity and low to moderate organic pollution. These are all typical characteristics observed in the Sabie River (Barnard et al. 2019). The group
Bacillariophyceae or diatoms forms the base of the food chain in most aquatic ecosystems, and they have the ability to respond quickly to changing environmental conditions. The higher flows also cause unfavourable conditions for cyanobacterial growth, which prefer relatively stagnant waters and are thus not prone to develop to bloom conditions in relatively fast-flowing streams as was the case at most of the sampling sites. During the low flow conditions of 2016 Cyanophyceae dominance and high cell concentrations were associated with Site 4 located in the land-use type agriculture and closely associated with higher concentrations of total phosphates. A change in dominance from Cyanophyceae to Bacillar-iophyceae at Site 4 was observed in 2017. Cyanophy-ceae were then second-most dominant class at sites 6, 7 and 8 in 2017. The reason for this shift in dominance of this class at Site 6 is not clear from the results. These sites are, however, downstream from areas more impacted on by agriculture and peri-urban settlements and nutrients and organic waste could have been transported to collect in the lower reaches of the river.
Bussi et al. (2016) found in their study that the class Cyanophyceae was the most sensitive to climatic variations and these variations can impact directly on to the physiological characteristics of phytoplankton (Winder & Sommer 2012). Shifts like this can have far-reaching effects on the ecosystem (Winder & Sommer 2012) as well as on the land-use activities associated with these sites, namely conservation. It was reported that wildlife mortality due to cyanobacterial blooms is increasing in the KNP (Bengis et al. 2016). The Chrysophyceae and Dinophyceae were associated with land-use types that included urban settlements during 2016. According to Katsiapi et al. (2012), Chrysophyceae is closely associated with forested areas. This was only the case in our study during the immediate post-drought conditions of 2017. As was found by other studies (Wher et al. 2015; Katsiapi et al. 2012), the Eu-glenophyceae were more closely associated with urban areas during 2016, but this changed during 2017 when this class was closely associated with sites (7 and 8) in the conservation land-use class.
Some genera were observed exclusively during the low flow conditions while others were exclusively observed during high flow conditions. A number of studies have found that morphological, physiological, behavioural and life-history traits of phytoplankton taxa strongly correlate with the gradients of anthropogenic stressors noted in both the catchment and the hydrological section of a river (Lange et al. 2015; Machado et al. 2016; Gökge 2016). Thus anthropogenic factors can possibly explain the appearance of these genera. Genera that exclusively occurred during 2016 included those that are mostly filamentous (Geitlerinema, Spirulina, Microspora and Mougeotia). Other taxa encountered were more common in mesotrophic to eutrophic water (Pseudanabaena and Snowella) and some typical of waters with elevated levels of pollutants (Phacus and Closterium) and their occurrence is thus indicative of the prevailing conditions in the Sabie River (Reynolds & Descy 1996; Wher et al. 2015). Closterium species are even capable of surviving extended periods of drying (Wher et al. 2015). Genera that exclusively occurred during 2017 represented taxa that were mostly single-celled and small (pico-plankton such as Gloeocapsa and Synechocystis), more common to oligotrophic and poor nutrient waters with lower pH (Frustulia, Hantzschia and Pinnularia) with higher resilience in greater disturbance and higher flow conditions (Ulothrix, Urosolenia) and higher pollutant levels (Cos-marium, Strombomonas) (Reynolds & Descy 1996; Taylor et al. 2007; Wher et al. 2015).
During the high flow conditions of 2017, increases in acidity and a decrease in M alkalinity were observed in the Sabie River (Barnard et al. 2019) together with a decrease in total phosphates and ammonia. This could explain the exclusive appearance of certain diatom genera during 2017. In their study Lange et al. (2015) also found that higher nutrient concentration in waters impacted on by agriculture hosted phytoplankton dominated by large, non-attached, filamentous taxa after several weeks of low-flow conditions. They found that smaller cell size, nitrogen-fixing taxa with higher dispersal abilities were able to recover faster after disturbance due to their higher growth rates and resilience (Lange et al. 2015). Although filamentous, Cylindrospermopsis can fix nitrogen and was only found during 2017 when nutrients were lower.
Conclusion
With this study, we had a rare opportunity to study the influence of land-use on phytoplankton composition during a drought and the immediate post-drought period that followed. This study showed that changes in phytoplankton communities can reflect the land-use types in the catchment and that land-use impacts can be enhanced during higher flow conditions. Land-use and climate affected the nutrient concentrations in the river water and phytoplankton diversity responded rapidly to these changes. This environmental variability influenced the distribution of phytoplankton genera. Non-attached filamentous phytoplankton genera with limited dispersal abilities were mostly found during low flow rates with mesotrophic to eutrophic conditions, while small and nitrogen-fixing genera that can withstand high dispersal were observed mostly during high flow rate with oligotrophic conditions.
The results of this study are important if we want to predict the impacts of climate change on aquatic ecosystems. This study showed that an increase in phyto-plankton concentration, especially that of the nuisance Cyanophyceae, is likely to occur during periods of low flows, and increased phosphate concentrations in agricultural and urban areas, but during high flow conditions, Cyanophyceae dominance can be displaced to downstream areas in lower river reaches. It is in the surrounding communities' interest to conserve the ecological functionality and the biological complexity of this freshwater ecosystem to safeguard water quality for domestic use and the health of domestic and wild animals, thus ensuring the economic well-being of the society depending on it.
Acknowledgements
The authors would like to acknowledge the Water Research Commission for financial support (Project K5/2755) for this research. The authors would like to thank Rand Water for the analyses, SANParks for their collaboration, and IUCMA for their valuable collaboration and data sharing. Thank you to Mrs Anrie Bishoff for phytoplankton identification and enumeration.
Authors' contributions
SB was the project leader, responsible for experimental and project design and main author. TM helped with the land-use analyses and was responsible for drawing all the maps and wrote parts of the manuscript. MS was responsible for land-use analyses. AV was responsible for phytoplankton data capturing and wrote parts of the manuscript.
References
Abirhire, O., North, R.L., Hunter, K., Van der Gucht, D. & Hudson, J., 2016, 'Do human activities affect phytoplankton biomass and composition in embayments on Lake Diefenbaker?', Journal of Freshwater Ecology 31(4), 597608, https://doi.org/10.1080/02705060.2016.1205526 [ Links ]
Barnard, S., Morgenthal, T.L., Stolz, M., Venter, A. & Erasmus, A., 2019, Water quality and algal assemblages of the Sabie River and tributaries, including the Inyaka Dam, in relation to land-use practices, WRC Report No. 2755/1/19, Water Research Commission, Pretoria, South Africa. [ Links ]
Bengis, R., Govender, D., Lane, E., Myburgh, J., Oberholster, P. & Buss, P., 2016, 'Eco-epidemiological and pathological features of wildlife mortality events related to cyanobac-terial bio-intoxication in the Kruger National Park, South Africa', Journal of the South African Veterinary Association 87(1), 1391-1395. [ Links ]
Bussi, G., Whitehead, P.G., Bowes, M.J., Read, D.S., Prud-homme, C. & Dadson, S.J., 2016, 'Impacts of climate change, land-use change and phosphorus reduction on phytoplankton in the River Thames (UK)', Science of the Total Environment 572, 1507-1519, https://dx.doi.org/10.1016/j.scitotenv.2016.02.109. [ Links ]
Cabecinha, E., Van den Brink, P.J., Cabral, J. A., Cortes, R., Lourengo, M., & Pardal, M. A., 2009, 'Ecological relationships between phytoplankton communities and different spatial scales in European reservoirs: implications at catchment level monitoring programmes', Hydrobiologia 628, 27-45, https://dx.doi.org/0.1007/s10750-009-9731-y [ Links ]
Cantonati, M., Poikane, S., Pringle, C.M., Stevens, L.E., Turak, E., Heino, J., Richardson, J.S., Bolpagni, R., Borrini, A., Cid, N., Ctvrtlíková, M., Galassi, D.M.P, Hájek, M., Hawes, I., Levkov, Z., Naselli-Flores, L., Saber, A.A., Cicco, M.D., Fiasca, B., Hamilton, PB., Kubecka, J., Segadelli, S. & Znachor, P., 2020, 'Characteristics, main impacts, and stewardship of natural and artificial freshwater environments: Consequences for biodiversity conservation', Water 12(260), 1-85, https://dx.doi.org/10.3390/w12010260 [ Links ]
Department of Environmental Affairs (DEA), 2016, South Africa Protected Area Database. Department of Environmental Affairs, Pretoria, South Africa, viewed on 7 July 2020 from https://egis.environment.gov.za/data_egis/data_download/current [ Links ]
Department of Water Affairs and Forestry (DWAF), 1996, South African water quality guidelines: Volume 7: Aquatic ecosystems, 2nd Edition, Department of Water Affairs and Forestry, Pretoria, South Africa. [ Links ]
ESRI 2019, ArcGIS Desktop, ArcMap Release 10.7. Environmental Systems Research Institute. [ Links ]
GeoTerraimage (South Africa). 2015. 2013-2014 South African National Land-Cover Dataset. DEA/CARDNO [ Links ]
SCPF002: Implementation of Land-Use Maps for South Africa. Project Specific Data User Report and MetaData. [ Links ]
Gökge, D. 2016, 'Algae as an Indicator of Water Quality' in Thajuddin N and Dhanasekaran D. (eds.) Algae - Organisms for Imminent Biotechnology, pp. 81-101, Inte-chOpen, https://dx.doi.org/10.5772/62916 [ Links ]
Griffin, N.J., Plamer, C.G., & Sherman, P-A, 2014, Critical analysis of environmental water quality in South Africa: Historic and current trends, WRC Report No. 2184/1/14, Water Research Commission, Pretoria, South Africa. [ Links ]
Hayes, N.M., Vanni, M.J, Horgan, M.J. & Renwick, W.H., 2015, 'Climate and land-use interactively affect lake phy-toplankton nutrient limitation status', Ecology 96(2), 392402. [ Links ]
Kändler, M., Blechinger, K., Seidler, C., Pavlu, V., Sanda, M., Dostál, T., et al., 2017, 'Impact of land-use on water quality in the upper Nisa catchment in the Czech Republic and in Germany', Science of the Total Environment 586, 13161325, http://dx.doi.org/10.1016/j.scitotenv.2016.10.221 [ Links ]
Katsiapi, M., Mazaris, A.D., Charalampous, E. & Mousta-ka-Gouni, M., 2012, 'Watershed land-use types as drivers of freshwater phytoplankton structure', in: Salmaso N., Naselli-Flores L., Cerasino L., Flaim G., Tolotti M., Padisák J. (eds) 'Phytoplankton responses to human impacts at different scales, Developments in Hydrobiology', 221, pp. 121-132, Springer, https://doi.org/10.1007/s10750-012-1095-z. [ Links ]
Lange, K., Townsend, C.R., & Matthaei, C.D., 2015, 'A trait-based framework for stream algal communities', Ecological Evolution 6(1), 23-36, https://doi.org/10.1002/ece3.1822 [ Links ]
Masango, M.G, Myburgh, J.G., Labuschagne, L., Govender, D., Bengis, R.G & Naicker, D., 2010, 'Assessment of Micro-cystis bloom toxicity associated with wildlife mortality in the Kruger National Park, South Africa', Journal of Wildlife Diseases 46(1), 95-102. [ Links ]
Michalak, A.M., 2016, 'Study role of climate change in extreme threats to water quality', Nature 535, 349-350. [ Links ]
Mucina, L. & Rutherford, M.C., 2006, 'The vegetation of South Africa, Lesotho and Swaziland', Strelitzia 19(3), 31-50. [ Links ]
Namugize, J.N, Jewitt, G. & Graham, M., 2018, 'Effects of land-use and land cover changes on water quality in the uMngeni river catchment, South Africa', Physics and Chemistry of the Earth, Parts A/B/C, https://doi.org/10.1016/j.pce.2018.03.013. [ Links ]
NASA JPL. NASA Shuttle Radar Topography Mission Global 1 arc second. 2013, distributed by NASA EOSDIS Land Processes DAAC, viewed on 27 May 2020, https://doi.org/10.5067/MEaSUREs/SRTM/SRTMGL1.003. [ Links ]
Pollard, S. & Du Toit, D., 2011, The Shared River Initiative Phase I. Towards the sustainability of freshwater systems in South Africa: An exploration of factors that enable or constrain meeting the Ecological Reserve within the context of Integrated Water Resources Management in the catchments of the Lowveld, WRC Report No.TT 477/10, Water Research Commission Pretoria, South Africa. [ Links ]
Pollard, S. & Walker, P., 2000, 'Catchment management, water supply and sanitation in the Sand River Catchment, South Africa: Description and Issues'. WHIRL Project Working Paper 1. UK DFID, Project No. R7804. NRI, Department for International Development, Chatham, United Kingdom. pp.1-18. [ Links ]
Reid, A.J., Carlson, A.K., Creed, I.F., Eliason, E.J., Gell, P.A., Johnson, P.T.J., Kidd, K.A., MacCormack, T.J., Olden, J.D., Ormerod, S.J., Smol, J.P., Taylor, W.W., Tockner, K., Ver-maire, J.C., Dudgeon, D. & Cooke, S.J., 2019, 'Emerging threats and persistent conservation challenges for freshwater biodiversity', Biology Reviews 94, 849-873, https://doi.org/10.1111/brv.12480 [ Links ]
Reynolds, C.S. & Descy, J.P, 1996, 'The production, biomass and structure of phytoplankton in large rivers', Archiv für Hydrobiologie 10, 161-187. [ Links ]
Roux, F., Diedericks, G., Kleynhans, C.J., Thirion, C., Hoffmann, A.C. & Selepe, M., 2017, 'Ecostatus of the Sa-bie-Sand River catchment, Inkomati River system phase II (2016)', Mpumalanga Tourism and Parks Agency, Scientific Services: Aquatic and Herpetology. [ Links ]
Shi, P, Zhang, Y., Li, Y., Li, P & Xua, G., 2017, 'Influence of land-use and land cover patterns on seasonal water quality at multi-spatial scales', Catena 151, 182-190, http://dx.doi.org/10.1016/j.catena.2016.12.017. [ Links ]
Shikwambana, S., Taylor, J.C, Govender, D. & Botha J., 2021, 'Diatom responses to river water quality in the Kruger National Park, South Africa.' Bothalia 51(1): 63-74 (hardcopy); 1-11 (online) [this issue]. [ Links ]
Smit, I., 2017, After the drought: What is the future for Kru-ger's waterholes? Viewed 9 July 2018 from http://www.wildcard.co.za/drought-future-krugers-waterholes [ Links ]
Stockwell, J. D., Doubek, J.P., Adrian, R., Anneville, O., Carey, C.C., Carvalho, L., De Senerpont Domis, L. N., Dur, G., Frassl, M.A., Grossart, H-P., Ibelings, B. W.,Lajeunesse, M. J., Lewandowska, A. M., Llames, .M. E.,Matsuzaki, S., Nodine, E. R., Nöges, P, Patil, V.P, Pomati, F., Rinke, K., Rudstam, L. G., Rusak, J. A., Salmaso, N., Seltmann, C.T., Straile, D., Thackeray, S.J., Thiery, W., Urrutia-Cordero, P, Venail, P., Verburg, P., Woolway, R. I., Zohary, T., Andersen, M. R., Bhattacharya, R., Hejzlar, J., Janatian, N., Kpodonu, A. T. N. K., Williamson, T. J., & Wilson, H. L., 2020, 'Storm impacts on phytoplankton community dynamics in lakes.' Global Change Biology 26(5), 1354-1013, http://dx.doi.org/10.3390/w12010260 [ Links ]
Swanepoel, A., Du Preez, H., Schoeman, C., Janse van Vuuren, S. & Sundram, A., 2008, Condensed laboratory methods for monitoring phytoplankton, including cyano-bacteria, in South African freshwaters, WRC Report No. TT 323/08, Water Research Commission Pretoria, South Africa. [ Links ]
Taylor, J.C., Harding, W.R. & Archibald, C.G.M., 2007, An illustrated guide to some common diatom species from South Africa, WRC Report No. TT 282/07, Water Research Commission, Pretoria, South Africa. [ Links ]
Ter Braak, C.J. & Smilauer, PN., 2002, 'CANOCO Reference Manual and CanoDraw for Windows User's Guide: Software for Canonical Community Ordination (version 4.5) pp. 119. Ithaca, New York. [ Links ]
Tlou, T., 2011, 'Bushbuckridge Local Municipality: First order reconciliation strategy for the Inyaka Regional Water Supply Scheme Area', Department of Water Affairs', Contract: WP, 9712, 2-27. [ Links ]
Vrebos, D., Beauchard, O. & Meire, P, 2017, 'The impact of land-use and spatial mediated processes on the water quality in a river system', Science of the Total Environment, 601602, 365-373, http://dx.doi.org/10.1016/j.scitotenv.2017.05.217 [ Links ]
Wehr, J.D., Sheath, R.G. & Kociolek, J.P, 2015, Freshwater algae of North America: ecology and classification, Second Edition, Elsevier, London. [ Links ]
Winder, M. & Sommer, U., 2012, 'Phytoplankton response to a changing climate', Hydrobiologia 698(1), 5-16. [ Links ]
Xizhi, L., Jing, H., Peiqing, X., Pan, Z. & Jiaoxuehui., 2017, 'Correlation analysis between the water quality and land-use composition in Chaobai River Basin', Nature Environment and Pollution Technology 16(1), 307-314. [ Links ]
Xu, E. & Zhang H., 2016, 'Aggregating land-use quantity and intensity to link water quality in upper catchment of Miyun Reservoir', Ecological Indicators 66, 329-339. [ Links ]
 Correspondence:
Prof. Sandra Barnard,
sandra.barnard@nwu.ac.za
Submitted: 7 October 2019
Accepted: 20 October 2020
Published: 24 February 2021
Supplementary material
The supplementary data is available in pdf: [Supplementary data]

