


Services on Demand
Article
 English (pdf)
 Article in xml format
 Article references
Indicators

Related links
-
 Cited by Google
 -
 Similars in Google
Share

 Permalink
Bothalia - African Biodiversity & Conservation
On-line version ISSN 2311-9284
Print version ISSN 0006-8241
Bothalia (Online) vol.51 n.1 Pretoria 2021
http://dx.doi.org/10.38201/btha.abc.v51.i1.3
ORIGINAL RESEARCH
The influence of land use-impacted tributaries on water quality and phytoplankton in the Mooi River, North West Province, South Africa
Lauralee Koekemoer; Sanet Janse van Vuuren; Anatoliy Levanets
Unit for Environmental Sciences and Management, North-West University, Private Bag X6001, Potchefstroom, 2520, North West Province, Republic of South Africa
ABSTRACT
BACKGROUND: Effluents from agricultural activities, metal and peat mining, urban and industrial areas, informal settlements and wastewater treatment plants all influence tributaries feeding the Mooi River. All these land uses ultimately result in a deterioration of water quality in the Mooi River.
OBJECTIVES: The main objective was to relate the effects of inflowing tributaries to water quality and phytoplankton assemblages in the Mooi River.
METHOD: Physico-chemical environmental variables were compared with water quality objectives and known limits to assess general water quality in the Mooi River over a one-year period. Water quality and phytoplankton in tributaries were compared to that at sites upstream and downstream from their inflows to determine the extent to which the tributaries affected the Mooi River. Multivari-ate analysis assisted in the interpretation of phytoplankton and physico-chemical data at the different sites.
RESULTS: Seven phytoplankton phyla were identified in the Mooi River. Diatoms and green algae were most dense and diverse. Cyanobacteria were responsible for various problems, especially in the Wasgoedspruit where they dominated and reached high densities. Lowest phytoplankton density and diversity were found in the upstream and downstream sections of the river, while maximum density and diversity were found during summer in the middle reaches. The inflow of tributaries, especially the Wasgoedspruit, had a pronounced effect on water quality downstream. Phytoplankton density and diversity were less affected than chemical variables, especially nutrient concentrations.
CONCLUSION: Various land use activities surrounding the Mooi River's tributaries contributed to a deterioration of water quality in the main stream of the Mooi River.
Keywords: algae, anthropogenic activities, cyanobacteria, eutrophication, nutrients, physico-chemical variables, trophic status
Introduction
In the dry North West Province of South Africa rivers and dams are extremely important as surface water sources. The Mooi River and its three major dams (Klerkskraal, Boskop and Potchefstroom dams) are located in the North West Province, and serves as domestic, agricultural and irrigational water resources for the city of Potchefstroom and surrounding areas. The Mooi River forms a tributary of the Vaal River, one of the largest rivers in South Africa. High summer temperatures, low and unevenly distributed rainfall, and high evaporation rates contribute to insufficient water availability at times (Van der Walt, Winde & Nell 2002).
It is generally accepted that the Mooi River, which literally means 'beautiful river', obtained its name from its once beautiful, clear stream of water. However, the Mooi River currently experiences severe land use impacts in its catchment, affecting water quality in terms of pollution. Surface water pollution, as a result of various anthropogenic activities, is common in the catchment of the Mooi River and includes effluents from agricultural, urban, industrial and recreational activities, as well as from informal settlement areas (NWDACE 2008).
Upstream from Potchefstroom, land-use activities include agricultural activities, diamond diggings, and peat mining. During agricultural activities, which include extensive irrigation, pesticides, herbicides and fertilisers are fed into the aquatic environment (Pelser 2015). According to the World Wide Fund for Nature (WWF 2011), an overuse of synthetic fertilisers, pesticides and herbicides will pollute water resources, poison delicate ecosystems and expose farmers and farm workers to toxins. Diamond diggings in areas surrounding the Klerkskraal Dam (Van der Walt et al. 2002), as well as near the confluence of the Mooi and Vaal rivers, destroy floodplains and remove riparian vegetation, thereby reducing habitat integrity and influencing the associated biota (Currie 2001; Van der Walt et al. 2002). Peatland drainage does not contribute to point sources of pollution but influences the quality of receiving waters with respect to increased sedimentation, nutrient limitation, dissolved oxygen, organic carbon and the release of heavy metals, such as mercury, with its subsequent accumulation in fish and other biota (Glooschenko 1990).
Downstream from Potchefstroom, pump stations of the wastewater treatment plant (WWTP) have the potential of overflowing into the Mooi River. The WWTP of Potchefstroom treats sewage and discharges effluents back into the Mooi River, ensuring that it does not pose threats to human health and the ecosystem (Pelser 2015). However, during high rainfall the plant may overflow and there is a possibility that untreated/ semi-treated effluents may be washed into the Mooi River.
All these anthropogenic activities in the catchment contribute to pollution with nutrients such as inorganic nitrogen (nitrites, nitrates and ammonium) and phosphorus (orthophosphates). Phytoplankton (cyanobacteria and algae) is dependent on the availability of nutrients; however, excessive amounts will stimulate their growth and reduce water quality (Sen et al. 2013). Some cya-nobacteria can cause serious problems because of their ability to form blooms that result in scums covering the water's surface, creating aesthetically unacceptable conditions, taste and odour problems, as well as toxin production. Decomposition of blooms results in anoxia, causing fish kills (Janse van Vuuren & Taylor 2015).
The Mooi River is further impacted by the inflow of several tributaries, which are influenced by anthropogenic activities in their catchments. The two main tributaries are the Wonderfonteinspruit (WFS) and Loopspruit (LS) (Currie 2001). In the WFS, mining and WWTPs are the main contributors to pollution (Le Roux 2005). Acid mine drainage and heavy metal (uranium) pollution are major water quality concerns (Coetzee, Winde & Wade 2006). The WFS enters the Mooi River just upstream from Boskop Dam, which supplies drinking water to Potchefstroom. Gold mines, located between WFS and LS, also discharge effluents into LS (Van der Walt et al. 2002). The LS is further influenced by agricultural activities and irrigation effluents. Wasgoedspruit (WS), a smaller tributary, joins the Mooi River in Potchef-stroom and contains effluents from the polluted Poort-jie Dam, industrial effluents from Potchefstroom, as well as urban and storm water runoff. All these effluents enter the Mooi River without prior treatment (Pelser 2015).
The main stream of the Mooi River has been well studied in terms of a variety of subjects related to water chemistry and biota. Research on water chemistry includes the effects of mining (Coetzee et al. 2006) and heavy metal pollution, especially uranium (Winde 2010), contaminants in sediments (Fosso-Kankeu et al. 2015), distribution of inorganic contaminants (Manyatshe et al. 2017), as well as some studies on general water quality aspects (Labuschagne 2017). A diverse assemblage of biota was studied in the main river, including bacteria (Jordaan & Bezuidenhout 2015), cyanobacteria and algae (Venter et al. 2013), macroinvertebrates (Erasmus & De Kock 2015), fungi such as yeasts (Van Wyk 2012) and Hyphomycetes (Van der Merwe & Jooste 1988), plant communities (Du Toit, Du Preez & Cilliers 2021), riparian birds (Luyt 2018), frogs (Kruger 2014) and fish (Van Heerden et al. 2006). However the effect of the water quality of inflowing tributaries on the water quality of the main stream is still unknown.
Taking into account the variety of land uses surrounding the tributaries, especially mining activities in the catchment of the WFS as well as industrial effluents with high conductivity levels entering the WS (personal observation), it was suspected that the tributaries should have a major impact on water quality, and phytoplankton density and diversity in the main stream.
The main aims of the study were therefore to investigate spatial changes in physico-chemical variables, and phytoplankton density and diversity in the Mooi River, and to relate it to the effect of inflowing tributaries. Furthermore, physico-chemical variables were compared to known limits and recommended water quality objectives. This represents the first study on the influence of tributaries on the water quality and phytoplankton dynamics of the Mooi River.
Materials and methods
Study area
The Mooi River originates near the town of Derby (Boons area) and flows southwards into the Klerkskraal Dam (Figure 1). Several natural springs north of Klerkskraal Dam also contribute to flow volume in the upper Mooi River. In general, water quality in the upper section of the Mooi River, from its origin to the Klerkskraal Dam, is excellent because it's not directly influenced by any land use impacts (Le Roux 2005).
The entire WFS is surrounded by active as well as old, abandoned mines and it joins the Mooi River 31 km downstream from Klerkskraal Dam, near the Gerhard Minnebron (GM) Eye. The GM Eye is an active spring, forming part of a huge underground karst network that extends well into the upstream catchment of the WFS (Winde 2011). Peat is mined in a wetland south of the eye (Le Roux 2005).
Boskop Dam is located 7 km downstream from the confluence of the Mooi River and WFS. Potchef-stroom with its growing population, university and large industries depends on Boskop Dam for potable water (Van der Walt et al. 2002). From Boskop Dam, the Mooi River flows into the Potchefstroom Dam, located approximately 12 km downstream. Originally Potchefstroom Dam's main purpose was for irrigation, however, in recent years it also became popular for recreational activities.
The WS obtains water from Spitskopspruit and Poortjie Dam on the western side of Potchefstroom. From Poort-jie Dam, water flows through a wetland that may act as a filter of pollution (Du Toit et al. 2021). After leaving the wetland, water flows through the industrial area of Potchefstroom, after which the stream bed is converted into a concrete-lined canal that joins the Mooi River approximately 3 km downstream from Potchefstroom Dam.
The Mooi River then flows southwards through Potchef-stroom to its confluence with LS on the city's outskirts. Downstream of the confluence, the Mooi River flows past the WWTP where treated effluents are recycled into the Mooi River. From here, the Mooi River flows 25 km southwest, until it joins the Vaal River.
Eight sites, subjected to different sources of pollution, were selected along the Mooi River (Table 1). In addition, one site was selected in each of the following tributaries: WFS, GM and WS.
Sampling and analytical procedures
Phytoplankton sampling dates coincided with physico-chemical sampling and analyses done by the JB Marks Municipality, Potchefstroom. Physico-chemical water quality data were obtained from the municipality. Sampling was done in the mornings, starting upstream and ending downstream, just before the confluence of the Mooi and Vaal rivers. At each site a 100 ml surface sample was collected on a monthly basis from January to December 2015. Two millilitres of 37% formaldehyde (formalin) solution were added to each sample to preserve the phytoplankton.
In the laboratory, each sample was shaken vigorously to ensure even distribution of phytoplankton cells. Each sample was transferred to a metal container, and a mechanical hammer, applying a pressure of 49.56 kPa, was used to pressure-deflate the gas vacuoles of cyano-bacteria. Depending on the phytoplankton density and concentration of suspended material, a known volume of water (50 or 100 ml) was filtered through a cellulose nitrate filter with a pore size of 0.45 μηι to concentrate the phytoplankton cells for counting. The filter paper with phytoplankton was transferred to 10 ml tubes filled with distilled water. A vortex mixer was used to remove phytoplankton from the filter paper, re-suspending the cells into 10 ml distilled water. Depending on the phytoplankton density, 1-6 ml of the sample was extracted with a Finn pipette and transferred to Utermöhl sedimentation chambers. The sedimentation chamber was filled with distilled water and it was covered with a circular glass cover slip to avoid evaporation. Sedimentation chambers were placed in a desiccator for at least 48 hours (24 hours settling time per cm length of the sedimentation tube) to allow the phytoplankton to settle to the bottom.
After two days phytoplankton was identified to genus level using an inverted Zeiss light microscope (at a maximum of 400x magnification) and a variety of literature such as Janse van Vuuren et al. (2006), John, Whit-ton and Brook (2002), Taylor, Harding and Archibald (2007), and Wehr and Sheath (2003). The transect counting technique, described by Lund, Kipling and Le Cren (1958), was used for phytoplankton enumeration. For colonies and filaments, individual cells were counted as separate entities. The phytoplankton data, initially captured over a 12-month period, was averaged on a quarterly basis to present the data in seasonal format as follows: December-February (summer), March-May (autumn), June-August (winter), and SeptemberNovember (spring).
Statistical analysis of data
Statistical analyses on phytoplankton and physico-chemical environmental data, as well as the compilation of area and pie charts, were done using STATISTICA 13.3 (StatSoft, Inc. 2017). Kolmogorov-Smirnov and Lilliefors tests for normality were used. The natural log (ln) of the phytoplankton data was determined and used in the statistical analysis. Canonical Correspondence Analysis (CCA) was performed using CANOCO 4.5 (Ter Braak & Prentice 1988) to determine the relationships between distribution of phyla and related environmental factors and gradients.
Results
A summary of the physico-chemical water quality data, in the form of descriptive statistics, is presented in Table 2. Minimum, mean and maximum values, as well as standard deviations and number of samples analysed, are indicated in Table 2. Resource Quality Objectives (RQO) and Resource Water Quality Objectives (RWQO) are also included in this table. Physico-chemical variables include the concentration of inorganic nutrients (ammonia, nitrate and orthophosphate). Turbidity, total dissolved solids (TDS), electrical conductivity (EC), the concentration of a variety of major ions, and pH were also measured.
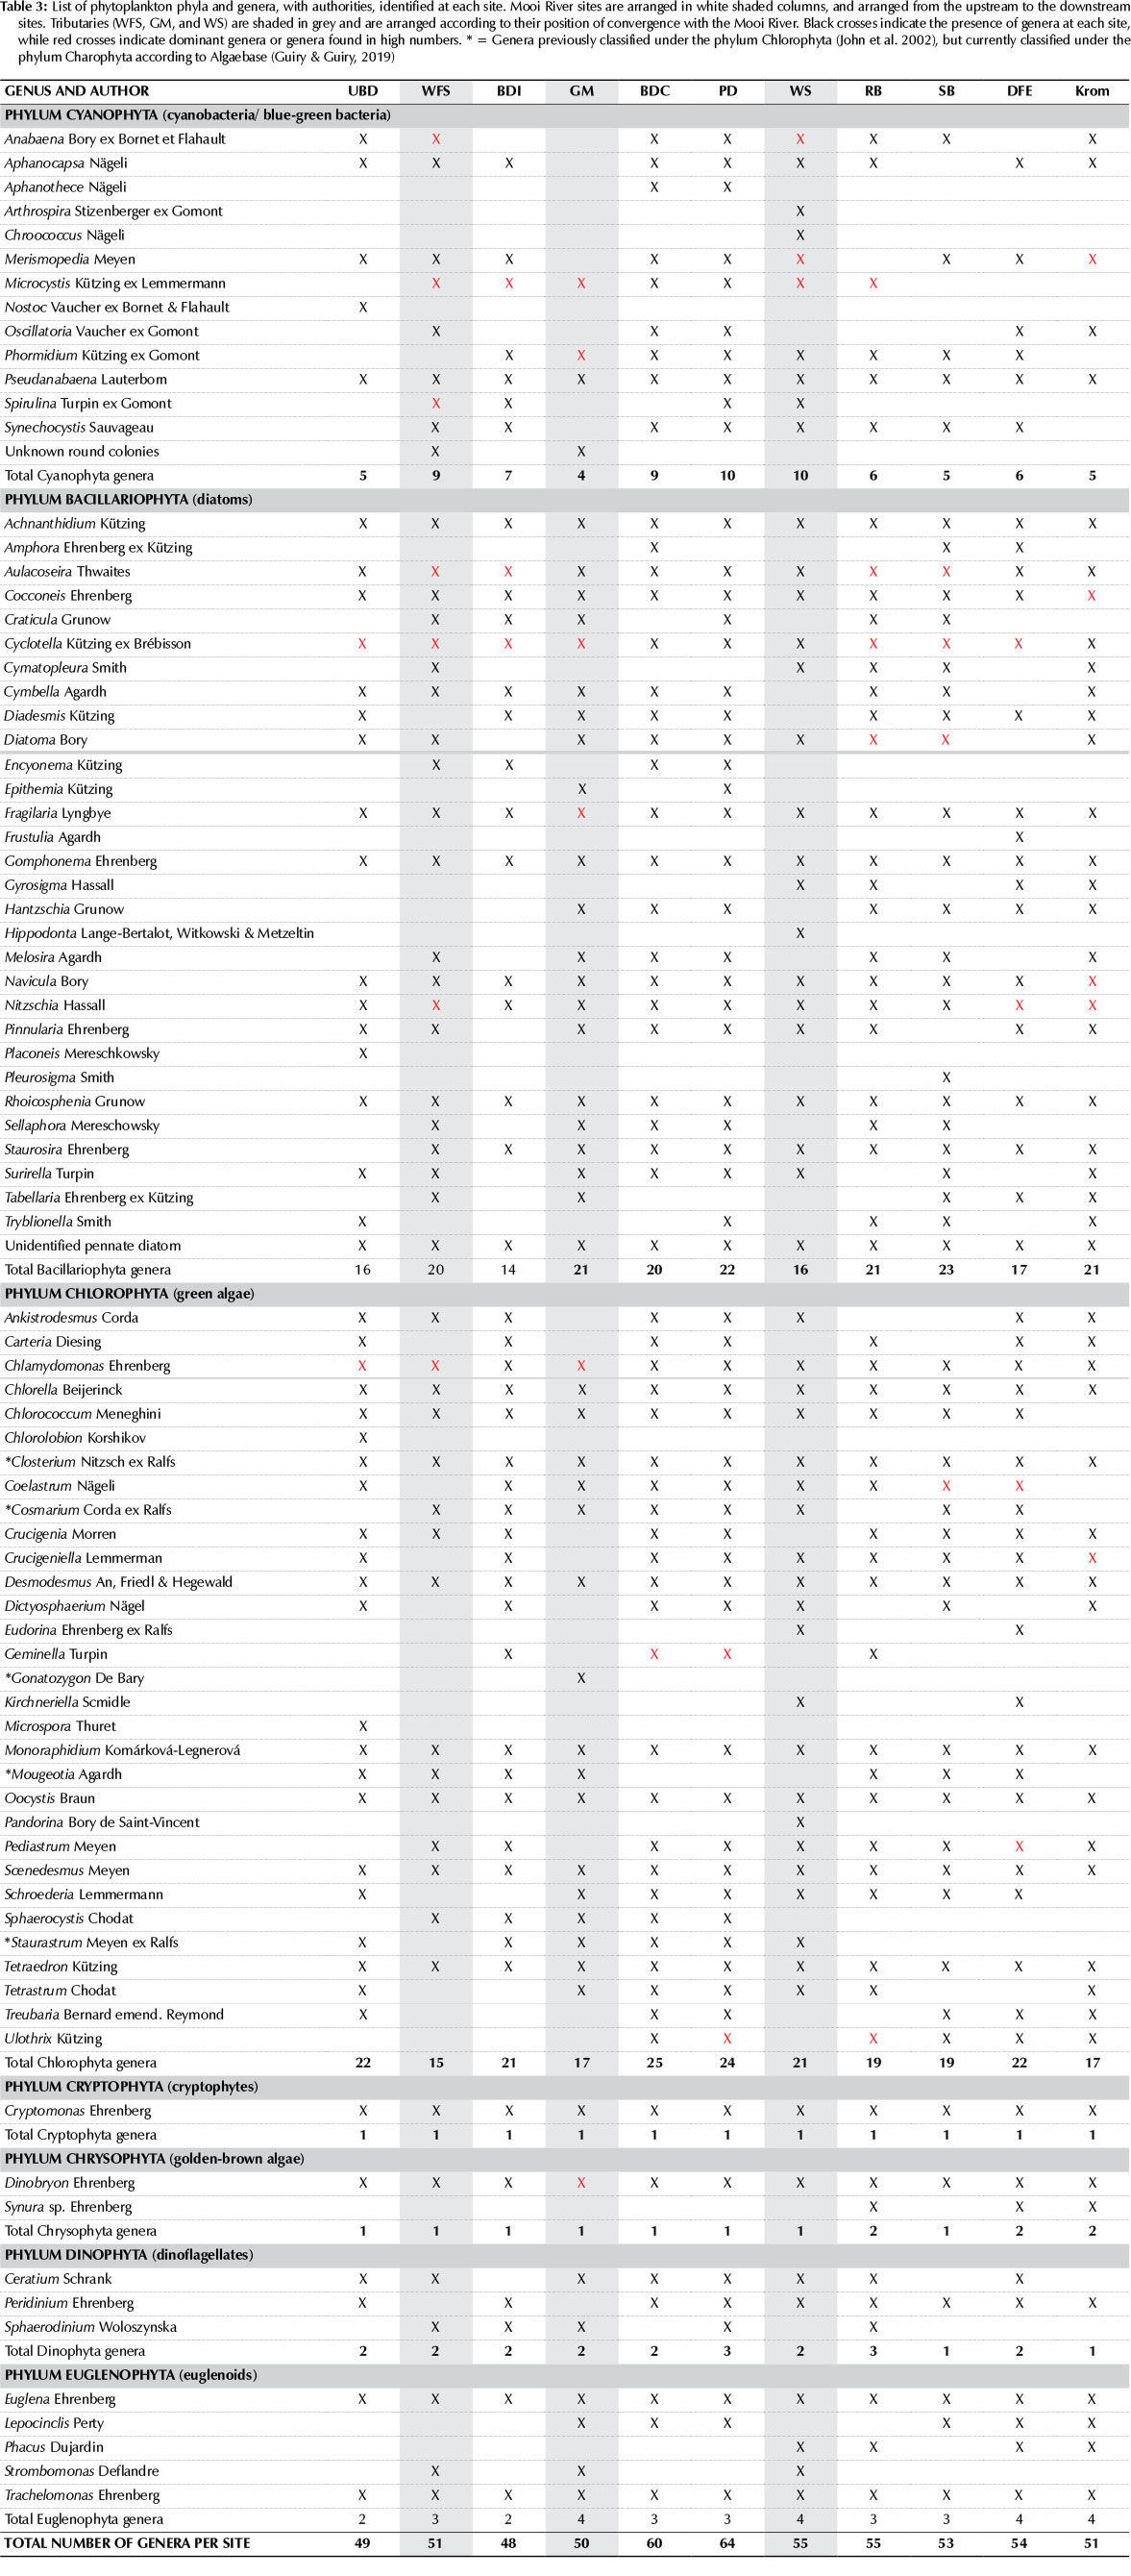
Results on phytoplankton are presented in Table 3. Seven phytoplankton phyla were found in the Mooi River, as well as at the three sites located in the tributaries. The Bacillariophyta (diatoms) and Chlorophyta (green algae) were most dense (cells per ml) and diverse (number of genera present). The Cyanophyta (cyanobacte-ria) was less diverse, but also reached high densities. These three phyla succeeded one another as the dominants. A comparison of the different sites revealed that maximum diversity was found in the middle reaches of the main stream (64 genera at Site 4, 60 genera at Site 3), while minimum diversity was found at Site 2 (48 genera).
Interesting observations were made regarding the spatial distribution of genera in the Mooi River and tributaries. Nostoc, Placoneis, Chlorolobion and Microspora were present at the uppermost site of the Mooi River (Site 1), but absent further downstream, as well as from the tributaries. Aphanothece was only present in the middle reaches of the main stream. Staurosira and Pediastrum were absent at Site 1 in the Mooi River, but present in the downstream reaches. Tryblionella, Car-teria and Treubaria were found in the Mooi River but were absent from all tributaries. Genera found in the tributaries, but not in the Mooi River, included Hip-podonta and Pandorina (WS) and Gonatozygon (GM).
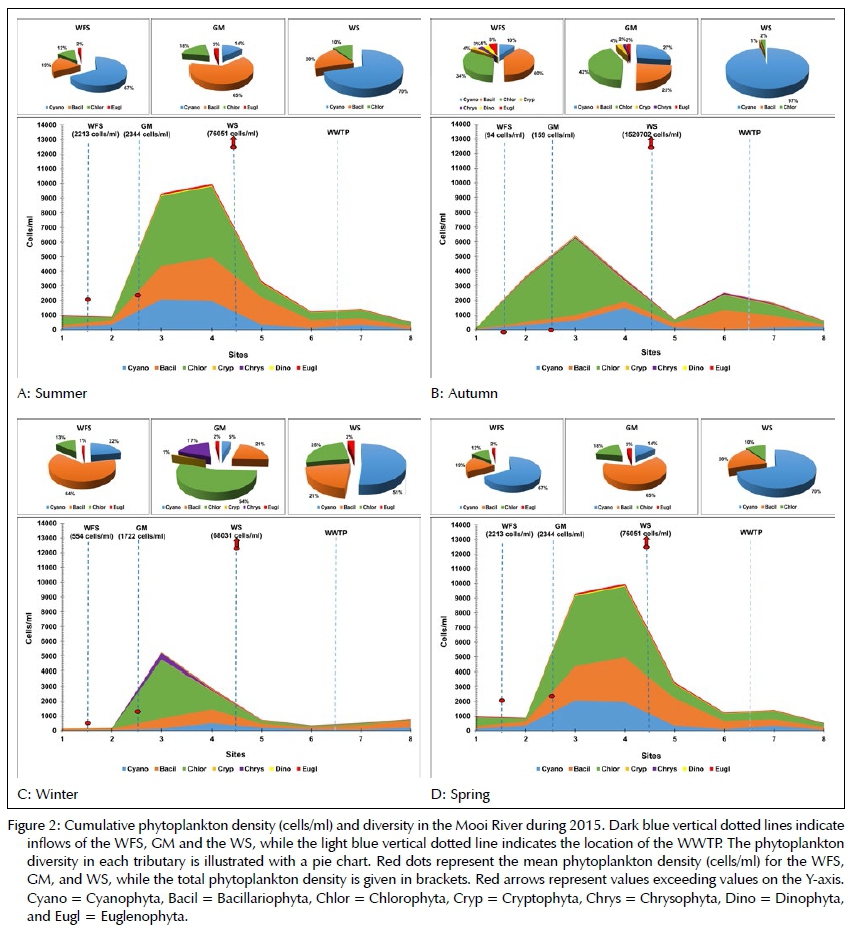
Figure 2A-D illustrates phytoplankton density and diversity at different sites in the Mooi River. Pie charts illustrate phytoplankton diversity in the three tributaries for the same time periods. During the entire study period a mixture of Chlorophyta, Bacillariophyta and Cyano-phyta was found in the Mooi River main stream. These three phyla also dominated in the tributaries, where small percentages of other algal phyla were noticeable. Phytoplankton reached highest densities during summer months (Figure 2A), whereafter the density decreased through autumn (Figure 2B) to the winter period (Figure 2C). With the onset of spring (Figure 2D), the general phytoplankton density increased again towards summer.
When phytoplankton density in the tributaries was compared to that in the Mooi River, it was clear that the densities in the WFS and GM were low. However, phytoplankton density in the WS was much higher than at any site in the Mooi River. Besides Chlorophyta, Bacillariophyta and Cyanophyta, relatively small percentages of Euglenophyta were found across seasons in most tributaries (Figure 2A-D). In winter (Figure 2C), high densities of Dinobryon, a colonial member of the Chrysophyta, was responsible for a 17% contribution of Chrysophyta to the total phytoplankton diversity in GM. Dinobryon was also present in high densities at Site 3 in the Mooi River during winter. In contrast to all sites in the Mooi River, WFS and GM, the WS was dominated by cyanobacteria during all seasons. During summer and autumn, cyanobacteria in the WSD comprised 70% and 97% of the total phytoplankton, respectively. During the summer months common cyanobacteria in the WS included Anabaena, Merismopedia and Microcystis, while the dominance of cyanobacteria during autumn in the WS could be ascribed exclusively to a bloom of Microcystis. Cyanobacteria, such as Anabaena and Microcystis, also dominated during summer months in the WFS (67%; Figure 2A). During autumn (Figure 2B) the WFS was diverse in terms of the number of phyla present.
Noticeable patterns were observed regarding spatial distributions of phytoplankton in the Mooi River. In general, densities were low at the uppermost sites (1 and 2) of the river. Downstream from the Boskop Dam, an increase in phytoplankton density was observed across all seasons. Maximum densities were recorded at Site 3 (in autumn, winter and spring) and Site 4 (summer). From Site 3 the phytoplankton density showed a general downstream decrease to the confluence of the Mooi and the Vaal rivers. It does not seem as if the inflow of the WS, with high phytoplankton densities (especially cyanobacteria), had a marked effect on phytoplankton density or diversity in the Mooi River's main stream downstream from the inflow.
Results of a multivariate analysis, in the form of a CCA performed on physico-chemical and phytoplankton data at the different sites, are presented in Figure 3. The CCA only includes data from the Mooi River and not the tributaries as the purpose of the CCA was to draw a conclusion for conditions in the river itself, and to see how different water quality variables relate to one another in the main stream.
Eigenvalues for the first four axes of the CCA are presented in Table 4. The first axis explained 58% of the variance in the species-environmental data, while the second axis explained an additional 25% of the variance in the species-environment relationship. The Monte Carlo Permutation test on all canonical axes (number of permutations = 499) showed a P-value of 0.006 and an F-ratio of 1.767, indicating that the environmental (physico-chemical) variables significantly correlated with the phytoplankton data. The CCA confirms significant relationships between variables. EC, TDS, and turbidity had strong positive correlations with one another, as well as with chloride (Cl-) and fluoride (F-).
As a result of inflation, TDS was eliminated from the CCA (Figure 4) and EC was used as a representative of salinity. The statistical significance of this correlation was supported by Kruskal-Wallis correlation values of P < 0.05. Calcium (Ca2+) and Magnesium (Mg2+), in contrast, showed a statistical significant (P < 0.05) negative correlation with each other as their vectors point in opposite directions (Figure 3). Cyanobacteria (Cyano) was positively correlated with orthophosphate (PO4-P), pH and magnesium (Mg2+).
The length of the orthophosphate vector indicates that it was the most important variable having the most influence on the axis. The positive correlation between cyanobacteria and orthophosphates, coupled with or-thophosphates having the most important influence, emphasise the importance of orthophosphate on cy-anobacteria dynamics. Besides orthophosphates, cya-nobacteria also showed positive correlations with nutrients, such as ammonia (NH3+) and nitrates (NO3-). Chlorophyta, Bacillariophyta and Euglenophyta were also correlated positively with nutrient concentrations. Cryptophyta, Chrysophyta and Dinophyta that did not occur frequently or in high density, were generally associated with low phosphate concentrations, as well as low EC and turbidity values. pH was negatively correlated with most physico-chemical variables, except magnesium. Site 3 and Potchefstroom Dam, displayed the highest phytoplankton density recorded for the Mooi River, and these sites were negatively correlated with nutrients.
Discussion
Physico-chemical variables
The National Water Act, Act No. 36 of 1998, uses different sets of scientific criteria, one of which focuses on the physico-chemical variables. These criteria are abbreviated as RQO (see results for full names). Limits set by the criteria can be seen as goals to strive for, in order to achieve a certain desired water quality for a specific area. The notion is to compare these limits to current findings to determine if they are met (Dickens, Pringle & Macfarlane 2011). RQO play an important role in water resource management because it is easier to have clear sets of criteria to work towards and in this way the protection of water becomes a reality (Dickens et al. 2011). Nine water management areas (WMA's) were identified in South Africa (DWS 2016) and the RQO criteria differ for each WMA. The Mooi River is classified under the Vaal WMA for which the RQO are currently under review (Labuschagne 2017); however Dickens et al. (2011) proposed that available information should be used, where possible. A second set of criteria, RWQO, that specifically target the Mooi River catchment, was recommended by The Department of Water Affairs (DWA 2009). Concentration ranges of physico-chemical variables were examined and compared with existing RQO and RWQO (Table 2).
In general, nutrient concentrations measured in the Mooi River, as well as in all three tributaries, were high and mean values usually exceeded limits set by both RQO and RWQO (Table 2). An exception was the or-thophosphate concentration in WFS and at two sites in the main stream that exceeded the RQO limit, but still fell within RWQO limit. It is well known that anthropogenic activities result in elevated nutrient levels that can ultimately lead to eutrophication of a water body. According to Fu et al. (2012) the main causes of elevated ammonia levels are urban, agricultural (especially pig and poultry farming), and industrial runoff. The highest mean and maximum ammonia concentrations in the main stream of the Mooi River were measured at sites 5 and 6, located just downstream from the inflow of the WS (Table 2). A sudden elevation in ammonia levels at these two sites (Figure 1) can be ascribed to inflow of ammonia from the WS (mean ammonia of 1.12 mg/l). The WS flows through the industrial area of Potchefstroom where it receives several point sources of pollution. Urban and storm water effluents further downstream also contribute to high ammonia levels. Other factors that may contribute to high ammonia concentrations in the Mooi River include pig farming in the upper reaches, WWTP's in the catchment of tributaries and peat mining.
According to Bourbonniere (2009), peat mining drainage results in elevated ammonia concentrations in water bodies through decomposition of soil. Irrigation, agriculture and sewage effluents are known to elevate nitrate concentrations in water bodies (Tredoux, Engelbrecht & Israel 2009). All these land uses are common practices in the catchment of the Mooi River and may have resulted in nitrate concentrations exceeding the RWQO limit. Highest mean and maximum nitrate concentrations were found at Site 1 in the Mooi River, the middle reaches (sites 4 and 5), and also downstream from the WWTP (Site 7). Unfortunately, no samples were taken from the WWTP. At the uppermost site in the river (Site 1) intensive agricultural activities, coupled with irrigation, may have resulted in elevated nitrate levels, while effluents from the WS (mean nitrate concentration of 1.12 mg/l) and WWTP may have resulted in high nitrate concentrations at sites 5 and 7, respectively. When the sum of ammonia and nitrate in the Mooi River and its tributaries is compared to the dissolved inorganic nitrogen ranges in Department of Water Affairs & Forestry (DWAF 1996e) and Dallas and Day (2004), it is clear that the Mooi River system can be classified as mesotrophic in terms of inorganic nitrogen concentration.
Mean orthophosphate concentrations in the entire Mooi River, the GM and the WS exceeded both guidelines. The mean concentration in the WFS (0.34 mg/l) exceeded the RQO limit of < 0.125 mg/l but was within the limit of 0.4 mg/l set by the RWQO (Table 2).
Highest orthophosphate concentrations were recorded at Site 7 (Figure 1) located just downstream from the WWTR It is, however, suspected that return flows from the treatment plant may have been rich in orthophos-phates and it is therefore recommended that sampling sites before and after the inflow of the WWTP should be included in future research. Muscutt and Withers (1996) found that orthophosphates are mainly influenced by agricultural, industrial and sewage effluents, all pronounced activities in the Mooi River's catchment. Mean orthophosphate concentrations in the tributaries ranged from 0.34 mg/l (WFS) to 0.54 mg/l (GM) to 1.02 mg/l (WS). The inflow of WS was responsible for doubling the mean orthophosphate concentration from 0.36 mg/l (site 4) to 0.72 mg/l (site 5; Table 2). According to DWAF, 1996e), orthophosphate concentrations above 0.25 mg/l are indicative of hypertrophy. Based on mean values for the entire Mooi River, and the tributaries, the Mooi River system can be classified as hy-pertrophic in terms of orthophosphate concentration.
TDS and EC are usually positively correlated with each other as both variables provide an indication of salinity caused by major ions and electrically charged particles in the water. The RWQO limit for TDS in the Mooi River is 370.5 mg/l, while that of EC is 57 mS/m. TDS and EC at Site 1 of the Mooi River did not exceed these limits. Mean TDS concentrations exceeded the RWQO limit at sites further downstream. Mean EC downstream of Site 1 also exceeded the RWQO guideline, but still fell within the RQO limit. The salinity of most inland waters is usually between 100 and 500 mg/l (Wetzel 2001). Salinity (TDS) in the Mooi River and its tributaries exceeded 400 mg/l. Although TDS concentration at Site 1 of the Mooi River falls within the RWQO guideline, it is still more than double the 100 mg/l found in most rivers worldwide. High TDS/EC in the Mooi River can be ascribed to the dolomitic geology underlying the area, irrigation along the length of the river, leaching and erosion from older tailings storage facilities (Van der Walt et al. 2002), as well as several point sources of pollution e.g. various waste water effluents from de-watering mines and WWTP's, industrial effluents, and poorly treated sewage effluents from informal settlements. The highest mean TDS concentration of approximately 560 mg/l was found in the GM tributary and the site located just downstream of the WWTP (Site 7).
Maximum and highest mean EC was found at the two most downstream sites in the river. It therefore seems as if return flows from the WWTP could have contributed to both elevated TDS and EC levels, as well as increasing nutrient concentrations in the downstream section of the Mooi River.
A high rate of abstraction for irrigation also dramatically reduces the flow rate in this section of the river. TDS is the sum of major ions, and therefore relates positively with cations (calcium, magnesium, sodium, and potassium) and anions (bicarbonate, carbonate, chloride, sulfate, and fluoride). Sulfate was the most abundant major ion in the Mooi River system (Table 2). Sulfate pollution is known to be caused by mining activities (Durandt 2012), explaining maximum sulfate concentrations in the WFS and GM tributaries, which are surrounded by mines. Sulfate concentrations in GM, where peatlands are found (Figure 1), exceeded that of WFS (Table 2). According to Coleman Wasik et al. (2015), peatlands are considered to be sinks for atmospherically deposited sulfate and, coupled with droughts, may further elevate sulfate concentrations in aquatic environments. Sulfate, chloride and fluoride concentrations fell within the RWQO limits at the uppermost site of the river, however as the river continued its path downstream all these concentrations increased and the mean concentration of the entire Mooi River exceeded the RWQO goal. Mean calcium and magnesium concentrations exceeded goals set by the RWQO at all sites.
The mean pH in Mooi River and all the tributaries slightly exceeded the RWQO limit of 8, but not the RQO limit of < 8.8 (Table 2). Generally, mean pH ranges between 6 and 8.9 in fresh waters (Dallas & Day 2004). Mean pH values for the entire Mooi River and the tributaries corresponded to these ranges. If pH exceeds 8, ammonium is converted to ammonia, which is potentially toxic to aquatic organisms (Dallas & Day 2004). High pH levels in the WS may explain high ammonia concentrations at this site (Table 2). High phy-toplankton densities in the WS (Figure 2) could have elevated the pH as a result of the uptake of CO2 during photosynthesis.
Turbidity was the lowest at Site 1 and the highest at the most downstream site (Site 8) in the Mooi River. Turbidity is the result of inorganic and organic suspended solids (Dallas & Day 2004), and dependent on the flow rate of the water bringing particles into suspension. At Site 8, a weir is built in the river, that resulted in high flow rates and fast mixing that keeps particles in suspension. Water in the GM (a spring) was extremely clear (mean turbidity of 0.59 NTU), while the mean turbidity in the WS (24 NTU) was the highest measured in the Mooi River system. High turbidity levels in the WS can be ascribed to high phytoplankton densities reaching more than 1.5 million cells/ml at times (Figure 2B). No RQO or RWQO guidelines were set for turbidity; however guidelines were presented in the DWAF (1996a-d) water quality guidelines for water for domestic, recreational, agricultural and industrial use. These guidelines do, however, differ considerably for the type of water usage. In general, turbidity levels in the tributaries did not influence turbidity in the Mooi River system significantly, probably as a result of dilution. It is possible that the flow in the Mooi River far exceeded that in the tributaries, but actual flow data would be required to test this.
Phytoplankton density and diversity
River systems are often dominated by Bacillariophyta, Chlorophyta and Cyanophyta and succession between these three phyla as the dominants, as was found in the Mooi River, is well known from literature on rivers throughout the world (Sarwade & Kamble 2013). Of these three phyla, Cyanophyta is potentially problematic and blooms can result in, amongst others, aesthetically unacceptable scum formations, recreational problems, such as skin and eye irritations, and the production of tastes, odours and toxins (Mankiewicz et al. 2003).
In general, low phytoplankton densities were recorded at Site 1. As the Mooi River originates from an eye (spring), it can be reasoned that low phytoplankton densities can be ascribed to pristine, oligotrophic spring water, containing low nutrient concentrations. However, nutrient concentrations at the uppermost site (Site 1) of the river were comparable to concentrations further downstream, where phytoplankton was found in high densities. Elevated nutrient concentrations at Site 1 can be the result of agricultural activities in the surrounding area. Low turbidity levels at Site 1 allowed for sufficient photosynthetically available radiation. However, overhanging riparian vegetation could have blocked light penetration, which can explain lower phytoplankton densities. Site 1 is also located far upstream close to the origin of the river, resulting in limited time for phy-toplankton establishment. Other factors such as flow rate and water temperature have an influence on phy-toplankton growth (Falkowski, Greene & Geider 1992), but were not measured.
Chlamydomonas, indicative of organic pollution (Bellinger & Sigee 2010), was found in high densities at Site 1. Other potential problematic algae encountered at this site included Cyclotella, reported to produce taste and odour problems (Bellinger & Sigee 2010; Palmer 1969). Nostoc is a nitrogen-fixing cyanobacterium associated with nitrogen-deficient habitats (Douterelo, Perona & Mateo 2004). Several studies on river systems found Nostoc to be dense at upstream sites while absent downstream, which was ascribed to low nutrient concentrations upstream (Douterelo et al. 2004; Janse van Vuuren & Taylor 2015). This was, however, not the case for Site 1 with moderate nutrient concentrations. Some Nostoc species are able to produce toxins in fresh waters (Bellinger & Sigee 2010). Chlorolobion, Placon-eis and Microspora were present in low concentrations exclusively at the uppermost site of the Mooi River (Table 3). Placoneis can be present in a broad range of water chemistry (unpolluted water, slightly polluted water, brackish water, and sediments; Taylor et al. 2007). Microspora often dominates in streams contaminated with heavy metals (John et al. 2002) and its presence at the uppermost site of the Mooi River can be the result of heavy metal pollution by mines in WFS and GM areas (via underground compartments - data on heavy metals not presented).
Results in Figure 2 show that maximum phytoplank-ton density during all seasons was found in the middle reaches of the Mooi River (sites 3 and 4), located between Boskop Dam and the city of Potchefstroom. Sites 3 and 4 reflected very similar water quality conditions (Table 2), with nutrient levels high enough to sustain phytoplankton growth. Agricultural activities and an ammunition manufacturing company are the only known factors that may have contributed to water pollution at sites 3 and 4 (Table 1). Sufficient nutrients, coupled with relatively low turbidity levels, could have stimulated phytoplankton growth in the middle reaches. Nutrient spiralling from upstream may have provided an important nutrient source. High phytoplankton densities at these sites could result in higher mean pH values compared to other sites in the Mooi River's main stream (Table 2). In general, phytoplankton at these sites consisted of a mixture of Chlorophyta, Bacillariophyta and Cyanophyta, with a relatively small percentage of Chrysophyta (Dinobryon) during winter. Dinobryon was probably introduced into the main stream by GM in which it comprised 17% of the total phytoplankton diversity (Figure 2).
Cyanobacteria reached maximum densities in the middle reaches of the river and their presence was associated with water quality problems. Genera that were most dense in sites 3 and 4 included: Anabaena, Aulacoseira, Cyclotella, Diatoma, Geminella, and Ulothrix (Table 3). Taylor et al. (2007) stated that Diatoma is indicative of hard water, coupled with high nutrient levels, corresponding to conditions found at sites 3 and 4 (Table 2). Diatoma occurs in rivers and slow flowing water-bodies, where they usually attach to green algae, and high Diatoma densities correspond to high densities of Chlorophyta present at sites 3 and 4 (Figure 2). High numbers of Aulacoseira in sites 3 and 4 corresponded to the findings of Luyt (2018) and can most probably be attributed to high EC levels. Both Aulacoseira and Cyclotella can cause taste and odours, as well as significant filter clogging problems during drinking water purification (Bellinger & Sigee 2010; Palmer 1969).
Downstream sites (sites 5 to 8) in the Mooi River had low phytoplankton densities, comparable to densities found at the uppermost site. These sites displayed high turbidity levels, which could have limited photosyn-thetically available radiation. Large trees on the banks shading the river may also have contributed to less light penetrating the water. Fast flow rates at the weir at Site 8, probably suppressed the development of phyto-plankton, resulting in low densities. High nutrient concentrations at sites 5 to 8 (Table 2) could have favoured the growth of Aulacoseira, Coelastrum, Diatoma, Dic-tyosphaerium, Merismopedia, Microcystis, Pediastrum, Scenedesmus, and Ulothrix as they are often associated with nutrient-enriched conditions (Bellinger & Sigee 2010). Aulacoseira prefers high EC levels (Luyt 2018), explaining their presence at sites 5 and 6 with high TDS concentration and EC levels (Table 2). Diatoma is typically found in the middle and lower reaches of the river that displayed hard water conditions (Table 2).
Phytoplankton density and diversity in the tributaries did not change the Mooi River's phytoplankton assemblages downstream of their inflows. Research in Brazil (Rodrigues et al. 2009) showed that medium and large tributaries are able to influence main rivers in terms of phytoplankton dynamics. Outcomes of the research for smaller tributaries, such as those found in the Mooi River catchment, differ (Bahnwart, Hubener & Schubert 1999). The WFS is a small tributary that is often dry, feeding the Mooi River only during high rainfall periods. The WFS did not have any apparent impact on phytoplankton density or diversity in the main stream after the inflow (Figure 2). Similar genera were observed in the GM and at sites downstream of its inflow. During winter Dinobryon (phylum Chryso-phyta) was prominent in GM, and at the same period Dinobryon colonies were also present at site 3 located just downstream from the GM inflow (Figure 2C). It is uncertain whether similarities were due to importation of Dinobryon via the GM tributary, or whether it could be the result of other factors, such as nutrient concentrations or seasonality, because Dinobryon is known to prefer cold water conditions (Heinze et al. 2013).
The WS tributary is often polluted by sewage, due to blocked pumps, and was dominated by extremely high densities of cyanobacteria as a result of mean nutrient concentrations exceeding 1.0 mg/l. During the present study, blooms in WS were present throughout the year and Microcystis formed a thick blue-green scum on the water's surface. Other genera present in high densities in the WS included: Anabaena, Coelastrum, Cymatopleura, Diatoma, Eudorina, Gomphonema, Merismopedia, Pandorina, Pediastrum, and Scened-esmus (Table 3). All these genera are known to prefer nutrient-rich water (Bellinger & Sigee 2010). Gompho-nema often occurs in sewage-enriched water (Janse van Vuuren et al. 2006). Hipodonta is typically found in eutrophic conditions and can tolerate critical pollution levels (Taylor et al. 2007) - it was present in the WS, but absent from all other sites.
In spite of high phytoplankton numbers, the inflow of the WS did not have an apparent effect on phytoplank-ton density at downstream sites. Water from the WS flows through different areas, including a wetland and concrete canal, before it reaches Site 5. The concrete canal serves as an illegal dumping site for garden refuse and plant material that often establishes and grows in the WS absorbing bio-available nutrients, therefore improving the water quality before it flows into the Mooi River. Flow rates also slow considerably in the final stretch of WS and the water is rather shallow before it reaches the Mooi River, thus planktonic organisms may settle or become entrained in detritus before entering the Mooi River.
Multivariate analyses
Nutrients determine the rate of primary production and phytoplankton biomass and they were positively correlated with Bacillariophyta, Chlorophyta, Cyanophyta and Euglenophyta (Figure 3). Of all the nutrients, ortho-phosphates were the most influential (length of vector) and can be regarded as the main nutrient determining phytoplankton density in this study. Orthophosphates were strongly positively correlated with cyanobacteria (Figure 3) and results of this study support those of other studies, such as Elser, Marzolf & Goldman (1990), that phosphates stimulate cyanobacterial growth. Green algae and diatoms were the most dense and diverse phyla in the Mooi River. Felisberto, Leandrini and Rodrigues (2011) found green algae benefit from increased phosphorus in the Corvo River, Brazil. Although cyanobac-teria were less diverse, they were abundant, especially at sites 3 and 4 and in the WS tributary.
Sites 3 and 4 correlated negatively with nutrients (Figure 3), probably as a result of high phytoplankton densities depleting nutrients. Maximum pH was recorded in the WS followed by sites 3 and 4 (Table 2). Positive relationships between cyanobacteria and turbidity, and cyanobacteria and pH, can be the result of suspended cyanobacteria responsible for elevated turbidity levels and photosynthesis responsible for elevated pH levels. According to Chorus and Bartram (1999), cyanobacte-ria have a competitive advantage in turbid conditions because they are specially adapted to absorb green light and therefore can live in environments with lower light intensities. Cyanobacteria have phycobiliproteins, which enable them to absorb a green portion of light (during low light intensities) and turn it to red light, which is the colour of light required by chlorophyll. In some cases cyanobacteria blooms may be the result of high turbidity levels, while in other cases cyanobacterial blooms may cause the high turbidity. This could explain the positive correlation between cyanobacteria and turbidity (Figure 3).
Some cyanobacteria, such as Microcystis and Anabae-na, have gas vacuoles giving them the ability to float and they can form large green scums on the surface that prevents light passing through the water column. Euglenophyta was one of the less conspicuous phyla encountered (2% relative density). Although present in low densities, euglenoids were more abundant than Cryptophyta, Chrysophyta or Dinophyta. Euglenophy-ta were positively correlated with nutrients, TDS/EC and turbidity (Figure 3). This is in accordance to descriptions in Janse van Vuuren et al. (2006), stating that most species within this phylum are known to occur in nutrient-rich habitats. On the contrary, Cryptophyta and Chrysophyta showed a negative correlation with orthophosphates and turbidity (Figure 3), that supports findings by Palmer (1980) that these phyla are generally associated with clean and unpolluted water.
Conclusions
The entire Mooi River catchment area is subjected to pollution as a result of various land use activities contributing to elevated nutrient concentrations.
It can be concluded that the WFS, GM and WS tributaries affected the concentrations of physico-chemical variables in the Mooi River downstream from their points of inflow. In terms of nutrient (especially ammonia) concentrations, it was clear that all three tributaries affected the Mooi River downstream from their points of inflow. WS and the WWTP had a significant effect in terms of contributing to elevated nitrate and orthophosphate levels. The mean ammonia and nitrate concentrations are indicative of mesotrophic conditions, while the mean orthophosphate concentration is indicative of hypertrophic conditions. High TDS concentrations and EC levels in the tributaries also affected the Mooi River downstream from the points of inflow. Although no TDS and EC data were available for the WWTP, it seems as if it had a significant influence on downstream sites in the Mooi River and therefore further research on the effects of the WWTP on the Mooi River is strongly recommended.
Of the seven phytoplankton phyla found, green algae, diatoms and cyanobacteria were most dense and diverse, while euglenoids, dinoflagellates, golden-brown algae, and cryptophytes were found in low densities and diversity. In general, phytoplankton density and diversity were relatively low in the upper and lower reaches of the Mooi River, compared to the middle reaches (sites 3 and 4). Maximum density of cyanobacteria were found in the middle reaches of the river and were usually associated with water quality problems.
Most genera found at sites 3 and 4 were indicative of high nutrient concentrations.
The phytoplankton density and diversity in the tributaries did not have a significant effect on the Mooi River's phytoplankton downstream. Similar genera were however, on occasion, observed in a tributary and the site just downstream from its inflow. Most phytoplank-ton found in the Mooi River and tributaries could be responsible for nuisance conditions. Microcystis and Anabaena are known to cause taste and odour problems and secrete toxins. The WS was entirely dominated by cyanobacteria with Microcystis reaching bloom proportions and forming thick scums at this site. These blooms were accompanied by high nutrient concentrations, high turbidity levels and relatively high pH values.
Nutrients positively correlated with diatoms, green algae, cyanobacteria and euglenoids. Orthophosphates and cyanobacteria showed a strong positive correlation, emphasising the important effect of this nutrient on cyanobacterial densities. Relatively low density and diversity of Chrysophyta and Cryptophyta, phyla generally associated with clean and unpolluted water, emphasise the fact that the Mooi River and its tributaries can be regarded as a polluted system with a continuous deterioration in water quality over time.
Acknowledgements
The authors would like to thank C. van Dyk at the Cartographic Services, School of Geo- and Spatial Sciences, North-West University, Potchefstroom for drawing the map (Figure 1). Thank you also to Prof. Sandra Barnard for her assistance with the Canoco graph and help with statistical analysis and to L. Bothma at the JB Marks Municipality for providing the physico-chemical data.
Authors' contributions
LK did the sampling and research as part of her MSc project and also wrote part of the text. SJvV assisted in phytoplankton identification, wrote the text and was the study leader of the project. AL took part in algae identification and in article preparation.
Disclaimer
The views expressed in the submitted article are the authors' own and not that of their institution.
Competing interests
The authors declare that they have no financial or personal relationships that may have inappropriately influenced them in writing this article.
References
Bahnwart, M., Hubener, T. & Schubert, H., 1999, 'Downstream changes phytoplankton composition and biomass in a lowland river-lake system (Warnow River, Germany)' Hydrobiologia 391, 99-111. [ Links ]
Bellinger, E.G. & Sigee, D.C., 2010, Freshwater Algae: Identification and the Use as Bioindicators, NJ: John Wiley & Sons, West Sussex. http://dx.doi.org/10.1002/9780470689554 [ Links ]
Bourbonniere, R.A., 2009, 'Review of Water Chemistry Research in Natural and Disturbed Peatlands', Canadian Water Resources Journal 34(4): 393-414. http://dx.doi.org/10.4296/cwrj3404393 [ Links ]
Chorus, I. & Bartram, J., 1999, Toxic cyanobacteria in water: a guide to their public health consequences, monitoring and management, CRC Press, London. http://dx.doi.org/10.4324/9780203478073 [ Links ]
Coetzee, H., Winde, F. & Wade, PW., 2006, An Assessment of Sources, Pathways, Mechanisms and Risks of Current and Potential Future Pollution of Water and Sediments in Gold-Mining Areas of the Wonderfonteinspruit Catchment, WRC Report No. 1214/1/06, Water Research Commission, Pretoria, South Africa. [ Links ]
Coleman Wasik, J.K., Engstrom, D.R., Mitchell, C.PJ., Swain, E.B., Monson, B.A., Balogh, S.J., Jeremiason, J.D., Bran-fireun, B.A., Kolka, R.K. & Almendinger, J.E., 2015, 'The effects of hydrologic fluctuation and sulfate regeneration on mercury cycling in an experimental peatland', Journal of Geophysical Research: Biogeosciences 120, 1697-1715. https://doi.org/10.1002/2015JG002993 [ Links ]
Currie, S.L. 2001, 'The implementation of an environmental decision-making support system: the Mooi River Catchment as a case study', PhD thesis, University for Christian Higher Education, Potchefstroom. [ Links ]
Dallas, H.F. & Day, J.A., 2004, The effect of water quality variables on aquatic ecosystems: a review, WRC report TT 224/04, Water Research Commission, Pretoria, South Africa. [ Links ]
Department of Water Affairs (DWA), 2009, Adopt-a-River Programme Phase II: Development of an Implementation Plan. Water Resource Quality Situation Assessment. Resource Quality Services Project Number WP 9583, viewed 9 February 2018, from http://www.dwaf.gov.za/iwqs/rhp/xtra/Water_Quality_Situation_Assessments.pdf. [ Links ]
Department of Water Affairs and Forestry (DWAF), 1996a, South African water quality guidelines: Volume 1: Domestic Water Use, 2nd Edition, Department of Water Affairs and Forestry, Pretoria, South Africa. [ Links ]
Department of Water Affairs and Forestry (DWAF), 1996b, South African water quality guidelines: Volume 2: Recreational Water Use, 2nd Edition, Department of Water Affairs and Forestry, Pretoria. [ Links ]
Department of Water Affairs and Forestry (DWAF), 1996c, South African water quality guidelines: Volume 3: Industrial Water Use. 2nd Edition, Department of Water Affairs and Forestry, Pretoria. [ Links ]
Department of Water Affairs and Forestry (DWAF), 1996d, South African water quality guidelines: Volume 4: Agricultural Water Use: Irrigation, 2nd Edition, Department of Water Affairs and Forestry, Pretoria. [ Links ]
Department of Water Affairs and Forestry (DWAF), 1996e, South African water quality guidelines: Volume 7: Aquatic ecosystems, 2nd Edition, Department of Water Affairs and Forestry, Pretoria. [ Links ]
Department of Water and Sanitation (DWS), 2016, Classes and Resource Quality Objectives for the Upper Vaal Catchment, Government Gazette No. 39943. [ Links ]
Dickens, C., Pringle, C. & Macfarlane, D., 2011, Procedures to Develop and Implement Resource Quality Objectives, Department of Water Affairs, Pretoria, South Africa. [ Links ]
Douterelo, L., Perona, E. & Mateo, P., 2004, 'Use of cyano-bacteria to assess water quality in running waters', Environmental Pollution, 127(3), 377-384. http://dx.doi.org/10.1016/j.envpol.2003.08.016 [ Links ]
Durandt, J.F., 2012, 'The impact of gold mining on the Witwa-tersrand on the rivers and karst system of Gauteng and North West Province, South Africa', Journal of African Science 68, 24-43. http://dx.doi.org/10.1016/j.jafrearsci.2012.03.013 [ Links ]
Du Toit, M.J., Du Preez, C. & Cilliers, S.S., 2021, 'Plant diversity and conservation of wetlands along an urban rural gradient', Bothalia, 51(1): 45-62 (hardcopy); 1-18 (online) [this issue]. [ Links ]
Elser, J.J., Matzolf, E.R. & Goldman, C.R., 1990, 'Phosphorus and Nitrogen Limitation of Phytoplankton Growth in the Freshwaters of North America: A Review and Critique of Experimental Enrichments', Canadian Journal of Fisheries and Aquatic Sciences 47(7), 1468-1477. https://doi.org/10.1139/f90-165 [ Links ]
Erasmus, J.H. & De Kock, K., 2015, 'The aquatic macroin-vertebrate diversity and physical parameters in the LS and Mooi River, North-West Province', in 7th International Toxicology Symposium in Africa, Peer Reviewed Conference Proceedings, Johannesburg, South Africa, August 31, 2015, pp. 101-102. [ Links ]
Falkowski, PG., Greene, R.M. & Geider, J.G., 1992, 'Physiological limitations on phytoplankton productivity in the ocean', Oceanography 5(2), 84-91. http://dx.doi.org/10.5670/oceanog.1992.14 [ Links ]
Felisberto, S.A, Leandrini, J.A. & Rodrigues, L., 2011, 'Effects of nutrients enrichment on algal communities: an experimental in mesocosms approach', Acta Limnologica Brasil-iensia 23(2), 128-137. http://dx.doi.org/10.1590/S2179-975X2011000200003 [ Links ]
Fosso-Kankeu, E., Manyatshe., A., Van der Berg, D., Lemmer, N., Waanders, F. & Hlanganani, T., 2015, 'Contaminants in Sediments across the Mooi and Vaal Rivers Network in The Vicinity of Potchefstroom', in 7th International Conference on Latest Trends in Engineering &Technology (ICLTET'2015), Irene, Pretoria, South Africa, 26-27 November, 2015. pp. 64-69. [ Links ]
Fu, Q., Zheng, B., Zhao, X., Wang, L. & Liu, C., 2012, 'Ammonia pollution characteristics of centralized drinking water sources in China', Journal of Environmental Sciences 24(10), 1739-1743. http://dx.doi.org/10.1016/S1001-0742(11)61011-5 [ Links ]
Glooschenko, V., 1990, 'Effects of peatland on water quality, fish and wildlife habitat in Canada, a review', in D.F. Whigham, R.E. Good and J. Kvet (eds.), Wetland Ecology and Management: Case Studies, pp. 85-93, Springer Sci-ence+Business Media B.V., Springer, Dordrecht. https://doi.org/10.1007/978-94-009-2115-3 [ Links ]
Guiry, M.D. & Guiry, G.M., 2019, 'AlgaeBase', World-wide electronic publication, National University of Ireland, Galway, viewed 19 January 2019, from http://www.algaebase.org [ Links ]
Heinze, A.W., Truesdale, C.L., DeVaul, S.B., Swinden, J. & Sanders, R.W., 2013, 'Role of temperature in growth, feeding, and vertical distribution of the mixotrophic chrys-ophyte Dinobryon', Aquatic Microbial Ecology 71, 155163. http://dx.doi.org/10.3354/ame01673 [ Links ]
Janse van Vuuren, S. & Taylor, J.C., 2015, 'Changes in the algal composition and water quality of the Sundays River, Karoo, South Africa, from source to estuary', African Journal of Aquatic Science 40(4), 339-357. https://doi.org/10.2989/16085914.2015.1103695 [ Links ]
Janse van Vuuren, S., Taylor, J.C., Gerber, A. & Van Ginkel, C., 2006, Easy identification of the most common freshwater algae, North-West University and Department of Water Affairs and Forestry, Pretoria, South Africa. [ Links ]
John, D.M., Whitton, B.A. & Brook, A.J., 2002, The freshwater algal flora of the British Isles. An identification guide to freshwater and terrestrial algae, Cambridge University Press, Cambridge. [ Links ]
Jordaan, K. & Bezuidenhout, C.C., 2015, 'Bacterial community composition of an urban river in the North West Province, South Africa, in relation to physico-chemical water quality', Environmental Science and Pollution Research, 23: 5868-5880. https://doi.org/10.1007/s11356-015-5786-7 [ Links ]
Kruger, D.J.D., 2014, 'Frogs about town: Aspects of the ecology and conservation of frogs in urban habitats of South Africa', PhD thesis, North-West University, Potchefstroom. [ Links ]
Labuschagne, L., 2017, 'Water quality of the Mooi River North-West Province: A supporting study for the determination of resource quality objectives', MSc thesis, NorthWest University, Potchefstroom. [ Links ]
Le Roux, E., 2005, 'Improving the quality of raw water to Potchefstroom', MSc thesis, North-West University, Potchefstroom. [ Links ]
Lund, J.W.G., Kipling, C. & Le Cren, E.D., 1958, 'The inverted microscope method of estimating algal numbers and the statistical basis of estimations by counting', Hydrobiologia 11, 143-170. [ Links ]
Luyt, D.I., 2018, 'Bird and algal dynamics of two small rivers', MSc thesis, North-West University, Potchefstroom. [ Links ]
Mankiewicz, J., Tarczynska, M., Walter, Z & Zalewski, M., 2003, 'Natural toxins from Cyanobacteria', Acta Biologica Cravoviensia, Series Botanica 45 (2): 9-20. [ Links ]
Manyatshe, A., Fosso-Kankeu, E., Van der Berg, D., Lemmer, N., Waanders, F. & Tutu, H., 2017, 'Dispersion of inorganic contaminants in surface water in the vicinity of Potchef-stroom', Physics and Chemistry of the Earth 100, 86-93. https://doi.org/10.1016/j.pce.2017.04.008 [ Links ]
Muscutt, A.D. & Withers, PJ.A., 1996, 'The phosphorus content of Rivers in England and Whales', Water Research 30(5), 1258-1268. https://doi.org/10.1016/0043-1354(95)00290-1 [ Links ]
North West Department of Agriculture Conservations and Environment (NWDACE), 2008, State of the Environment Report. 2008. North West Province, South Africa, viewed 16 November 2017 from http://soer.deat.gov.za/dm_doc-uments/North_West_full_document_jX1J3.pdf. [ Links ]
Palmer, G., 1969, 'A composite rating of algae tolerating organic pollution', Journal of Phycology 5, 78-82. [ Links ]
Palmer, C.M., 1980, Algae and Pollution - The identification, significance, and control of algae in water supplies and in polluted water. Castle House Publications, Los Angeles. [ Links ]
Pelser, E.L.C., 2015, 'Ecosystem health and water quality of the Mooi River and associated impoundments using diatoms and macroinvertebrates as bioindicators', MSc thesis, North-West University, Potchefstroom. [ Links ]
Rodrigues, L.C., Train, S., Scomparin, V.M.B., Jati, S., Borsal-li, C.C.J. & Marengoni E., 2009, 'Interannual variability of phytoplankton in the main rivers of the Upper Paraná River floodplain, Brazil: influence of upstream reservoirs', Brazilian Journal of Biology 69, 501-516. http://dx.doi.org/10.1590/S1519-69842009000300006 [ Links ]
Sarwade, A.B. & Kamble, N.A., 2013, 'Plankton diversity in Krishna River, Sangli, Maharashtra', Journal of Ecology and the Natural Environment 6(4), 174-181. http://dx.doi.org/10.5897/JENE2013.0409 [ Links ]
Sen, B., Alp, M.T., Sonmez, F., Kocer, M.A.T. & Canpolat, O., 2013, 'Relationship of Algae to Water Pollution and Waste Water Treatment', in W. Elshorbagy and R.K. Chowdhury (eds.), Water Treatment, pp. 335-354, INTECH Open Access Publisher. http://dx.doi.org/10.5772/51927 [ Links ]
StatSoft, Inc. 2017, Statistica (data analysis software system), Version 13.3, www.statsoft.com [ Links ]
Taylor, J.C., Harding, W.R., & Archibald, C.G.M., 2007, An illustrated guide to some common diatom species from South Africa, WRC Report No. TT 282/07, Water Research Commission, Pretoria, South Africa. [ Links ]
Ter Braak, C.J.F. & Prentice, I.C., 1988, 'A theory of gradient analysis', Advances in ecological research 18, 271-317. [ Links ]
Tredoux, G., Engelbrecht, P. & Israel, S., 2009, Nitrate in groundwater. Why is it a hazard and how to control it? WRC Report No. TT 410/09, Water Research Commission, Stellenbosch, South Africa. [ Links ]
Van der Merwe W.J.J. & Jooste W.J., 1988, 'A synecological study of aquatic Hyphomycetes in the Mooi river, western Transvaal, and their significance in the decomposition of allochthonous leaf litter', South African Journal of Science 84(5), 314-320. [ Links ]
Van der Walt, L.J., Winde, F. & Nell, B., 2002, 'Integrated catchment management: The Mooi River (North West Province, South Africa) as a case study', Cuadernos de Investigación Geográfica 28: 109-126. http://dx.doi.org/10.18172/cig.1131 [ Links ]
Van Heerden, D., Jansen van Rensburg, P., Nikinmaa, M. & Vosloo, A., 2006, 'Gill damage, metallothionein gene expression and metal accumulation in Tilapia sparrmanii from selected field sites at Rustenburg and Potchefstroom, South Africa', African Journal of Aquatic Science 31(1), 8998. https://doi.org/10.2989/16085910609503875 [ Links ]
Van Wyk, D.A.B., 2012, 'Diversity and characteristics of yeasts in water sources of the North West Province', MSc thesis, North-West University, Potchefstroom. [ Links ]
Venter, A., Barnard, S., Dickinson, M.A., Janse van Vuuren, S., Levanets, A. & Taylor, J.C., 2013, 'Planktonic algae and cyanoprokaryotes as indicators of ecosystem quality in the Mooi River system in the North-West Province, South Africa', Water SA 39(5), 707-719. http://dx.doi.org/10.4314/wsa.v39i5.16 [ Links ]
Wehr, J.D., & Sheath, R.G., 2003, Freshwater algae of North America, Ecology and Classification, Academic Press, London. [ Links ]
Wetzel, R.G., 2001, Limnology: Lake and river ecosystems. Third Edition. Academic Press, San Diego. [ Links ]
Winde, F., 2010, 'Uranium pollution of the Wonderfontein-spruit: 1997-2008. Part 2: Uranium in water - concentrations, loads and associated risks', WaterSA 3(36), 257-278. [ Links ]
Winde, F., 2011, 'Peatlands as Filters for Polluted Mine Water? A Case Study from an Uranium-Contaminated Karst System in South Africa. Part III: Quantifying the Hydraulic Filter Component', Water SA 3(36), 356-390. https://doi.org/10.3390/w3010356 [ Links ]
World Wide Fund for Nature (WWF), 2011, Agriculture: Facts and Trends: South Africa, viewed 2 November 2017 from http://www.wwf.org.za/downloads/facts_brochure_mock-up_04_b.pdf. [ Links ]
 Correspondence:
Sanet Janse van Vuuren
sanetjansevanvuuren@nwu.ac.za
Submitted: 20 September 2019
Accepted: 29 April 2020
Published: 24 February 2021

